HMSTRUSDT (4h) Pressuring Support Inside a Descending TriangleHMSTRUSDT is consolidating inside a descending triangle on the 4H chart, with price compressing between descending resistance and a horizontal support zone around 0.000171–0.000173.
What makes this setup more bearish is that price has already made several retests of the lower support, while each rebound remains weaker under the descending trendline. Those repeated touches on support often signal that buyers are being gradually exhausted, which increases the probability of a bearish breakdown.
In-depth trading ideas
HMSTR: Rebound Testing $0.000230 Resistance ZoneHMSTR: Rebound Testing $0.000230 Resistance Zone – Liquidity Sweep Setup Unlocks Prime Short Entry
HMSTR has logged an aggressive short-term price surge to retest the crucial $0.000230 resistance ceiling, attracting immediate market attention. However, evaluating the broader technical picture on the H4 timeframe since late July reveals that this sudden upward move fails to alter the primary bearish trend structure, which remains firmly defined by a persistent sequence of lower highs and lower
#HMSTR +34% The move is finally starting to play out from #HMSTR +34% 🚀
The move is finally starting to play out from the accumulation zone we were watching.
Price has pushed higher from the bottom of the range, and now the important part is whether it can keep holding above the breakout area.
Still watching **$0.00028 → $0.00035 → $0.00050** if momentum continues. 🔥
$HMSTR Update Last time I told you guys that as long as HMSTR CRYPTOCAP:HMSTR Update 🐹
Last time I told you guys that as long as HMSTR held above 0.0003 and reclaimed the range, I was expecting a good move. It played out perfectly and we got a 50%+ rally.
After that pump, price lost momentum and dropped back below the support I mentioned. Now it's trading inside the same accumulation zone again.
I'm still bullish as long as price holds above 0.00012-0.00013. If buyers continue defending this area, I wouldn't be surprised to see another push toward the
HMSTRUSDT Forming Bullish MomentumHMSTRUSDT is forming a clear bullish momentum pattern, a classic bullish wave signal that often indicates an upcoming breakout. The price has been consolidating within a narrowing range, suggesting that selling pressure is gradually weakening while buyers are beginning to regain control. With consistent trading volume confirming accumulation at lower levels, the current setup hints at a potential bullish breakout in the near future. The projected move could lead to an impressive gain of around 9
HMSTR Ready for 70% Pump?HMSTR is showing one of the strongest recoveries in the market right now. Trading volume has surged dramatically, and the token has gained more than 100% over the last week, signaling strong speculative interest.
Bullish Signals:
✅ Strong volume expansion
✅ Breakout from major accumulation zone
✅ Buyers aggressively defending dips
✅ Momentum returning to GameFi and TON ecosystem tokens
What to Watch:
📈 A clean breakout above nearby resistance could open the door for another 50–70% move.
⚠️ A
HMSTR Main Trend -80% Descending Channel 08 06 2025Logarithm. Time frame 3 days.
The main trend is a descending channel.
Secondary is an ascending channel.
Local trend is descending and a rollback from the key resistance.
While the price is in a descending channel, it is rational to work and focus on dynamic trend supports/resistances, using this volatility.
Locally, on a breakthrough of the designated trend line. To the resistance of the channel itself (the main trend) from it (the local line of the descending trend) a significant %. Then on
HMSTR / HMSTRUSDT Long Setup | Breaker Block ReclaimMARKET ANALYSIS
HMSTR is currently reacting from a key technical area highlighted on the chart.
As long as the protected support zone remains intact, the bullish market structure remains valid and higher liquidity targets may continue to attract price action.
A breakdown below the invalidation level would weaken the current bullish scenario and require a reassessment of market conditions.
📍 Entry, Stop Loss and Take Profit levels are marked directly on the chart.
━━━━━━━━━━━━━━
⚠️ DISC
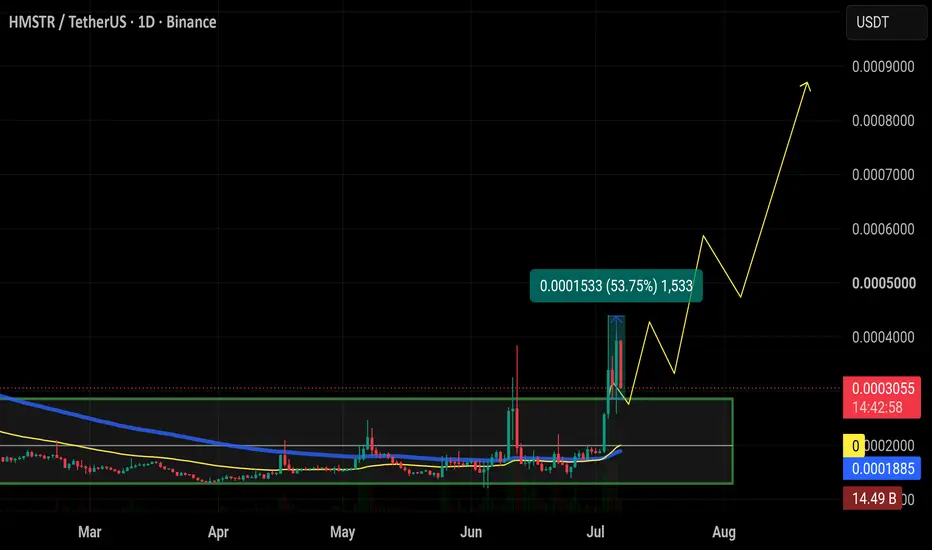
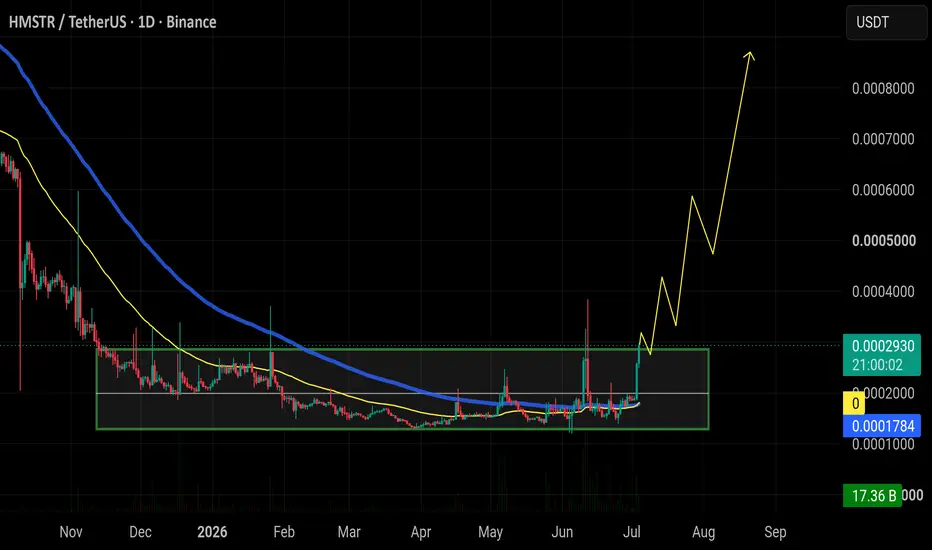
$HMSTR spent months building a base inside this accumulation ranCRYPTOCAP:HMSTR spent months building a base inside this accumulation range while most participants lost interest.
Now price is finally pushing into the range highs after reclaiming the major moving averages. A daily close above this resistance zone could mark the beginning of a much larger expansion phase.
HMSTRUSDT Forming Bullish PennantHMSTRUSDT is forming a clear bullish pennant pattern, a classic bullish wave signal that often indicates an upcoming breakout. The price has been consolidating within a tightening range after a strong move, suggesting that selling pressure is gradually fading while buyers continue to maintain control. With steady volume supporting accumulation at current levels, the setup points toward a potential bullish breakout in the near term. The projected move could lead to an impressive gain of around 30
Hamster Kombat (HMSTR) 1,000% Potential Partial RecoveryNot all projects have the same growth potential. Basically all projects have to go through the same maturation process. A position can take several months to fully develop. It can take a while before our chosen trading pair starts an uptrend. It is very important to make the best possible choice. Diversifying can be appropriate when we have too many choices.
A trading pair can take three months to produce a bullish breakout, then grow for 2 months resulting in a bullish move with 500% growth. A
HMSTR BREAKOUT LOADING🔥 Fortune AI Radar — CRYPTOCAP:HMSTR
Fresh activity detected on CRYPTOCAP:HMSTR today.
Data suggests increasing market interest & buyers stepping in.
Technicals currently lean bullish, with momentum trending upward.
Whales showing hints of accumulation and hype rising among traders.
This coin is flashing strong signals on short-term charts — worth keeping an eye on 👀
Not financial advice — always research before taking decisions
HMSTR Looks Bullish (12H)A liquidity compression is visible on HMSTR and two bullish triggers can be seen.
One is a sweep of the last supply zone and the other is consolidation above a key level.
These compressions do not form on the chart without a reason. Either short sell positions have been closed and liquidated or buyers have entered the market, which appears on our chart as this type of compression.
We have three targets for the bullish move which are marked on the chart.
For entering a position try to enter o
#HamsterThe chart you've shared is for HMSTR/USDT on the weekly (1W) timeframe, and it reveals several notable technical patterns and elements:
🔍 Key Observations:
1. Falling Wedge Pattern:
The price action is forming a falling wedge, which is generally considered a bullish reversal pattern.
The wedge is nearing its apex, indicating a potential breakout soon, either up or down (but statistically, breakouts from falling wedges tend to be upwards).
2. Support Zone:
The price is currently resting o
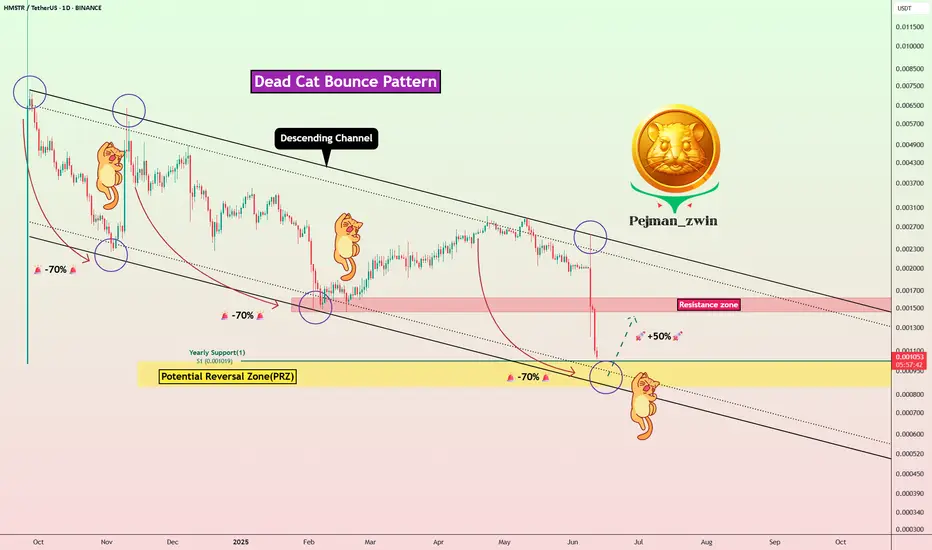
Dead Cat Incoming? HMSTR Eyes +50% Rebound Before Full MeltdownToday, let’s take a look back at HMSTR( BINANCE:HMSTRUSDT ), the token from the Telegram game Hamster Kombat .
While the game quickly gained global popularity and attracted massive user attention, it unfortunately seems to be failing — and may already be on the path to collapse .
Let’s break down some of the key reasons behind Hamster Kombat’s apparent failure :
Widespread Fake Airdrops & Scams:
In 2024–2025, Hamster Kombat became a major target for fake airdrop scams. These sche
HAMSTER CAN EXPLODE TO THE MOON AS NEVER BEFORE..Depending on our study and trends, we expect with high chance that hamster is going to see a new volume in the upcoming time, which will allow this coin to increase to new levels.
These are our expected targets.
$0,0.0024
$0,006
$0,011
$0,015
This coin is at this moment in a stable time frame, and can build unexpectedly in the coming time a new break followed by a whale's increase in volume.
Time will tell if this coin will act as we expect.
There are some important reasons based on data
HMSTR New Update (8H)This analysis is an update of the analysis you see in the "Related publications" section
It now appears to be in the large wave F of a Diametric pattern. Currently, it seems to be in wave C of F, which is a bullish wave.
We expect it to move from the green zone to the red zone and then get rejected downward.
A daily candle close above the invalidation level will invalidate the bearish setup.
For risk management, please don't forget stop loss and capital management
When we reach the first tar