HELIUM BALLOONINGThe floor has been recovered on the March 15th weekly close. Updates with targets and stop loss coming. by ChampagneTrades4
HNTUSDT Bearish Structure Still DominantHNT continues to respect the broader macro downtrend, with price consistently rejecting key resistance levels. The main supply zone around $10.4 previously acted as a major distribution area, confirming strong seller dominance. Price is now trending within a descending structure, and the next area of interest lies near the $0.39 demand zone, which aligns with the projected bearish target on the chart. A breakdown below this level could open the path toward the extended downside target near $0.09. As long as price remains below the descending resistance and macro trendline, the bearish bias remains intact, with potential short opportunities on corrective rallies.Shortby weslad2211
HNT 9x Breakout With Normal Volume Structure HNT 9x Breakout With Normal Volume Structure and Floor Leverage — Clean Setup Overview HNT is printing 1.557 with futures at 1.554, showing an extreme bull reading at 71.19% intensity. Bulls hold 85.6% against just 14.4% bears with 49% clarity. This is the most decisive signal distribution you will see — nearly 9 out of 10 signals favor the bull side. The bounce is 12% at 9x, a confirmed breakout. What makes this setup particularly clean is the supporting structure. Volume is normal with a healthy futures to spot ratio, leverage sits at the floor, and a squeeze is building on both spot and futures simultaneously. When extreme bias meets compressed volatility with floor leverage, the conditions for a sustained move are as aligned as they get. Price Context Spot at 1.557 against futures at 1.554, sitting inside an extreme breakout zone. Retrace is -1.3% with a 12% bounce at 9x, tagged as breakout plus. A 9x bounce multiple is significant — this is not a shallow recovery or a dead cat bounce. Price has moved aggressively off the low and the breakout classification confirms structural levels have been cleared with conviction. Bias The multi-timeframe count reads 48 bull against 7 bear out of 112 signals. EMA structure is overwhelmingly bullish at 8 to 1. Candle structure favors bulls at 12 to 2. Ichimoku TK is bullish at 11 to 3. Spread conviction is 74.5% with an extreme classification. Pattern totals read 2 to 0 bullish with a three soldiers and star pattern. Every structural measure points the same direction. EMA, candles, Ichimoku, and patterns all favor bulls with wide margins. The 74.5% spread conviction is exceptionally high — this level means the timeframes are in strong agreement rather than producing a noisy mixed signal. When spread conviction runs above 70% with this kind of signal count, the bias tends to persist through pullbacks rather than reversing. Volume Intelligence Spot Z-score is 0.36, average. Futures Z-score is -0.2, steady. Combined is -0.14, steady. The classification is normal with direct flow reading neutral. The futures to spot ratio is 3.66x, normal. Raw spot volume is 4.6M against 16.85M futures, or 7.16M against 26.23M in dollar terms. This is a healthy market structure. The ratio is well below the threshold where futures dominance distorts price action. Spot participation is present at average levels, which means this move has real backing even if the volume is not screaming. OBV Z-score is 2.58 with inflow confirmed, and OBV divergence is normal. That 2.58 reading on OBV is a strong accumulation signal — well above two standard deviations. Volume momentum is 0.07 and rising. Spot momentum is contracting at 89.6%. Squeeze Spot squeeze is building at stage 2. Futures squeeze is also building at stage 2. Squeeze divergence reads both compressed, meaning spot and futures are coiling together. Momentum direction is bull with bandwidth at 15.37%. Both sides of the market compressing simultaneously is the aligned signal. When squeeze divergence shows both compressed rather than one side firing without the other, the eventual expansion tends to be more reliable because both spot and futures are participating in the volatility compression. Building at stage 2 means the squeeze is developing but has not yet reached imminent or fired status. The bull momentum direction going in gives the initial lean for the expansion. Leverage Current leverage is 3.73x, normal. The percentile is 10.1%, at the floor. The all-time max was 373.77x and the minimum was 0.67x. The 50-bar range runs from 3.73x to 8.15x. The 200-bar range stretches from 2.21x to 17.25x. Floor-level leverage with an extreme bullish bias is the cleanest configuration for a sustained move. There is no built-up leverage to unwind, no crowded trade to reverse. As the move continues and traders add positions, leverage has massive room to expand — the 200-bar max is 17.25x against a current 3.73x. That expansion capacity means momentum can build through new positioning rather than being threatened by it. Premium Premium reads -0.19%, backward at a Z-score of -0.1. Yield shows -211% APY at -0.1 sigma, leaning slightly bullish. Standard deviation of premium is 0.28%, volatile on both lookbacks. Mean reversion Z sits at 0.41 sigma, normal range. The premium is essentially neutral — no meaningful dislocation to trade against or worry about. The slightly backward lean is consistent with the broader picture of spot leading futures, which is a healthy dynamic in an uptrend. No premium extreme means no premium risk. The move is not being fueled by derivatives excess. Scenarios Scenario 1 — Squeeze Fires Bullish Into Continued Breakout (55%). Everything aligns. Extreme bull bias at 85.6%, 48 to 7 signal count, 74.5% spread conviction, normal volume structure with OBV inflow at 2.58, floor leverage, neutral premium, and both spot and futures compressing together with bull momentum. When the squeeze fires, the expansion has room to run because leverage can build and volume structure is not distorted. This is the highest conviction scenario across any of the signals being measured. Scenario 2 — Breakout Consolidation Before Next Leg (30%). A 12% bounce at 9x has covered significant ground. The -1.3% retrace and contracting spot momentum at 89.6% suggest the market may need to digest the move before continuing. Price consolidates within the breakout zone, the squeeze continues building toward imminent, and the next leg fires from a tighter base. This is not bearish — it is the market catching its breath before the squeeze provides the next catalyst. Scenario 3 — Squeeze Fizzles and Momentum Fades (15%). Despite the extreme bias, the volume is only average on spot and steady on futures. If participation does not increase as the squeeze develops, the compression could resolve into a weak expansion that fades quickly. Watch for spot Z-score to drop below 0 and volume momentum to reverse from rising to falling. The low probability reflects how many signals would need to fail simultaneously for this outcome. Watch List 1. Squeeze transitioning from building to imminent to fired — the progression confirms energy is accumulating 2. Spot Z-score climbing above 0.5 to confirm volume is increasing into the breakout 3. OBV inflow sustaining above 2.0 — currently strong at 2.58 but extreme readings tend to moderate 4. Leverage percentile climbing from 10.1% as new positions enter — healthy expansion fuels the move 5. Spot momentum contraction resolving into expansion — 89.6% contraction suggests the turn is near 6. Futures to spot ratio staying below 5x to maintain healthy market structure 7. Spread conviction holding above 60% to confirm multi-timeframe agreement persists Risk This is the cleanest setup in the current scan. Extreme bias, aligned squeeze, normal volume, floor leverage, and neutral premium rarely show up together. The primary risk is execution timing — entering after a 12% bounce at 9x means the easy part of the move is done. The squeeze building on both sides provides the mechanism for the next leg but it has not fired yet. Waiting for the squeeze to transition to imminent or fired before adding to positions manages the timing risk. Stops should be placed below the retrace level at -1.3% — if the extreme breakout zone fails to hold, the thesis changes regardless of how clean the signals look. The 15.37% bandwidth means the squeeze has room to compress further before firing, so patience may be required. More analysis on my profile. Tags: HNTUSDT, HNT, helium, crypto, breakout, squeeze, volumeanalysis, leverage, bullish, tradingviewLongby stingrayea6
HNT Bull Trap… or the Start of a Massive Move?Yello Paradisers, did you notice what just happened with HNT? While most crypto traders were panicking due to the lower lows, we spotted a hidden bullish divergence forming, and it appears the market is now waking up to it. 💎 After weeks of trending inside a clean descending channel, #HNTUSDT just gave us the first real sign of a potential reversal. The move began with a sharp liquidity sweep below the descending support, trapping late sellers and triggering fresh demand exactly inside the major support zone between $1.307 and $1.363. 💎Zooming in, the MACD is showing a clear bullish divergence, price making lower lows while the MACD formed higher lows. Right after that, we got a bullish crossover, confirming momentum is shifting back in favor of the bulls. These are the exact kind of high-probability signals we wait for, and they’re not common. 💎Now that the price has broken above the descending structure, all eyes are on the next key levels. If HNT can maintain this momentum, we expect a test of the $1.445 area as minor resistance, where a temporary pullback could happen. However, if that level is claimed with strength, the next zone to watch is $1.539, followed by the strong resistance range between $1.730 and $1.74. This is where we'll reassess everything and prepare for either a continuation or rejection. 💎On the flip side, if #HNT breaks down and closes below $1.258, this whole bullish scenario will be invalidated. At that point, we’ll consider this a failed breakout and prepare for downside continuation. Until then, the structure looks strong and healthy. Discipline, patience, and strategy always win. MyCryptoParadise iFeel the success🌴 Longby MyCryptoParadise117
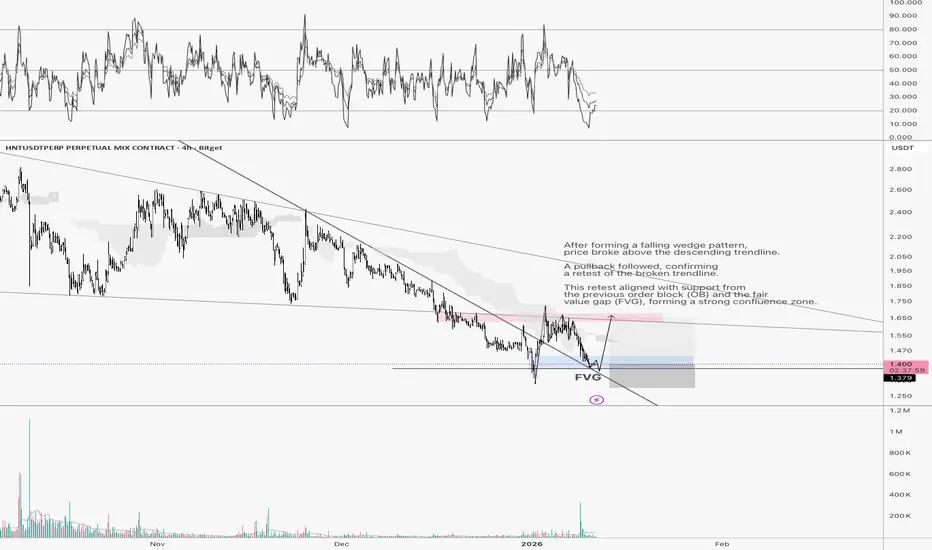
HNTUSDT.PAfter forming a falling wedge pattern, price broke above the descending trendline. A pullback followed, confirming a retest of the broken trendline. This retest aligned with support from the previous order block (OB) and the fair value gap (FVG), forming a strong confluence zone.HLongby Win_Power5
HNTUSDTIn my view, it’s completing its accumulation base, and I’m waiting for a higher low and a higher high. The $1.5–$1.8 zone is a valuable area for accumulation. Bullish leg confirmation comes with a sustained hold above $2.4. by rasooldavarpanah3
HNTUSDT 2D#HNT is moving inside a falling wedge pattern on the 2-day timeframe. Consider buying a small bag here and on the support zone between $1.892 ~ $1.754. If price breaks above the wedge resistance and the 2-day SMA50, the potential targets are: 🎯 $2.401 🎯 $2.741 🎯 $3.046 🎯 $3.351 🎯 $3.785 🎯 $4.338 ❌ Invalidation: a 2-day candle closing below the wedge support. ⚠️ Always remember to use a tight stop-loss and maintain proper risk management.by DigitalChartist3
Helium looking for bottoms. HNT is showing early signs of bearish exhaustion, with a swing failure and clear bullish divergence appearing at a major horizontal support zone. This area has historically acted as an accumulation region, making it a point of interest — but the mid-term trend is still down, so risk management remains essential. Volume is still weak, meaning buyers haven’t stepped in with conviction yet. A shift in market structure would be the confirmation needed for a broader reversal.Longby Mike-BTD3
HNT Ready for a Massive Move or Total Collapse?Yello Paradisers, are you paying attention? Because #HNTUSDT is now at a critical make-or-break level and the next few candles could decide everything. 💎After weeks of downward drift inside a clean descending channel, #HNT has just shown its first real signs of strength. The bounce from the strong demand zone between $1.70 and $1.90 is not random it’s a key zone we’ve been watching since early October. The structure has now shifted from passive to active accumulation, and the market is hinting at a potential breakout. 💎We’re currently trading above $2.25, right inside a mid-range demand zone. If price holds this area and manages to build momentum above $2.40, the door opens for an explosive move towards the minor resistance at $3.15. A successful breakout from this descending channel structure would likely extend the rally even further, with $3.95 standing as the next major resistance and potential profit-taking area. 💎Momentum indicators are flipping. MACD histogram has turned green, and volume is starting to show life again. All eyes are now on how price reacts over the next few days. 💎However, if the market fails to sustain this breakout attempt and slides back below the $2.00 mark, the bullish thesis gets weaker. A breakdown below $1.90 re-exposes the strong demand zone, and if $1.70 fails, invalidation sits at $1.47. Below that, the setup is dead, and we’d be looking at a reset of the entire structure. This is the exact type of environment where inexperienced traders blow up chasing green candles or panic-selling strong demand. Don’t be that trader. MyCryptoParadise iFeel the success🌴 Longby MyCryptoParadise229
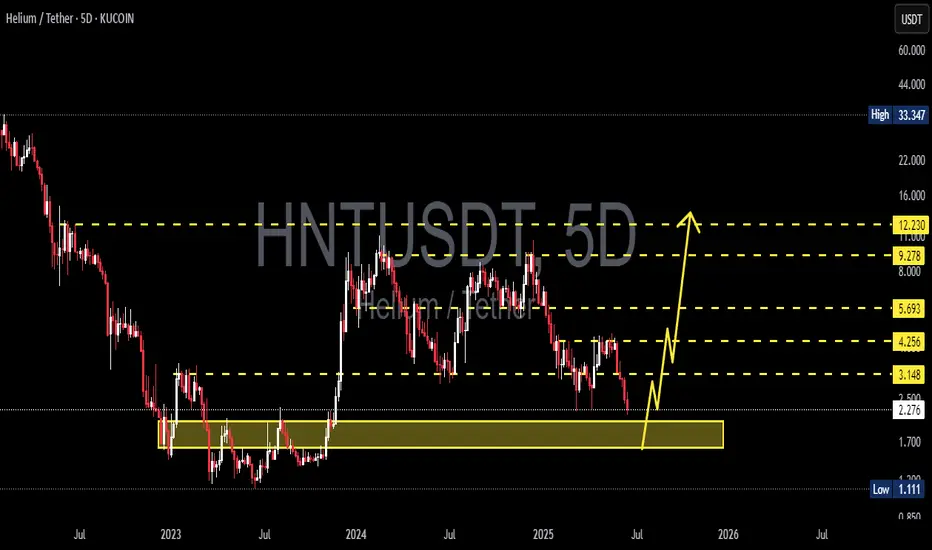
HNT/USDT — Compression Explosion: Accumulation or Capitulation?HNT is once again testing its major historical support zone between 1.70–2.02 USDT, a critical demand area that has acted as a price fortress since 2023. The chart is currently forming a Falling Wedge pattern, a classic structure that signals trend exhaustion and potential reversal. As the wedge tightens near a key support base, volatility compression suggests that a massive move is approaching — either a strong bullish breakout or a capitulation breakdown. --- 🔹 Pattern Explanation The chart reveals a Falling Wedge pattern — a series of lower highs and lower lows that converge, often preceding a bullish reversal when price breaks upward with strong volume. HNT is now hovering right above its historical demand zone, signaling potential smart money accumulation before a larger trend shift. Key Resistance Levels to Watch: 3.168 4.273 5.428 8.110 9.540 USDT Major Support Zone: 1.70 – 2.02 USDT (yellow box) --- 🟢 Bullish Scenario — Reversal Loading If HNT can break and close above the upper trendline of the wedge on the 5D timeframe with strong volume confirmation, it would mark the end of the extended downtrend. Such a breakout could trigger a multi-month recovery rally, with potential upside targets at: 3.16 → 4.27 → 5.42 → 8.11 → 9.54 USDT Given its proximity to the accumulation zone, the risk-to-reward ratio is highly favorable for swing or position traders anticipating a reversal. --- 🔴 Bearish Scenario — Breakdown to Historical Lows However, if the 1.70–2.02 USDT support zone fails, bearish momentum could accelerate. A confirmed 5D close below this level would expose the next potential target near: 1.11 USDT (historical low) Failure to defend this demand zone could trigger another leg of capitulation, likely marking the final phase of the bearish cycle before true bottom formation. --- ⚖️ Conclusion HNT is currently standing at a critical inflection point — a zone that will likely determine the next major trend. The Falling Wedge structure favors a bullish breakout if volume confirms, but a breakdown below 1.70 would shift the structure into a final bearish continuation phase. This is a compression-before-explosion setup — and whichever direction breaks first could define the next several months of HNT’s market structure. #HNT #Helium #HNTUSDT #CryptoAnalysis #TechnicalAnalysis #FallingWedge #SupportZone #Breakout #AltcoinSetup #ChartPattern #BullishSetup #CryptoTraderLongby CryptoNuclear335
Swing Trade Setup on HNT/USDTI’ve spotted a potential retracement play on HNT/USDT that aligns with my swing trading plan. 📊 Setup Details: Entry Zone: Near current consolidation after reclaiming local support Target 1: $5.383 (around the 38% Fibonacci retracement) Target 2: Watching closely for a potential push toward the 50.0% Fib level if momentum continues Stop Loss: $2.305 (below the lowest order block) Risk/Reward Ratio: ~4.52 ✅ 🔍 Technical Confluence: Price is bouncing from a key support zone Super Trend Bullish Fib retracement levels (50% & 61.8%) match with prior supply zones 📅 Timeframe: Swing trade (days to weeks) ⚠ Risk Note: This is not financial advice – always DYOR before entering any trade.Longby ama-Beeps3
HNTUSDT 5D AnalysisHNT ~ 5D Analysis #HNT Buy back on retest of this support block with short term target of at least 20%+ from here.Longby CryptoNuclear7
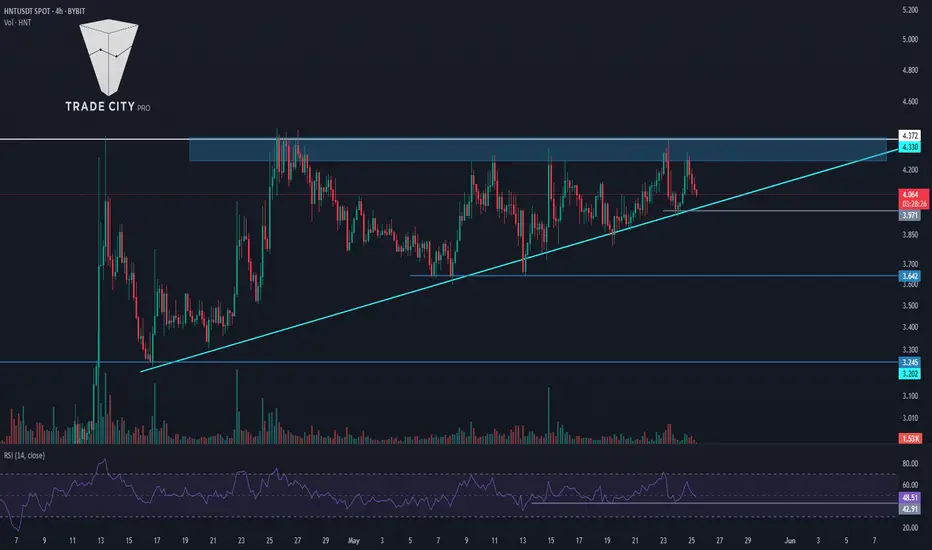
TradeCityPro | HNT: Testing Resistance in DePIN Uptrend Structur👋 Welcome to TradeCity Pro! In this analysis, I’ll review the HNT coin. The Helium project is a U.S.-based Web3 and DePIN initiative. ✔️ This coin has a market cap of $9.26 million and is ranked 97th on CoinMarketCap. ⏳ 4-Hour Timeframe On the 4-hour chart, HNT has an ascending trendline with a resistance zone near 4.372. 💥 If this resistance is broken, the main upward move may begin, and a breakout above this level confirms a bullish trend for HNT. 📈 So for a long position, you can enter on the breakout or a pullback to this zone. The next resistance level is 5.333. 🔽 For a bearish scenario, the ascending trendline must be broken first to signal a potential reversal. A break below 3.971 would be the first confirmation of that trendline break and can be used as a short trigger. ⚡️ The main short trigger would be a break of 3.642, which could push the price down toward 3.245. 🧩 The RSI oscillator is currently sitting on the 42.91 support; a breakdown here would confirm bearish momentum for a short setup. 📝 Final Thoughts This analysis reflects our opinions and is not financial advice. Share your thoughts in the comments, and don’t forget to share this analysis with your friends! ❤️Longby tradecitypro66234
HNT | Short | Bearish Flow + VWAP Rejection | (May 2025)HNT | Short | Bearish Flow + VWAP Rejection | (May 2025) 1️⃣ Short Insight Summary: Despite some recent bullish headlines, Helium is showing strong signs of distribution. Spot selling and money outflows suggest potential downside risk as price continues to reject key levels. 2️⃣ Trade Parameters: Bias: Short Entry: Near VWAP rejection (~$4.30–$4.50 range) Stop Loss: Invalidation above $4.70 — reclaiming this would suggest strength returning TP1: $3.38 — short-term structure support TP2: $2.48 — deeper demand zone TP3: Extended target towards zero if macro weakness continues 3️⃣ Key Notes: ✅ Tech Overview: Helium operates a decentralized wireless network for IoT and mobile devices using a unique "Proof of Coverage" model. It migrated to Solana in 2023, raising some concerns about long-term conviction in its original tech. ✅ Partnerships: Names like AT&T and Dish Network have been associated in various stages, but recent SEC settlements and community skepticism have clouded sentiment. ❌ Current Flow: 30-minute chart: Slowing inflow 4H chart: Money is actively flowing out Spot selling and aggressive short liquidations indicate market maker-driven moves, not organic growth Rejections at VWAP confirm heavy sell pressure around $4.30–$4.50 ❌ Bearish Signs: Rejected twice at the VWAP level Lower highs forming, no clean breakout structure Correlation to Bitcoin — with BTC going sideways, HNT has lost momentum Price has dropped over 76% since Dec 2024 4️⃣ Follow-up Note: Will continue to monitor price action and volume near TP1 and TP2. A reclaim of $4.70 invalidates this setup. Please LIKE 👍, FOLLOW ✅, SHARE 🙌 and COMMENT ✍ if you enjoy this idea! Also share your ideas and charts in the comments section below! This is best way to keep it relevant, support us, keep the content here free and allow the idea to reach as many people as possible. Disclaimer: This is not financial advice. Always conduct your own research. This content may include enhancements made using AI. Shortby Risk_Adj_Return1
HNTUSDT Setting Up for a Breakout? Don’t Miss This MoveYello, Paradisers! what if one of the quietest altcoins on the board right now is actually setting up for a move that could catch most retail traders off guard? While the market’s been focused on noisy large caps, #HNTUSDT has been silently showing strength, forming a healthy bullish structure, and reclaiming key technical levels. We've been closely tracking its behavior across multiple timeframes—and the signs are becoming too strong to ignore. 💎#HNT has recently flipped a lower timeframe resistance into clean support, a classic early probable indicator that bulls are gaining control. What adds more credibility to the setup is the formation of a bullish market structure, marked clearly by consistent higher highs and higher lows. This is not just a short-term bounce. The pair has also broken out of a long-standing descending resistance trendline, a breakout that many likely underestimated. What's even more important is how the price has been respecting this broken trendline ever since, turning previous resistance into dynamic support—which is a textbook sign of a trend reversal gaining traction. 💎Zooming out slightly, the pair has also reclaimed a critical medium-term resistance zone, now acting as solid support. This is another strong bullish probability because it shows that buyers are stepping in with confidence at levels where they previously struggled. 💎The 1H chart further confirms the momentum, with clear market structure continuing to form, and the price now respecting multi-timeframe EMA-12. Historically, this EMA has acted as a pivot point for HNTUSDT whenever price has maintained above it, impulsive upside movements followed. So the fact that it’s currently being respected again adds confluence to the bullish probability building here. 💎To strengthen the case even further, the RSI is flashing a hidden bullish divergence, which tends to appear during retracements in strong uptrends and often precedes continuation moves. This subtle yet powerful signal is often ignored by inexperienced traders, but when spotted at the right time like now it can greatly enhance the probability of catching the next leg up. 💎From a resistance perspective, we’re watching two zones closely. The first significant area of supply sits between $3.85 and $4.02—a potential short-term barrier where some profit-taking might occur. However, if the bulls continue to defend the current structure and push through this level, the next major resistance lies between $4.40 and $4.55, which could offer a stronger reaction and potential rejection point 💎As always, we need to remain strategic. The invalidation of this bullish outlook would occur with a candle close below the key trendline and support region at $2.708. That’s where structure breaks down, and the probability flips against us. Until then, this is a high-probability setup that aligns well with both technical structure and momentum indicators. Strive for consistency, not quick profits. Treat the market as a businessman, not as a gambler. Be patient, stay alert, and follow the setup with discipline—because this is how we win long-term, Paradisers. MyCryptoParadise iFeel the success🌴 Longby MyCryptoParadise8
$HNT @helium ─ Future Outlook Wyckoff Re-AccumulationFWB:HNT @helium @HeliumFndn ─ Future Outlook 👁️ Wyckoff Re-Accumulation Schematic #1 & #2 scenarios.Longby Bulltro225
HNT/USDT CAN TARGET $5 soon -> Helium TIMES IS BACKHNT/USDT CAN TARGET $5 soon We will follow this coin. Our goal is to follow the coins that have the most chance to break.Longby SatochiTraderUpdated 3
Helium HNT bullish moveWhat Is Helium (HNT)? Helium (HNT) is a decentralized blockchain-powered network for Internet of Things (IoT) devices. Launched in July 2019, the Helium mainnet allows low-powered wireless devices to communicate with each other and send data across its network of nodes. Nodes come in the form of so-called Hotspots, which are a combination of a wireless gateway and a blockchain mining device. Users who operate nodes thus mine and earn rewards in Helium’s native cryptocurrency token, HNT. I think helium will soon rise to a value 19 usdt. Good entry now or less. Value 3 and 2.3 are possible. Total supply: 177.39M HNT Max. supply: 223M HNT Circulating supply: 177.39M HNT This is only my idea guys. This is not financial advice ! Please do your analysis and consider investing !! Thanks for supp.Longby df777112
HNTUSDT 5DHNT ~ 5D Analysis #HNT So far it still continues to maintain this support block. Buy from here if you still have a Conviction on this coin.Longby CryptoNuclear4
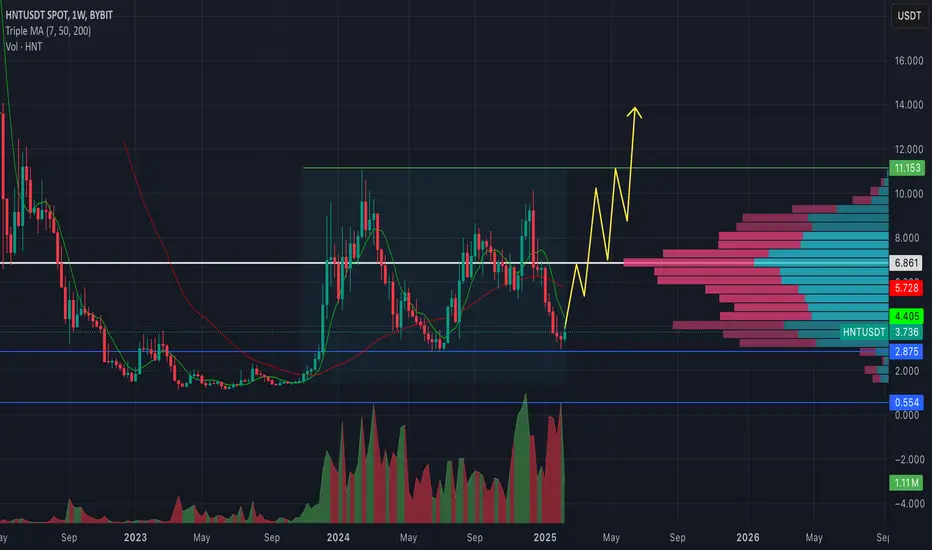
HNT/USDT Trading ScenarioThe price chart of the asset shows a significant increase in trading volumes within a broad range from $2.875 to $11.153. From a volume analysis perspective, despite pronounced volatility, market participants continue to accumulate the asset within the current price corridor. At the moment, the asset's price is below the POC (Point of Control) level and has bounced off the support level at $2.875, which marks the lower boundary of the active range. Given the current dynamics, a gradual price movement toward the upper boundary of the range can be expected, which may lead to a breakout of this level and further development of the upward trend. Such scenarios are supported by the fact that increasing trading volumes in the direction of the current trend typically signal its stability and the likelihood of continuation.by Rick_SimpleSwap4
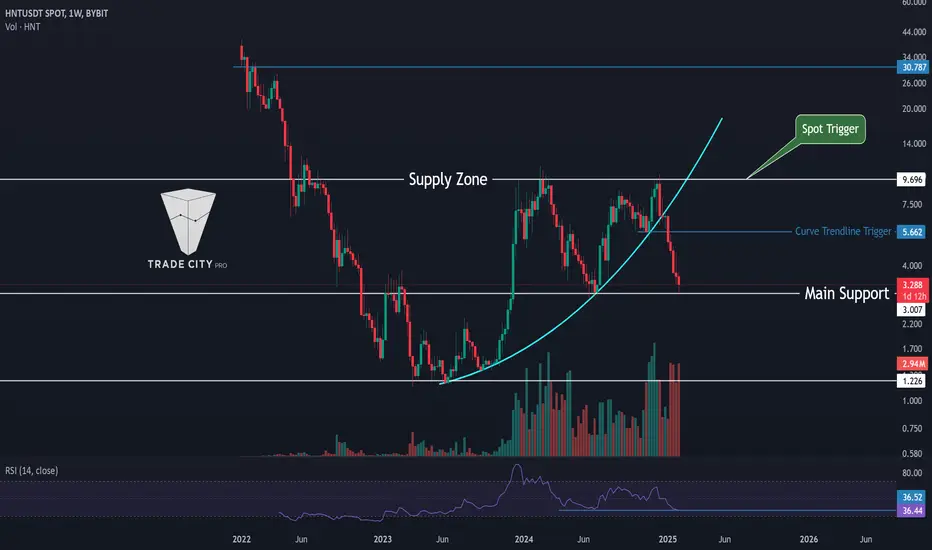
TradeCityPro | HNT: Key Support & Potential Breakout Levels👋 Welcome to TradeCity Pro! In this analysis, I will review the HNT coin. This project is part of the Web & IoT sector and operates within the Solana ecosystem. 📅 Weekly Timeframe In the weekly timeframe, we can see a consolidation box that formed after a strong upward leg. The bottom of this box is at $3.007, while the top is at $9.696. 🔍 A curved trendline is also visible, which previously supported the price from $1.226 to $9.696. However, this trendline was broken, triggering a downward move. As a result, selling pressure increased, leading to a decline towards the bottom of the consolidation box. 🔽 Currently, the price is at a critical support level that could determine the trend for the coming months. If RSI stabilizes below 36.52, it would indicate strong bearish momentum, increasing the likelihood of a break below $3.007. ⚡️ If this support level is broken, the market structure will change, and the price could drop further to the $1.226 support level. 📈 If the price rebounds from this support and starts forming a bullish structure, the most important breakout trigger will be at $9.696. If this level is broken, the next upward leg could begin, with a target of $30.787. 📅 Daily Timeframe In the daily timeframe, we can observe the latest price movement in greater detail. 💥 After reaching the $9.210 resistance and facing rejection, bearish momentum intensified, causing the price to decline sharply in a waterfall pattern, dropping to $3.177. 🔑 In waterfall declines, a trendline usually forms, and breaking this trendline typically ends the move, leading to a range-bound phase. Therefore, if the price breaks this trendline, I expect the downward leg to end. Confirmation could also come from RSI breaking above 43.18. 📉 For short positions, an entry can be considered if the $3.177 support breaks. If this happens, stronger bearish momentum could push the price toward the $2.104 support level. However, I believe that if the price ranges and consolidates above $3.177 before breaking down, the short setup would be more reliable. 🔼 For long positions, no clear structure has formed yet. We need to wait for price action to develop and provide valid entry triggers.The first potential trigger is at $4.220, followed by $5.474.However, these levels could shift if a new price structure forms, so I recommend waiting for updated triggers before entering a long position. 📊 Market volume analysis shows that selling volume dominates, with large red candles exceeding the size of green candles during corrections. This suggests that sellers currently control the market momentum. 📝 Final Thoughts This analysis reflects our opinions and is not financial advice. Share your thoughts in the comments, and don’t forget to share this analysis with your friends! ❤️by tradecitypro6672
Trading opportunity for HNTUSDTBased on technical factors there is a Buy position in : 📊 HNTUSDT 🔵 Buy Now 🪫Stop loss 2.970 🔋Target 4.250 📏 R/R 2 💸RISK : 1% We hope it is profitable for you ❤️ Please support our activity with your likes👍 and comments📝 Longby UnknownUnicorn94913244
HNTThere might be a bit more pain before a reversal occurs. Keep a close watch on this chart.by denispeshevskiUpdated 2