HOLOUSDT Forming Ascending ChannelHOLOUSDT is forming a clear ascending channel pattern, a classic bullish wave signal that often indicates an upcoming breakout. The price has been moving within a rising channel, suggesting that buyers are gradually gaining control while selling pressure remains manageable. With consistent volume supporting the upward structure, the setup hints at a potential bullish continuation soon. The projected move could lead to an impressive gain of around 40% to 50% once the price breaks above the channel resistance.
This ascending channel pattern can signal sustained bullish momentum when price continues to respect the channel’s support and resistance levels, representing a potential shift in market sentiment from bearish to bullish. Traders closely watching HOLOUSDT are noting the strengthening momentum as it approaches the upper breakout zone. The good trading volume adds confidence to this setup, showing that market participants are positioning early in anticipation of further upside.
Investors’ growing interest in HOLOUSDT reflects rising confidence in the project’s long-term fundamentals and current technical strength. If the breakout confirms with sustained buying volume, this could mark the start of a fresh bullish leg. Traders might find this a valuable setup for medium-term gains, especially as the ascending channel develops and buying momentum accelerates.
✅ Show your support by hitting the like button and
✅ Leaving a comment below! (What is You opinion about this Coin)
Your feedback and engagement keep me inspired to share more insightful market analysis with you!
In-depth trading ideas
HOLOUSDT - Accumulation Zone, Massive Breakout or Distribution?📊 Technical Analysis
💵 Coin: NASDAQ:HOLO #HOT 🪙
⏳ Time Frame: 2D ⏰
📈 Pattern: 🟨 Accumulation Range (Sideways Consolidation / Re-Accumulation)
📌 HOLO is currently trading within a long-term accumulation zone after experiencing a significant bearish decline. The sideways price action suggests that 📉 selling pressure is gradually fading, while 🐂 buyers and 🐻 sellers continue battling for control within the same price range.
🟨 The yellow box on the chart represents the Accumulation Zone, where price has repeatedly bounced from the 🛡️ lower support and been rejected by the 🚧 upper resistance. The longer the market consolidates within this range, the greater the potential for a ⚡ strong impulsive move once a confirmed breakout occurs.
---
🟨📦 Accumulation Zone
🛡️ Support Area: ± 0.0650 – 0.0670
🚧 Resistance Area: ± 0.0850
✅ As long as the price remains inside this range, the 🟨 accumulation structure remains valid.
---
🟢🐂 Bullish Scenario
✅ A bullish confirmation will only occur if HOLO successfully 🚀 breaks out and 📈 closes strongly above the 0.0850 resistance.
📊 If the breakout is accompanied by 🔊 increasing trading volume, the probability of continuing toward higher resistance levels will increase significantly.
🎯 Bullish Targets:
🥇 0.1020
🥈 0.1190
🥉 0.1630
🏆 0.2250
⚡ The stronger the breakout volume, the higher the probability that price will continue its uptrend without revisiting the accumulation zone.
---
🔴🐻 Bearish Scenario
⚠️ If the price is rejected once again at the upper resistance and fails to break out, HOLO may continue 🔄 moving sideways for an extended period.
❌ If the 0.0650 support zone is broken with a strong candle close, the 🟨 accumulation structure will be considered invalid.
📉 A breakdown below support could open the door for price to retest the 📍 previous low area.
---
📚🧩 Pattern Explanation
🏗️ Accumulation Range
📖 This pattern represents a phase where market participants begin 🛒 accumulating positions after a prolonged downtrend.
🔍 Key Characteristics:
🔹 📉 Volatility gradually decreases.
🔹 ↔️ Price moves sideways within a defined range.
🔹 🛡️ Support and 🚧 resistance are tested multiple times.
🔹 🐻 Sellers begin losing control.
🔹 🚀 A breakout often results in a strong price expansion because momentum has been building throughout the consolidation phase.
💡 The longer the accumulation phase lasts, the greater the potential for ⚡ explosive volatility once price successfully breaks out of the range.
---
📝🔎 Conclusion
📌 🟨 HOLO remains in a medium-term accumulation phase.
📌 🚧 The 0.0850 level is the key resistance that will determine the next major trend.
📌 🔄 As long as price stays within the current range, sideways consolidation remains the primary scenario.
📌 🚀 A confirmed breakout above resistance could pave the way toward the following targets:
🎯 0.1020 ➜ 0.1190 ➜ 0.1630 ➜ 0.2250
📌 ⚠️ On the other hand, losing the support zone would invalidate the accumulation structure and significantly increase the probability of further downside.
---
💡✨ Market Insight
🕰️ The longer an asset remains in an accumulation phase, the more energy it builds for a potential explosive move. This makes both the breakout and breakdown levels critical areas that every trader should monitor closely.
---
#HOLO #HOT #HOLOUSDT #Crypto 🚀 #CryptoTrading 📈 #TradingView 📊 #TechnicalAnalysis 📚 #PriceAction #Accumulation 🟨 #ReAccumulation #Breakout ⚡ #Support 🛡️ #Resistance 🚧 #Altcoins #Bullish 🐂 #Bearish 🐻 #Binance #CryptoAnalysis #SwingTrading
HOLO/USDT (4h) Testing Ascending Channel SupportHOLO/USDT is trading near the lower boundary of an ascending channel on the 4H chart after rejecting from the upper half of the structure.
Holding the channel support could trigger a recovery toward the midline and upper resistance. A confirmed close below the lower boundary would weaken the bullish structure and favor further downside.
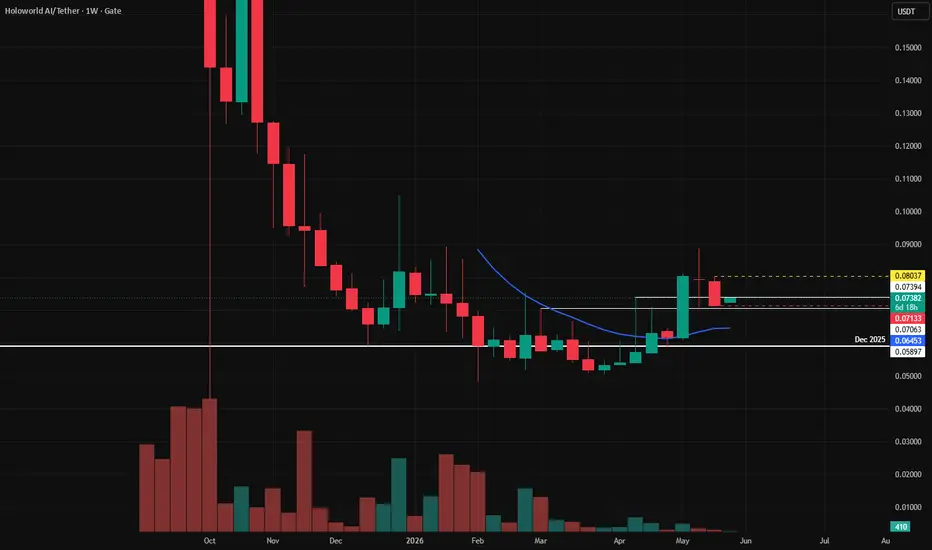
HOLO | May, 2026 | The time to go long has come- Timeframe: Weekly
- Trade type: Buy stop order
- Price: 0.08037
- Take Profit: Open
- Stop Loss: 0.07133 (-11.20 %)
Idea: Long on a breakout above last week's high — bullish momentum continuation.
Entry: Buy stop above last week’s high.
Stop-loss: Below the low of the same candle.
If the weekly candle closes below this level, the trade is invalidated.
Take Profit: Trailing stop following the lows of new weekly candles.
Feel free to like and share your thoughts in the comments.
HOLOUSDT 1D#HOLO has broken above the falling wedge on the daily chart, and the retest has been completed successfully. The RSI is showing continued upward momentum. The targets are:
🎯 $0.0702
🎯 $0.0763
🎯 $0.0823
🎯 $0.0910
🎯 $0.1020
⚠️ Always remember to use tight stop-losses and maintain proper risk management.
HOLOUSDT is trading at 0.06700HOLOUSDT is trading at 0.06700 spot against 0.06561 futures with spot volume printing 58.56M to 256.56M futures — roughly a 4.4x futures-to-spot ratio, well within normal range and not flagging manipulation. Dollar flow is 3.92M spot versus 17.19M futures, a thin but not alarming participation spread. Price is sitting at 10.3% bottom of its full range, historically cheap against the all-time high prints of 0.07501.
36 green signals to 19 red out of 112 gives a bull reading of 35.34% at 2.09x with clarity at 49.11%. EMA structure is outright bearish at 0 green to 6 red. Ichimoku TK confirms weakness at 3 green to 10 red. Candle signals are the outlier — 14 green to zero red is as clean as it gets, and C>T holds at 10 green to 3 red. DD/SS reads 2 supply to 3 demand, slight demand lean. Squeeze has been building for 8 bars in HIGH compression, momentum pointing bull, bandwidth at 25.2%.
Spot Z at -0.14, futures Z at -0.10, combined at -0.14 — all steady, no acceleration on either side. Spot Z 5-bar trajectory is rising from -0.33 to 0.2 but momentum is still soft. Spot:Fut reads Normal with no ignition. Bull:Bear Z at 0.24 to -0.53 is neutral. The 5-bar price move is only 20.9%, consistent with a coiling phase rather than a breakout.
Leverage has compressed to 4.29x and is declining, sitting at 19.5% percentile — floor. This mirrors the price percentile floor reading at 10.3%. All-time max leverage was 21.14x just 121 bars ago, and AT Min leverage of 0.2x is 200 bars behind. The structural de-leveraging is deep and the setup looks washed out from a risk-clearing standpoint.
OBV Z at 0.26 with a 5-bar move from 0.14 to 0.11 reads Inflow — buyers are slowly accumulating but with low conviction. No OBV divergence, no whale prints, liquidations are clear. The critical flag here is the Squeeze Divergence reading Dry Fire — both the spot and futures squeezes have fired simultaneously but the volume behind the move is not confirming. That is a structural warning that the squeeze release may not hold without a volume catalyst stepping in.
The honest read: HOLOUSDT has all the right structural ingredients — leverage at floor, price at historical bottom, premium in extreme backwardation at -5.2σ which is a deeply bullish funding signal, and a 8-bar squeeze that has just fired. But the Dry Fire divergence is the red flag that cannot be ignored. Candles are screaming bull while EMA and Ichi are still bearish, and volume is not rushing in yet. This needs OBV Z to accelerate above 0.5 with spot Z breaking out of the -0.14 range before committing. Watch the demand zone at 0.0500 as the key floor.
Is That Crypto Pump Real? Data Says No. Here's Why.
Stop Losing Money to Fake Volume. Find Real Moves Now.
Trade the REAL Crypto Volume. Stop Getting Faked Out.
HOLOUSDT Extreme Bull But Futures Only Trap With Imminent SqueezHOLOUSDT 27/02/2026 19:14
💰 0.0698 | Fut: 0.0673 🔥 Extreme BULL 91.67%
🟢(95.8%) : 🔴(4.2%) ⏳Clarity: 43%
Retrace: -6.9% Bounce: 44.8% 6.5x 💥 BO+
HOLO is trading at 0.0698 spot and 0.0673 futures with an extreme bullish structure reading 95.8 to 4.2 in favor of buyers across 46 bull signals against 2 bear out of 112 total. The counter-trend depth sits at 11 to 1 bullish. The spread at 91.7 percent with extreme conviction is near the ceiling of what the system can produce. The retrace is at negative 6.9 percent with a 44.8 percent bounce at 6.5x ratio reading breakout plus. Clarity at 43 percent is low, which creates tension against the structural dominance.
The internals are overwhelmingly bullish. EMA reads 6 to 0 clean. Candlestick bias is 14 to 0 clean. Ichimoku sits at 9 to 1. Three soldiers at 2 to 0. Star patterns 1 to 0. Pattern totals 3 to 0. Engulfing 3 to 0. Supply and demand zones at 2 supply versus 3 demand. Every structural pillar is aligned with near-zero opposition.
The squeeze is the critical variable. It reads IMMINENT at 53 bars of compression with bull momentum rising at 23.96 percent bandwidth. That is an exceptionally long compression period. Fifty-three bars of stored energy waiting to discharge into a market where 95.8 percent of structural signals are bullish. When this fires, the release will be significant.
But the squeeze divergence flags the trap. The futures squeeze has FIRED while the spot squeeze shows no activity. Squeeze momentum is expanding downward at 641.1 percent on the spot side. The squeeze divergence reads futures only trap. This is the same pattern that appears in leveraged speculation setups where futures markets front-run a move that spot has not confirmed.
The premium reads negative 3.74 percent with a Z-score of negative 7.8. The yield is negative 4098 percent APY at negative 7.8 sigma bull. Futures are trading at a deep discount to spot. The standard deviation at 0.445 percent reads volatile with the mean Z at negative 1.35 sigma falling. That falling mean Z is significant because it means the premium dislocation is not just extreme but actively deteriorating.
Volume paints the concern clearly. Spot Z sits at negative 0.51 quiet while futures Z reads 0.03 average. The combined Z is negative 0.5 quiet. Volume is essentially absent from this move. The futures-to-spot ratio at 6.68x is elevated with dollar volume at 3.52 million spot versus 23.55 million futures. Directional flow reads neutral with the bull-to-bear volume Z split at negative 0.26 versus negative 0.42, flat on both sides. Volume momentum is rising at 0.02, barely a pulse. No whale activity. Liquidations clear.
This is the sharpest conflict in the data. The structure reads 95.8 percent bullish with 46 to 2 counters and 11 to 1 depth. The squeeze has 53 bars of imminent compression. But volume is quiet at negative 0.5 combined Z with neutral flow, the futures squeeze has fired without spot confirmation, the premium is at negative 7.8 sigma and falling, and the futures-to-spot ratio at 6.68x elevated means the leveraged market is dominating the real market by nearly 7 to 1 in dollar terms.
The bull case requires the 53-bar spot squeeze to fire with volume Z breaking above 1.0 and directional flow shifting bull dominant. If the imminent squeeze releases upward with real spot participation arriving, the structural perfection at 95.8 percent combined with 53 bars of stored energy creates the conditions for an explosive move. The 3 demand zones beneath price provide the support structure. The futures squeeze already firing could be interpreted as the leveraged market leading the spot market into the breakout, with spot confirmation imminent.
The trap reversal case is the risk that cannot be ignored. Quiet volume at negative 0.5 combined Z, neutral directional flow, no whale activity, a futures only fired squeeze, a negative 7.8 sigma premium falling, and a 6.68x elevated futures-to-spot ratio collectively describe a setup where the structural bullishness is built on futures speculation rather than spot accumulation. If the spot squeeze fires downward rather than upward, or if the futures premium snaps back toward the mean while volume remains quiet, the 91.67 percent extreme read becomes the ceiling rather than a launching pad. The 53-bar compression guarantees a violent move. It does not guarantee the direction.
Watch for the spot squeeze to fire. Upward with volume Z breaking above 1.0 and bull dominant flow confirms the structure and validates the extreme read. Downward or sideways with volume remaining quiet and the premium reverting from negative 7.8 sigma would confirm the futures only trap and signal that the structural perfection was built on leveraged foundations. The 53-bar imminent status means resolution is close. The direction of volume when it triggers determines everything.
More analysis on my profile.
🎯 Target: 1K Followers
👉 Follow: stingrayea
Tags: HOLOUSDT, HOLO, crypto, volume, squeeze, breakout, premium, leverage, trap, futures, structure
buy medium We have an investment setup here. We are waiting for an entry from the levels marked at the bottom inside the pink box, which represent the designated entry zone.
There is also a distant target clearly defined on the chart around the 0.269 level. This setup offers a medium- to long-term profit potential as illustrated.
The analysis is based on a fractal approach, where a previous price behavior was identified and replicated exactly as shown on the chart.
HOLOUSDT Forming Bullish ReversalHOLOUSDT is forming a clear bullish reversal pattern, a classic bullish reversal signal that often indicates an upcoming breakout. The price has been consolidating within a narrowing range, suggesting that selling pressure is weakening while buyers are beginning to regain control. With consistent volume confirming accumulation at lower levels, the setup hints at a potential bullish breakout soon. The projected move could lead to an impressive gain of around 90% to 100% once the price breaks above the wedge resistance.
This falling wedge pattern is typically seen at the end of downtrends or corrective phases, and it represents a potential shift in market sentiment from bearish to bullish. Traders closely watching HOLOUSDT are noting the strengthening momentum as it nears a breakout zone. The good trading volume adds confidence to this pattern, showing that market participants are positioning early in anticipation of a reversal.
Investors’ growing interest in HOLOUSDT reflects rising confidence in the project’s long-term fundamentals and current technical strength. If the breakout confirms with sustained volume, this could mark the start of a fresh bullish leg. Traders might find this a valuable setup for medium-term gains, especially as the wedge pattern completes and buying momentum accelerates.
✅ Show your support by hitting the like button and
✅ Leaving a comment below! (What is your opinion about this Coin?)
Your feedback and engagement keep me inspired to share more insightful market analysis with you!
HOLOUSDT UPDATEHOLO
UPDATE
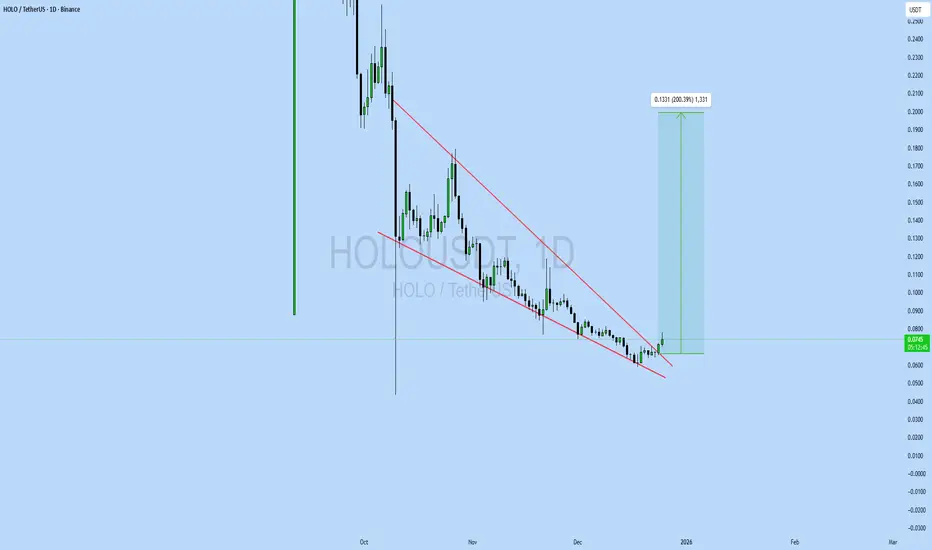
HOLO Technical Setup
Pattern: Falling Wedge Pattern
Current Price: 0.0745 USDT
Target Price: 0.1331 USDT
Target % Gain: 69.80%
Technical Analysis: HOLO is breaking out of a falling wedge pattern on the 1D chart, signaling bullish potential. Price has successfully pushed above the wedge resistance after prolonged consolidation, with strong bullish candles confirming the breakout. The projected move targets the upper resistance zone near 0.1331 USDT, aligning with the measured move from the wedge structure.
Time Frame: 1D
Risk Management Tip: Always use proper risk management.
HOLOUSDT UPDATE#HOLO
UPDATE
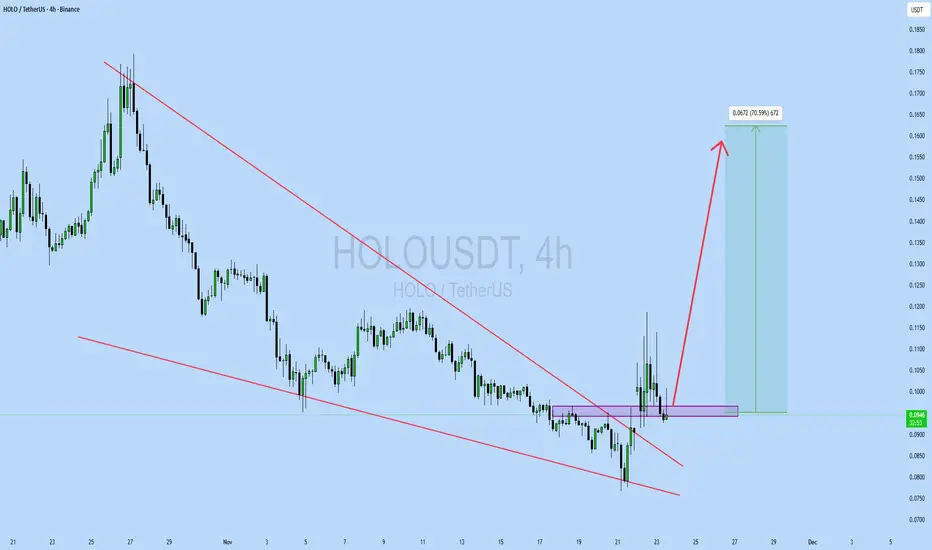
HOLO Technical Setup
Pattern: Falling Wedge Pattern
Current Price: $0.0947
Target Price: $0.1610
Target % Gain: 70.59%
Technical Analysis: HOLO has broken out of a falling wedge pattern on the 4H chart, signaling a potential bullish reversal. Price reclaimed the breakout zone highlighted in the purple support block, showing buyers stepping in. The recent wick spikes and recovery back above the breakout level strengthen the bullish case as the chart pushes toward key resistance levels.
Time Frame: 4H
Risk Management Tip: Always use proper risk management.
HOLOUSDT 12H#HOLO is moving inside a falling wedge pattern on the 12H timeframe and has recently bounced off the support. Price is now approaching the wedge resistance and is on the verge of a potential breakout. If the breakout confirms, the upside targets are:
🎯 $0.1151
🎯 $0.1383
🎯 $0.1571
🎯 $0.1758
🎯 $0.2025
🎯 $0.2365
⚠️ Always remember to protect your capital with a proper stop-loss and disciplined risk management.
HOLOUSDT UPDATE#HOLO
UPDATE
HOLO Technical Setup
Pattern: Bullish Falling Wedge
Current Price: $0.1607
Target Price: $0.2993
Target % Gain: 86.20%
NASDAQ:HOLO is breaking out of a bullish falling wedge pattern on the 1D timeframe. Current price is $0.1607 with a target near $0.2993, indicating about 86% potential upside. The breakout shows renewed bullish strength, suggesting possible continuation toward higher levels.
Time Frame: 1D
Risk Management Tip: Always use proper risk management.
HOLO/USDT – Key Levels & Trade Plan🟢 HOLO/USDT – Key Levels & Trade Plan
Bias: Mildly Bullish (as long as $0.413 holds)
Technical Outlook
Price recently tested support at $0.413–$0.420 and showed signs of a rebound.
Indicators:
RSI approaching recovery from oversold region.
MACD showing bullish divergence.
Bollinger Bands contracting → potential volatility squeeze.
Overhead resistance at $0.438–$0.447 has capped recent rallies.
Trade Plan
Long Setup
Entry: $0.420 – $0.426
Stop-Loss: $0.408 (below support)
Targets:
TP1: $0.438
TP2: $0.447 – $0.452
TP3: $0.465
Short Setup (only if breakdown occurs)
Trigger: Close below $0.413 with strong volume
Stop-Loss: $0.422
Targets:
TP1: $0.398
TP2: $0.386
TP3: $0.372
I’m mildly bullish while $0.413 holds. If buyers sustain momentum, a move toward $0.447–0.465 is on the table.
But a clean breakdown under $0.413 invalidates longs and opens downside targets.
👉 Always manage risk—levels above are for educational purposes, not financial advice.
HOLO/USDT🔍 Key Technical Zones:
🔽 Descending Resistance Trendline: Price has touched and respected this level multiple times. A breakout above this trendline could signal a bullish move.
✅ Support Zone (Green Box):
Around $0.42 – price has held this level multiple times, forming the base of the wedge. A strong bounce from here increases bullish probability.
🔼 Immediate Resistance (Purple Box):
Around $0.45 – if the wedge breaks, this is the first resistance zone to watch.
🎯 Take-Profit Zone (Red Box):
Near $0.48 – a conservative TP area just below the major resistance zone to ensure filled orders.
🧠 Strategy Suggestion:
Entry idea: Consider long position on breakout above the descending wedge resistance with volume confirmation.
Stop-loss: Below the support zone ($0.42 or slightly lower).
Target: $0.45 to $0.48 area depending on risk appetite.
⚠️ Note:
Watch for false breakouts or wicks through trendlines.
Always manage risk — this is not financial advice.