HOME price analysis"Right" low-caps seem to be performing much better than many of the old coins lately.
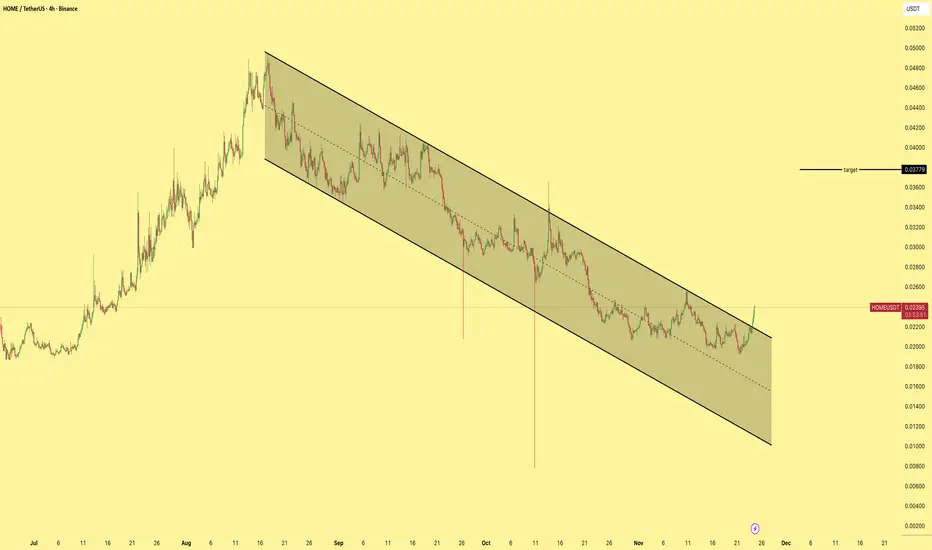
🤗 Today we're watching #HOME, which is testing a long-term trendline that has been rejecting the price for months.
📈 With a market cap of just ~$40–45M, a return toward the $100M valuation where OKX:HOMEUSDT.P has traded several times before would require roughly +150% from current levels.
For a low-cap, that's not necessarily an unrealistic move—especially if buyers finally break and hold above the long-term trendline.
The question is whether they can actually do it.
👍 Realistic or just another low-cap dream? 👎
______________
◆ Follow us ❤️ for daily crypto insights & updates!
🚀 Don’t miss out on important market moves
🧠 DYOR | This is not financial advice, just thinking out loud
In-depth trading ideas
HOMEUSDT Forming Bullish MomentumHOMEUSDT is forming a clear bullish momentum pattern, a classic bullish reversal signal that often indicates an upcoming breakout. The price has been consolidating within a narrowing range, suggesting that selling pressure is weakening while buyers are beginning to regain control. With consistent volume confirming accumulation at lower levels, the setup hints at a potential bullish breakout soon. The projected move could lead to an impressive gain of around 60% to 70% once the price breaks above the wedge resistance.
This bullish momentum pattern is typically seen at the end of downtrends or corrective phases, and it represents a potential shift in market sentiment from bearish to bullish. Traders closely watching HOMEUSDT are noting the strengthening momentum as it nears a breakout zone. The good trading volume adds confidence to this pattern, showing that market participants are positioning early in anticipation of a reversal.
Investors’ growing interest in HOMEUSDT reflects rising confidence in the project’s long-term fundamentals and current technical strength. If the breakout confirms with sustained volume, this could mark the start of a fresh bullish leg. Traders might find this a valuable setup for medium-term gains, especially as the wedge pattern completes and buying momentum accelerates.
✅ Show your support by hitting the like button and
✅ Leaving a comment below! (What is You opinion about this Coin)
Your feedback and engagement keep me inspired to share more insightful market analysis with you!
Home sweet home1 Peter 2:5 — "Ye also, as lively stones, are built up a spiritual house, an holy priesthood, to offer up spiritual sacrifices, acceptable to God by Jesus Christ."
HOME — the dwelling place. The refuge. The shelter from the storm.
Those who built upon this stone early shall find their house standing firm.
0.0088 is not merely a price. It is the completion of the house. The cornerstone placed. The walls finished.
Ye are lively stones, built up into a house. And the house shall stand.
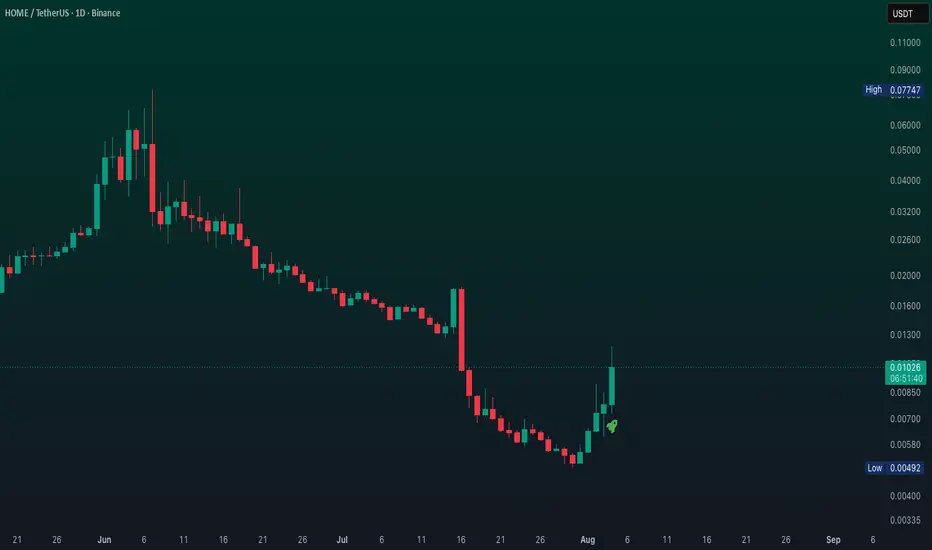
Upbit Lists HOME TokenOn August 4, 2026, Upbit—South Korea's largest crypto exchange—announced the listing of the Defi App ( BME:HOME ) token in both KRW and USDT markets. Trading began at 17:00 KST, with deposits and withdrawals exclusively via the Base network. This listing provides HOME with direct access to a deep pool of retail liquidity and significantly enhances its market profile. This is bullish for HOME because a top-tier exchange listing dramatically improves token accessibility and credibility, often attracting new capital. The immediate 24-hour price gain of over 40% reflects strong initial demand from Korean traders. Following the Upbit announcement, HOME's price surged roughly 28% in 24 hours, marking a 78% recovery from its all-time low set just days prior. The sharp rally is a direct reaction to the exchange news, but sustainability is uncertain. The token remains 87.62% below its June 2026 peak, and extreme whale concentration (top 0.10% hold 95.68% of supply) poses a persistent risk to price stability. HOME's recent momentum is primarily driven by its successful listing on Upbit, a key milestone for liquidity and adoption. Will sustained trading volume on the new market outweigh the risks posed by the token's highly concentrated ownership?
#HOME Key Resistance Zone📊#HOME Key Resistance Zone🚀
🧠From a structural perspective, we are still in a downtrend. Although there has been a decent rebound, it's approaching the blue resistance zone. Chasing the price upwards here is not recommended. If you want to participate in long positions, wait patiently for a healthy pullback before considering it. The strongest resistance zone is near the S/R level above!
➡️From a chart perspective, a descending wedge has formed here. If the price retraces to the upper edge of the wedge, there might be some suitable bullish opportunities!
⚠️Altcoins are highly volatile, so please prioritize risk management when trading!
🤜Follow me, and I'll guide you through market changes. Remember to like💖 and share💬
BYBIT:HOMEUSDT.P
HOME: Vertical Surge Over 35% Challenges Heavy ResistanceHOME: Vertical Surge Over 35% Challenges Heavy Resistance – Fakebreak Alert and Deep Correction Risk
HOME has just logged an aggressive price surge exceeding 35%, slicing through the dynamic MA100 trendline resistance to enter the heavy $0.0076–$0.0083 resistance cluster. However, this immediate upward push carries substantial technical risk when evaluated against historical price action. Rather than reflecting sustainable long-term buying demand, this rally appears heavily driven by short-term momentum.
Based on the visual data from the 4-hour chart , market history records two identical structural movements in late June and mid-July. On both prior occasions, the price action staged fakebreak pushes above the dynamic MA100 line before swiftly reversing into severe drawdowns of 67% and 73%, respectively. Overhead profit-taking supply consistently intensifies whenever prices challenge this specific resistance ceiling.
Should history repeat itself for a third time, a sharp price rejection at the $0.0076–$0.0083 resistance zone will likely trigger another steep drop, driving prices down toward the deep $0.0024 support floor (a decline of roughly 70%). Consequently, the optimal strategy is to strictly avoid chasing FOMO buy orders, remaining patient on the sidelines or scouting Short execution setups upon confirmed bearish reversal signals.
Disclaimer: This is not financial advice, DYOR.
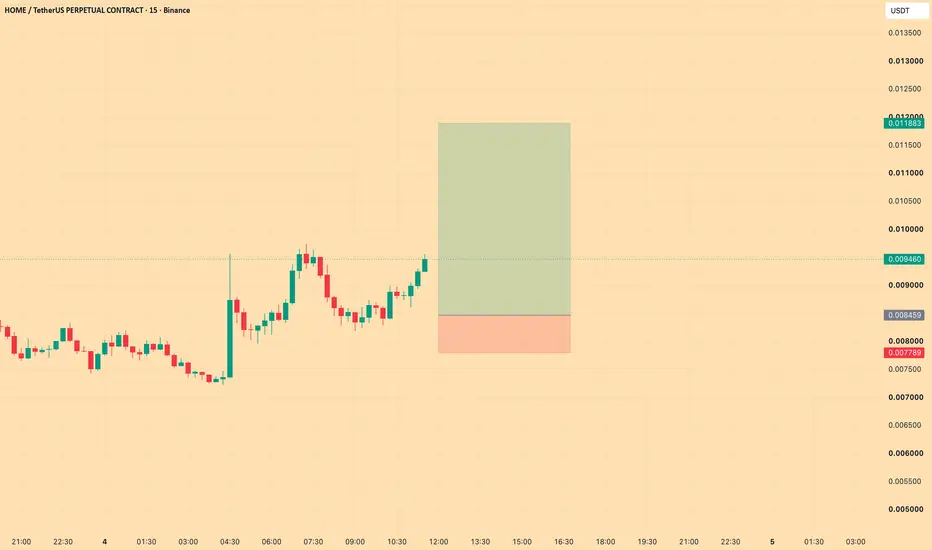
HOMEUSDT: Bullish Continuation Setup as Support HoldsHOMEUSDT is consolidating after a volatile move and continues to hold above a key support level. As long as 0.006663 remains intact, the bullish structure favors another push higher.
A breakout above the recent consolidation could drive the price toward 0.007091, with momentum likely increasing if buyers step in with higher volume.
Trade Setup
Entry: 0.006767
Target: 0.007091
Stop Loss: 0.006663
HOMEUSDT Forming Falling WedgeHOMEUSDT is forming a clear falling wedge pattern, a classic bullish wave signal that often indicates an upcoming breakout. The price has been consolidating within a narrowing range, suggesting that selling pressure is weakening while buyers are beginning to regain control. With consistent volume confirming accumulation at lower levels, the setup hints at a potential bullish breakout soon. The projected move could lead to an impressive gain of around 190% to 200% once the price breaks above the wedge resistance.
This falling wedge pattern is typically seen at the end of downtrends or corrective phases, and it represents a potential shift in market sentiment from bearish to bullish. Traders closely watching HOMEUSDT are noting the strengthening momentum as it nears a key breakout zone. The healthy trading volume adds confidence to this setup, showing that market participants may be positioning early in anticipation of a strong reversal.
Investors’ growing interest in HOMEUSDT reflects increasing confidence in the project's long-term fundamentals and improving technical structure. The continued price compression within the wedge suggests that bearish momentum is fading, while accumulation by buyers appears to be increasing. As the pattern approaches completion, the probability of a breakout continues to rise.
If the breakout confirms with sustained buying volume, this could mark the beginning of a powerful new bullish leg. Traders may find this an attractive opportunity for medium-term gains, especially as the falling wedge pattern nears resolution and momentum begins to accelerate. A successful breakout could trigger significant upside potential and attract further market attention in the coming weeks.
✅ Show your support by hitting the like button!
✅ Leave a comment below! (What is your opinion about this coin?)
Your feedback and engagement keep me inspired to share more insightful market analysis with you! 📈🚀
Defi App (HOME) Hyper-Bullish & HigherDefi-app (HOMEUSDT) looks really, really good right now after a major, final flush. The market always produces strong variations and here is a trading pair that hit bottom recently, this month.
While HOMEUSDT crashed recently through a falling wedge, notice that this doesn't support a new bear market; rather, it supports a major recovery and change of trend.
HOME is the most bullish now it has been in God knows when. Really big candles coupled with high volume, especially the active session. The December 2025 low has been recovered as support. The May 2026 low is still a higher low compared to October 2025. Needless to say, the focus on bearish action is a thing of the past.
Defi-app is now bullish and already forging ahead. We can expect additional growth and this chart supports a bullish resumption on the other altcoins. What one does, the rest follows.
Namaste.
HOMEUSDT Forming Falling WedgeHOMEUSDT is forming a clear falling wedge pattern, a classic bullish wave signal that often indicates an upcoming breakout. The price has been consolidating within a narrowing range, suggesting that selling pressure is weakening while buyers are beginning to regain control. With consistent volume confirming accumulation at lower levels, the setup hints at a potential bullish breakout soon. The projected move could lead to an impressive gain of around 90% to 100% once the price breaks above the wedge resistance.
This falling wedge pattern is typically seen at the end of downtrends or corrective phases, and it represents a potential shift in market sentiment from bearish to bullish. Traders closely watching HOMEUSDT are noting the strengthening momentum as it nears a breakout zone. The good trading volume adds confidence to this pattern, showing that market participants are positioning early in anticipation of a reversal.
Investors’ growing interest in HOMEUSDT reflects rising confidence in the project’s long-term fundamentals and current technical strength. If the breakout confirms with sustained volume, this could mark the start of a fresh bullish leg. Traders might find this a valuable setup for medium-term gains, especially as the wedge pattern completes and buying momentum accelerates.
✅ Show your support by hitting the like button and
✅ Leaving a comment below! (What is your opinion about this coin?)
Your feedback and engagement keep me inspired to share more insightful market analysis with you!
HOME/USDT | More Pump Ahead ? (READ THE CAPTION)By analyzing the #HOME chart on the daily timeframe, we can see that after the heavy sell-off toward the $0.013 region, strong buying pressure finally stepped in and price exploded more than 80%, rallying all the way back toward the $0.024 area.
Currently, HOME is trading around this key level and as long as price manages to hold above the $0.021 support zone, the broader bullish structure remains valid and the probability of further upside continuation stays high.
From a structural perspective, the nearest demand zones are located around $0.021 – $0.022, with deeper support sitting near $0.018 – $0.019. On the upside, the nearest supply zones are forming around $0.0245 – $0.026, followed by the stronger resistance cluster between $0.028 – $0.030.
If bullish momentum continues building from this region, the next upside targets to monitor are $0.026, followed by $0.028, then $0.030, and potentially $0.035 if buyers maintain control. The overall structure still looks very constructive and HOME could become one of the strongest surprise movers in the next phase of the crypto market.
Please support me with your likes and comments to motivate me to share more analysis with you and share your opinion about the possible trend of this chart with me !
Best Regards , Arman Shaban
HOMEUSDT Forming Falling WedgeHOMEUSDT is forming a clear falling wedge pattern, a classic bullish wave signal that often indicates an upcoming breakout. The price has been consolidating within a narrowing range, suggesting that selling pressure is weakening while buyers are beginning to regain control. With consistent volume confirming accumulation at lower levels, the setup hints at a potential bullish breakout soon. The projected move could lead to an impressive gain of around 90% to 100% once the price breaks above the wedge resistance.
This falling wedge pattern is typically seen at the end of downtrends or corrective phases, and it represents a potential shift in market sentiment from bearish to bullish. Traders closely watching HOMEUSDT are noting the strengthening momentum as it nears a breakout zone. The strong trading volume adds confidence to this pattern, showing that market participants are positioning early in anticipation of a reversal.
Investors’ growing interest in HOMEUSDT reflects rising confidence in the project’s long-term fundamentals and current technical strength. If the breakout confirms with sustained volume, this could mark the start of a fresh bullish leg. Traders might find this a valuable setup for medium-term gains, especially as the wedge pattern completes and buying momentum accelerates.
✅ Show your support by hitting the like button and
✅ Leaving a comment below! (What is your opinion about this coin?)
Your feedback and engagement keep me inspired to share more insightful market analysis with you!
HOME/USDT | Defi App Holding Demand, Ready for Next Bullish Leg?By analyzing the BME:HOME chart on the daily timeframe, we can see that after the recent bullish move toward $0.02465, price faced a corrective phase and dropped back toward the $0.020 region. Currently, HOME is trading around this key demand level, and the previous analysis remains fully valid. The reaction from this zone suggests that buyers are still active and attempting to defend this area.
As long as price manages to hold and stabilize above the $0.020 support level, the bullish continuation scenario remains intact and the probability of another upward move increases. In that case, the next upside targets to monitor are $0.022, followed by $0.024, then $0.026, and potentially $0.028 if bullish momentum continues to build.
Please support me with your likes and comments to motivate me to share more analysis with you and share your opinion about the possible trend of this chart with me !
Best Regards , Arman Shaban
HOME/USDT | HOME Rebounds +22% From $0.02 – Recovery Starting?By analyzing the BME:HOME chart on the daily timeframe, we can see that after the broader crypto market correction, HOME also experienced a sharp decline and dropped toward the $0.020 region. However, once price reached this zone, strong buying pressure stepped in again and the market started to recover. Following this reaction, HOME surged more than 22% and pushed higher toward the $0.024 level, showing early signs of bullish recovery after the recent market pullback. At this stage, the $0.024 level acts as a very important short-term resistance. If price manages to hold and stabilize above this level, the probability of further upside expansion will increase. In that case, the next upside targets to monitor are $0.026, followed by $0.028, then $0.030, and potentially $0.032 if bullish momentum continues to build.
Please support me with your likes and comments to motivate me to share more analysis with you and share your opinion about the possible trend of this chart with me !
Best Regards , Arman Shaban
HOME/USDT | $HOME Holds Key Support, Next Bullish Targets Ahead?By analyzing the BME:HOME chart on the daily timeframe, we can see that price continued its bullish expansion and eventually reached the $0.032 level. From our previous analysis, the move delivered more than 50% return , confirming the strength of the bullish structure.
After this strong rally, price entered a corrective phase and is currently trading around the $0.028 region as the market stabilizes after the impulsive move. As long as price manages to hold and stabilize above the $0.0276 support level, the bullish structure remains valid and the probability of further upside expansion increases.
If buyers maintain control, the next upside targets to monitor are $0.030, followed by $0.032, then $0.035 , and potentially $0.038 in case of continued bullish momentum.
This chart will continue to be updated step by step as price reacts to key levels.
Please support me with your likes and comments to motivate me to share more analysis with you and share your opinion about the possible trend of this chart with me !
Best Regards , Arman Shaban
HOMEUSDT Forming Bullish MomentumHOMEUSDT is forming a clear bullish momentum pattern, a classic bullish reversal signal that often indicates an upcoming breakout. The price has been consolidating within a narrowing range, suggesting that selling pressure is weakening while buyers are beginning to regain control. With consistent volume confirming accumulation at lower levels, the setup hints at a potential bullish breakout soon. The projected move could lead to an impressive gain of around 60% to 70% once the price breaks above the wedge resistance.
This bullish momentum pattern is typically seen at the end of downtrends or corrective phases, and it represents a potential shift in market sentiment from bearish to bullish. Traders closely watching HOMEUSDT are noting the strengthening momentum as it nears a breakout zone. The good trading volume adds confidence to this pattern, showing that market participants are positioning early in anticipation of a reversal.
Investors’ growing interest in HOMEUSDT reflects rising confidence in the project’s long-term fundamentals and current technical strength. If the breakout confirms with sustained volume, this could mark the start of a fresh bullish leg. Traders might find this a valuable setup for medium-term gains, especially as the pattern completes and buying momentum accelerates.
✅ Show your support by hitting the like button and
✅ Leaving a comment below! (What is your opinion about this Coin?)
Your feedback and engagement keep me inspired to share more insightful market analysis with you!
HOMEUSDT 1D#HOME has broken above the bullish flag on the daily timeframe and is now facing the Ichimoku cloud. If price breaks above the cloud, the potential upside targets are:
🎯 $0.02989
🎯 $0.03321
🎯 $0.03652
🎯 $0.04124
🎯 $0.04726
⚠️ Always remember to use a tight stop-loss and maintain proper risk management.
HOME/USDT | $HOME Rebounds Strongly – Bulls Aiming for More GainBy analyzing the #HOME chart on the 1-hour timeframe, we can see that after a pullback to $0.02050, the price started to rise again and successfully hit all three targets — $0.02350, $0.02375, and $0.02410 — delivering over 18% profit.
Currently, #HOME is trading around $0.022, and as long as it holds above $0.0215, we can expect further bullish movement. Hope you made the most out of this setup!
Please support me with your likes and comments to motivate me to share more analysis with you and share your opinion about the possible trend of this chart with me !
Best Regards , Arman Shaban