A potential Bullish Butterfly on the HOTUSDT 2H chart
B: 0.789 retracement of XA ✅
C: 0.797 retracement of AB ✅
D: 1.62 extension of BC / 1.178 of XA → completing around 0.000251
The pattern is not complete yet — waiting for price to reach the D point (PRZ). 0.000197 remains a separate major support level to watch below.
No position should be considered until reversal confirmation (candle pattern, volume) appears at the PRZ.
Not financial advice.
#HOT #HOTUSDT #Butterfly #HarmonicPatterns #Binance
In-depth trading ideas
#HOTUSDT — Holding the Last Fortres, Recovery or Final Break#HOT
The price is moving within a descending channel on the 1-hour timeframe and has reached the lower boundary. It is now poised for a bounce and is expected to retest this boundary.
The Relative Strength Index (RSI) indicates a downward trend, which is likely to continue given the overbought conditions.
There is a key support zone in green at 0.000304. The price has bounced off this zone several times, making it a strong support level.
The price is trending towards the 100-period moving average, which we are approaching. This trend supports an upward move.
Entry Price: 0.000358
Target 1: 0.000371
Target 2: 0.000393
Target 3: 0.000421
Stop Loss: At the resistance zone in green
Remember this simple rule: Money management.
Any questions? Please leave a comment.
Thank you.
#HOTUSDT#HOT
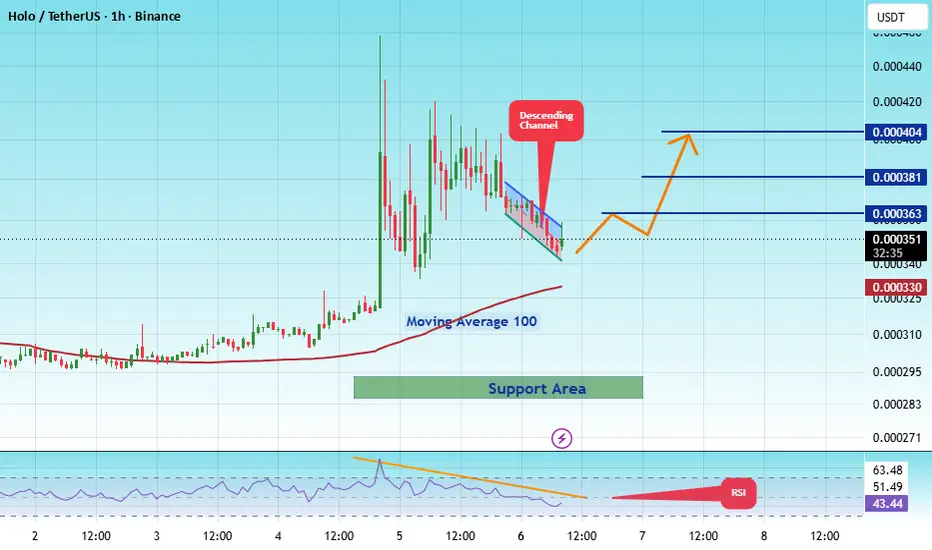
The price is moving within a descending channel on the 1-hour timeframe and has reached the lower boundary. It is now poised for a bounce and is expected to retest this boundary.
The Relative Strength Index (RSI) indicates a downward trend, which is likely to continue given the overbought conditions.
There is a key support zone in green at 0.000287. The price has bounced off this zone several times, making it a strong support level.
The price is trending towards the 100-period moving average, which we are approaching. This trend supports an upward move.
Entry Price: 0.000404
Target 1: 0.000363
Target 2: 0.000381
Target 3: 0.000404
Stop Loss: At the resistance zone in green
Remember this simple rule: Money management.
Any questions? Please leave a comment.
Thank you.
#HOTUSDT — Holding the Last Fortres, Recovery or Final Break#HOT
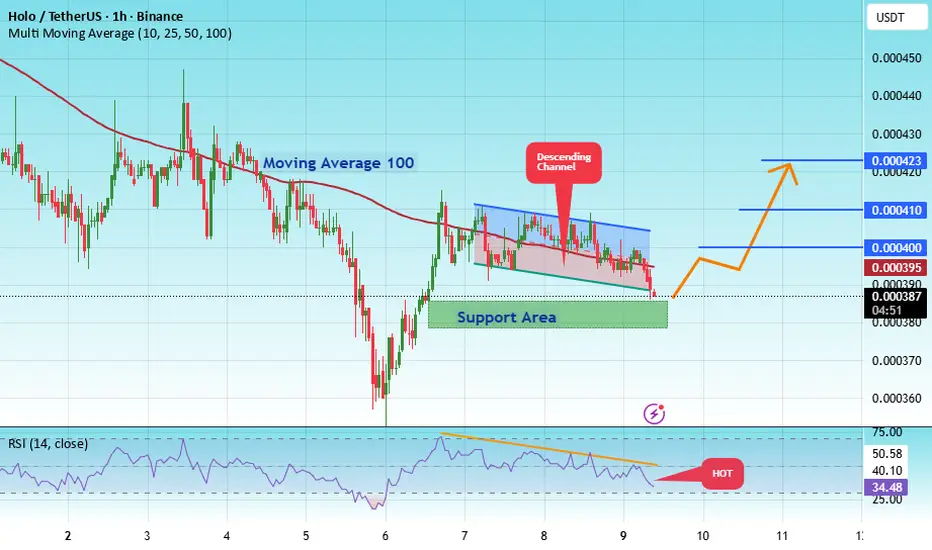
The price is moving within a descending channel on the 1-hour timeframe and has reached the lower boundary. It is now poised for a bounce and is expected to retest this boundary.
The Relative Strength Index (RSI) indicates a downward trend, which is likely to continue given the overbought conditions.
There is a key support zone (in green) at 0.000375. The price has bounced off this zone several times, making it a strong support level.
The price is trending towards the 100-period moving average, which we are approaching. This trend supports an upward move.
Entry Price: 0.000390
First Target: 0.000399
Second Target: 0.000411
Third Target: 0.000424
You can stop at the first and second targets and close the price, or continue towards the third target. Stop Loss: At the resistance zone (in green).
Remember this simple rule: Money Management.
Any questions? Please leave a comment.
Thank you.
#HOTUSDT — Holding the Last Fortres, Recovery or Final Break#HOT
The price is moving within a descending channel on the 1-hour timeframe and has reached the lower boundary. It is now poised for a bounce and is expected to retest this boundary.
The Relative Strength Index (RSI) indicates a downward trend, which is likely to continue given the overbought conditions.
There is a key support zone in green at 0.000262. The price has bounced off this zone several times, making it a strong support level.
The price is trending towards the 100-period moving average, which we are approaching. This trend supports an upward move.
Entry Price: 0.000295
Target 1: 0.000307
Target 2: 0.000321
Target 3: 0.000338
Stop Loss: At the resistance zone in green
Remember this simple rule: Money management.
Any questions? Please leave a comment.
Thank you.
#HOTUSDT — Holding the Last Fortres, Recovery or Final Break#HOT
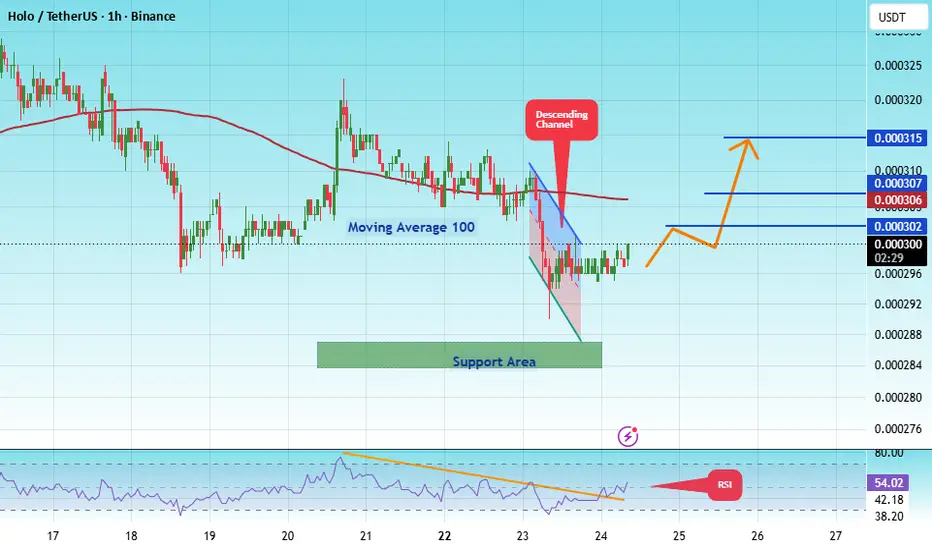
The price is moving within a descending channel on the 1-hour timeframe and has reached the lower boundary. It is now poised for a bounce and is expected to retest this boundary.
The Relative Strength Index (RSI) indicates a downward trend, which is likely to continue given the overbought conditions.
There is a key support zone in green at 0.000284. The price has bounced off this zone several times, making it a strong support level.
The price is trending towards the 100-period moving average, which we are approaching. This trend supports an upward move.
Entry Price: 0.000300
Target 1: 0.000302
Target 2: 0.000307
Target 3: 0.000315
Stop Loss: At the resistance zone in green
Remember this simple rule: Money management.
Any questions? Please leave a comment.
Thank you.
#HOTUSDT — Holding the Last Fortres, Recovery or Final Break#HOT
The price is moving within a descending channel on the 1-hour timeframe and has reached the lower boundary. It is now poised for a bounce and is expected to retest this boundary.
The Relative Strength Index (RSI) indicates a downward trend, which is likely to continue given the overbought conditions.
A key support zone has been identified in green at 0.000292. The price has bounced off this zone several times, making it a strong support level.
The price is trending towards the 100-period moving average, which we are approaching. This trend supports an upward move.
Entry Price: 0.000307
Target 1: 0.000313
Target 2: 0.000318
Target 3: 0.000328
You can close at the second target or wait for the third target. The choice is yours.
Stop Loss: At the resistance zone in green.
Remember this simple rule: Money Management.
Any questions? Please leave a comment.
Thank you.
#HOTUSDT — Holding the Last Fortres, Recovery or Final Break#HOT
The price is moving within a descending channel on the 1-hour timeframe and has reached the lower boundary. It is now poised for a bounce and is expected to retest this boundary.
The Relative Strength Index (RSI) indicates a downward trend, which is likely to continue given the overbought conditions.
There is a key support zone (in green) at 0.000290. The price has bounced off this zone several times, making it a strong support level.
The price is trending towards the 100-period moving average, which we are approaching. This trend supports an upward move.
Entry Price: 0.000310
Target 1: 0.0000318
Target 2: 0.000323
Target 3: 0.000331
Stop Loss: At the resistance zone (in green)
Remember this simple rule: Money management.
Any questions? Please leave a comment.
Thank you.
#HOTUSDT — Holding the Last Fortres, Recovery or Final Break#HOT
The price is moving within a descending channel on the 1-hour timeframe and has reached the lower boundary. It is now poised for a bounce and is expected to retest this boundary.
The Relative Strength Index (RSI) indicates a downward trend, which is likely to continue given the overbought conditions.
There is a key support zone (in green) at 0.000423. The price has bounced off this zone several times, making it a strong support level.
The price is trending towards the 100-period moving average, which we are approaching. This trend supports an upward move.
Entry Price: 0.000445
First Target: 0.000454
Second Target: 0.000460
Third Target: 0.000468
You can stop at the first and second targets and close the price, or continue towards the third target. Stop Loss: At the resistance zone (in green).
Remember this simple rule: Money Management.
Any questions? Please leave a comment.
Thank you.
#HOTUSDT — Holding the Last Fortres, Recovery or Final Break#HOT
The price is moving within a descending channel on the 1-hour timeframe and has reached the lower boundary. It is now poised for a bounce and is expected to retest this boundary.
The Relative Strength Index (RSI) indicates a downward trend, which is likely to continue given the overbought conditions.
There is a key support zone (in green) at 0.000408. The price has bounced off this zone several times, making it a strong support level.
The price is trending towards the 100-period moving average, which we are approaching. This trend supports an upward move.
Entry Price: 0.000426
First Target: 0.000429
Second Target: 0.000437
Third Target: 0.000445
You can stop at the first and second targets and close the price, or continue towards the third target. Stop Loss: At the resistance zone (in green).
Remember this simple rule: Money Management.
Any questions? Please leave a comment.
Thank you.
HOT/USDT - Descending Trendline: Breakout Potential?On the HOT/USDT chart, it is clearly visible that price is still within a downtrend structure, marked by a descending trendline (yellow line) 📉. Since the previous major drop, price has consistently formed lower highs and lower lows, reinforcing bearish dominance in the medium term.
However, price is now starting to show signs of consolidation at the lower range 🔄 and is gradually approaching the key resistance at the trendline. This is a crucial zone that often determines whether the market will continue its downtrend or begin a reversal phase ⚖️
Additionally, there are several horizontal resistance levels that could act as potential targets if a breakout occurs:
🎯 0.000465 (nearest resistance)
🎯 0.000487
🎯 0.000525
🎯 0.000570
🎯 0.000740 (major target)
Strong support is located around:
🛡️ 0.000400 – 0.000365
🛡️ 0.000339 (lowest support)
---
📐 Pattern Formation:
This chart forms a Descending Trendline (Downtrend Resistance) pattern, which is often part of:
📉 Descending Channel (if parallel support exists)
🔄 or an Accumulation Phase before breakout
Key characteristics of this pattern:
Price is pressured by a downward resistance line ⬇️
The more times it is tested, the higher the breakout probability 💥
A valid breakout is usually followed by increased volume 📊
---
🐂 Bullish Scenario:
If price manages to:
✅ Break out and close above the descending trendline
✅ Break through the 0.000465 – 0.000487 area
Then the upside potential opens toward:
🚀 0.000525
🚀 0.000570
🚀 Up to 0.000740 as the main target
This breakout would signal that: ➡️ The downtrend structure is weakening
➡️ A potential reversal or at least a relief rally is underway
---
🐻 Bearish Scenario:
If price fails to break the trendline and gets rejected ❌:
Price is likely to move back down toward support 📉
A breakdown below 0.000400 would strengthen selling pressure
Downside targets:
🎯 0.000365
🎯 0.000339 (previous low)
This indicates that: ➡️ The downtrend remains dominant
➡️ Buyers still lack sufficient strength for a reversal
---
🧠 Conclusion:
HOT/USDT is currently at a critical point between breakout or rejection ⚠️
The trendline area is the key level 🔑 Traders should watch for candle confirmation and volume before making decisions.
#HOTUSDT #CryptoAnalysis #TechnicalAnalysis #Altcoin #BreakoutSetup #Downtrend #ReversalSignal #CryptoTrading #SupportResistance
HOTUSDT 1D#HOT is trading within a triangle pattern on the daily chart. It may continue consolidating inside the triangle for a few more days until it reaches the daily SMA200. In case of a breakout above the triangle resistance and the SMA200, the upside targets are:
🎯 $0.000503
🎯 $0.000547
🎯 $0.000591
🎯 $0.000655
🎯 $0.000735
⚠️ Always remember to use tight stop-losses and maintain proper risk management.
Holo Token (HOT): New All-Time High & Market CycleHolo Token—HOTUSDT is ready for a nice bullish jump, one that will evolve into a new bullish market cycle...
Good evening my fellow Cryptocurrency trader, how are you feeling in this wonderful day?
This HOTUSDT chart starts with a double-bottom, by now a classic signal, between February 2026 and October 2025. Notice how some pairs produce higher lows, others lower lows and still others a double-bottom. These are the usual variations.
The bearish cycle removed most of the gains from the previous bull market. Almost everything but the final crash from March 2020. This is the same dynamic that we can expect in the future.
Say a huge bear market develops after a long-term bull market starts now. This bear market would send prices lower but never below October 2025/February 2026.
Let's focus on the positive side now.
The previous bull market, March 2020 through April 2021, produced 16,000% total growth. Amazing numbers, natural and normal for the Cryptocurrency market. The bull market lasted more than a year.
We are now entering a new market cycle, a bullish one. The next bull market can last longer, say 2-3 years, or 3-5 years. But not as short as before.
The bearish cycle lasted more than 1,700 days. The market seeking balance, we can expect long-term growth to happen next.
A long-term higher low, 2026 vs 2020, can lead to a long-term higher high; a new all-time high in the years ahead.
Thank you for reading.
Namaste.
#HOTUSDT — Holding the Last Fortres, Recovery or Final Break#HOT
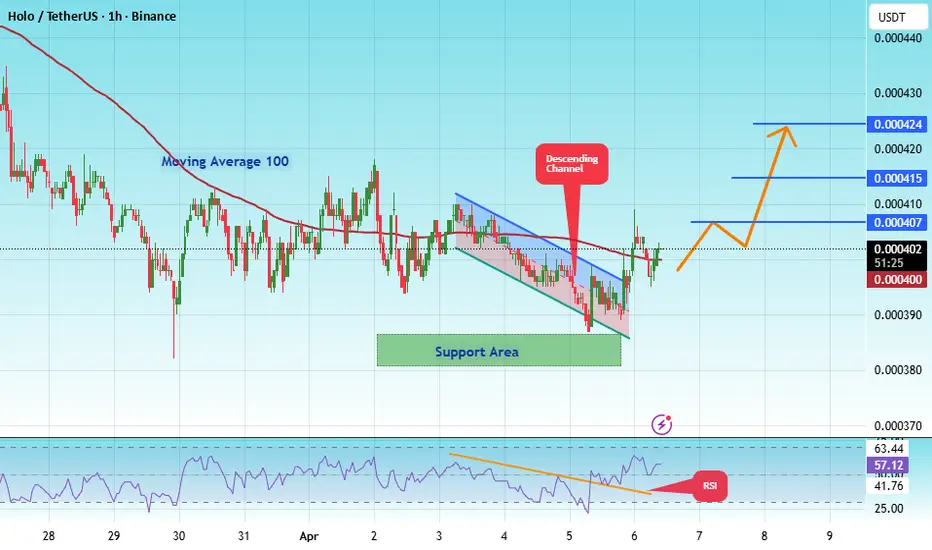
The price is moving within a descending channel on the 4-hour timeframe. It has reached the lower boundary and is heading for a bounce. A retest of this boundary is expected.
The Relative Strength Index (RSI) indicates a downward trend, and this trend is likely to continue due to the overbought condition.
There is a key support zone in green at 0.000380. The price has bounced off this zone several times, making it a strong support level.
The price is trending towards the 100-period moving average, which we are approaching. This trend supports an upward move.
Entry Price: 0.000400
Target 1: 0.000407
Target 2: 0.000415
Target 3: 0.000424
Stop Loss: At the resistance zone in green
Remember this simple rule: Money Management.
Any questions, please leave a comment.
Thank you.
HOT/USDTMarkets don’t become clean just because price starts moving up.
Very often, the strongest moves begin in unstable conditions.
Right now HOT/USDT is trading near 0.00047, approaching resistance around 0.00049 after a steady push higher.
The broader structure leans bullish, but the environment is far from clean.
Here is what the current structure suggests:
• Buyer presence remains strong (order book imbalance positive)
• Price is holding above short-term support
• Volatility is elevated
But at the same time:
• Volume is below average
• Trade flow shows active selling pressure
• Liquidity remains thin
That combination often leads to sharp, unstable movements rather than clean continuation.
Two scenarios from here
Bullish scenario
If price manages to hold above the recent support and push into resistance, continuation may extend toward:
• 0.00049 area
• 0.00052 area
This would confirm that buyers are absorbing the selling pressure.
Pullback scenario
If selling pressure continues to dominate near resistance, the market may rotate back toward support.
The key area to watch then becomes:
• 0.00045 – 0.00044 zone
This is where structure needs to hold to keep the bullish context intact.
Practical approach
In conditions like this, the main risk is not direction — it’s instability.
High volatility + low liquidity + mixed order flow
→ often creates false continuation and sharp reversals
A more structured approach is to observe behavior at key levels:
• Acceptance above resistance → continuation becomes more likely
• Rejection + persistent selling pressure → rotation back into range
Support to watch: 0.00044
Resistance to watch: 0.00049
In environments like this, the goal is not prediction.
It’s managing risk around structure.
🧩 No trade is also a decision.
#HOT/USDT — Holding the Last Fortres, Recovery or Final Break
#HOT
The price is moving within a descending channel on the hourly timeframe. It has reached the lower boundary and is trending towards a bounce. A retest of this boundary is expected.
The Relative Strength Index (RSI) indicates a downward trend, and this trend is likely to continue due to the overbought condition.
There is a key support zone in green at 0.000367. The price has bounced off this zone several times, making it a strong support level.
The price is trending towards the 100-period moving average, which we are approaching. This trend supports an upward move.
Entry Price: 0.000380
Target 1: 0.000389
Target 2: 0.000400
Target 3: 0.00413
Stop Loss: At the resistance zone in green
Remember this simple rule: Money management.
Any questions, please leave a comment.
Thank you.
HOT – Descending Channel Resistance TestHOT has been trading inside a well defined descending channel for several months, consistently forming lower highs and lower lows while respecting the channel boundaries. The overall structure remains bearish as long as price continues to stay within this channel.
Recently, price bounced from the lower portion of the structure and is now pushing toward the upper boundary of the channel, which is acting as dynamic resistance near the 0.00048–0.00050 region. This area is a key decision zone where the market will likely determine its next directional move.
If buyers manage to break and hold above the channel resistance, the structure would shift from a corrective bounce into a potential trend reversal. In that scenario, momentum could expand toward 0.00055 first, followed by a larger move toward the macro descending resistance near 0.00120.
However, if price gets rejected at the channel resistance, the broader downtrend structure remains intact. A rejection from this area could push the market back toward 0.00033, and potentially even deeper toward 0.00017 near the lower macro support.
At this stage, price is approaching a major structural resistance.
The reaction at the channel upper boundary will likely decide whether this becomes a breakout or another continuation of the downtrend.
Holo Token: New market cycle and new all-time highThe next project I am looking at is Holo Token—HOTUSDT, this one also looks great and so ready...
There is a big difference compared to Hedera which I published recently. Here we are definitely seeing the start of a new market cycle.
There is a double-bottom, by now a classic signal, between February 2026 and October 2025. Notice how some pairs produce higher lows, other lower lows and others a double-bottom. These are the usual variations.
The bearish cycle removed most of the gains from the previous bull market. Almost everything but the final crash from March 2020. This is the same dynamic that we can expect in the future.
Say a huge bear market develops after a long-term bull market starts now. This bear market would send prices lower but never below October 2025/February 2026. Let's focus on the positive side now.
The previous bull market, March 2020 through April 2021, produced 16,000% total growth. Amazing numbers, natural and normal for the Cryptocurrency market. The bull market lasted more than a year.
We are now entering a new market cycle, a bullish one. The next bull market can last longer, say 2-3 years, or 3-5 years. But not as short as before.
The bearish cycle lasted more than 1,700 days. The market seeking balance, we can expect long-term growth.
A long-term higher low, 2026 vs 2020, can lead to a long-term higher high; a new all-time high in the years ahead.
Thank you for reading.
Namaste.
#HOT/USDT Ready to go up#HOT
The price is moving within a descending channel on the hourly timeframe. It has reached the lower boundary and is heading towards a breakout, with a retest of the upper boundary expected.
The Relative Strength Index (RSI) is showing a downward trend, approaching the lower boundary, and an upward bounce is anticipated.
There is a key support zone in green at 0.000380. The price has bounced from this level several times and is expected to bounce again.
The RSI is showing a trend towards consolidation above the 100-period moving average, which we are approaching, supporting the upward move.
Entry Price: 0.0003387
Target 1: 0.000400
Target 2: 0.000410
Target 3: 0.000423
Stop Loss: Below the green support zone.
Remember this simple thing: Money management.
For any questions, please leave a comment.
Thank you.
HOT Near Lower Channel Support, Liquidity Zone in FocusHOT continues to trade inside a clear descending channel on the higher time frame and is currently positioned near the lower boundary of the structure.
Price action suggests the market may revisit the previous wick around 0.000314, which sits inside a known liquidity zone. A move into this area could act as a liquidity sweep toward the lower boundary of the larger channel, before any meaningful reaction develops.
As long as HOT remains below channel resistance, the structure stays bearish. A deeper sweep into lower support would still be technically valid within the trend. Only a strong reclaim back above the channel mid-range would start to shift short-term momentum.
This is a high-sensitivity zone where volatility is expected.
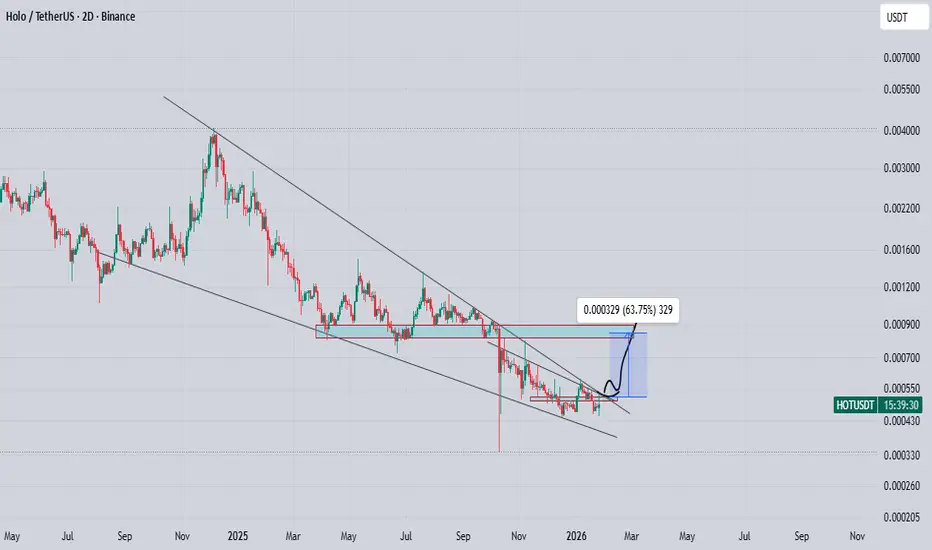
hot coin looking good after long bearish wavePrice is continuing to squeeze and compress, indicating building pressure. A strong upside breakout is possible from this zone.
A good volume candle closing above the descending trendline can trigger a solid move in the coming days. If the breakout holds successfully with a daily or 2-day candle close, we could see a 60–70% bullish rally toward the marked resistance area on the chart.
#HOT/USDT Ready to go up#HOT
The price is moving within a descending channel on the hourly timeframe. It has reached the lower boundary and is heading towards a breakout, with a retest of the upper boundary expected.
The Relative Strength Index (RSI) is showing a downward trend, approaching the lower boundary, and an upward bounce is anticipated.
There is a key support zone in green at 0.000511. The price has bounced from this level several times and is expected to bounce again.
The indicator is showing a trend towards consolidation above the 100-period moving average, which we are approaching, supporting the upward move.
Entry Price: 0.000527
Target 1: 0.000532
Target 2: 0.000540
Target 3: 0.000553
Stop Loss: Below the green support zone.
Remember this simple thing: Money management.
For any questions, please leave a comment.
Thank you.