Huma preparing for 2x rally HUMA has already confirmed a breakout above both the descending trendline and the key horizontal resistance zone. On the lower timeframe, it has also formed and broken out of a bullish pennant, adding further confirmation to the bullish momentum. The price has reclaimed this zone after multiple tests, showing strong buyer control. If HUMA continues to hold above this breakout area, we could see a strong continuation move of around 60–70% toward the next major resistance level in the coming days.
HUMA / TetherUS
No trades
No trades
In-depth trading ideas
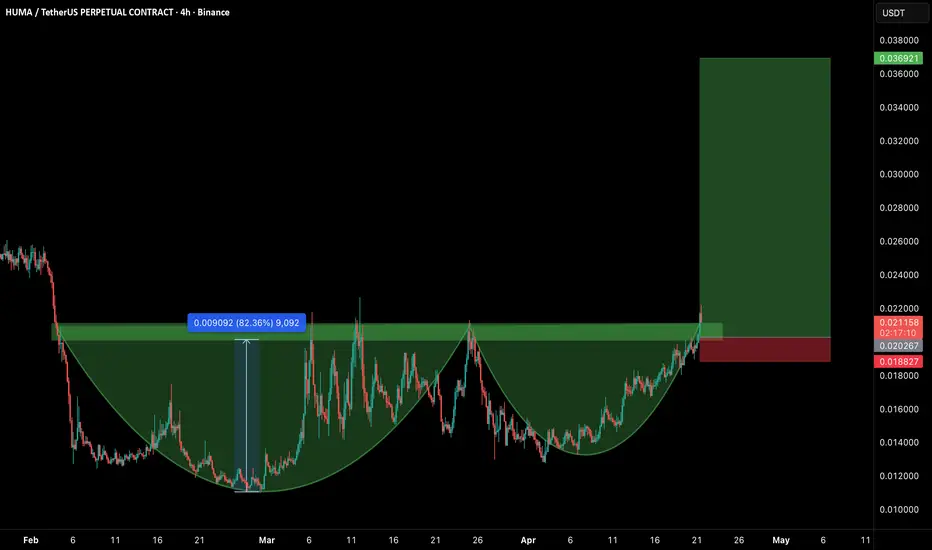
HUMA/USDT Long Setup!Hey Traders!
If you’re finding value in this analysis, smash that 👍 and hit Follow for high-accuracy trade setups that actually deliver!
Clean cup-shaped accumulation + breakout with momentum building 📈
📊 Entry Zone:
$0.020 – $0.021
🛑 Stop Loss:
Below $0.018
🎯 Targets:
• $0.026
• $0.032
• $0.036+
🔥 Why this setup?
• Strong accumulation structure (rounding bottom) ✅
• Resistance breakout + continuation 📈
• Increasing bullish momentum 💪
⚠️ As long as price holds above the entry zone, uptrend remains intact.
What’s your view on this?
Share your thoughts in the comments below 👇
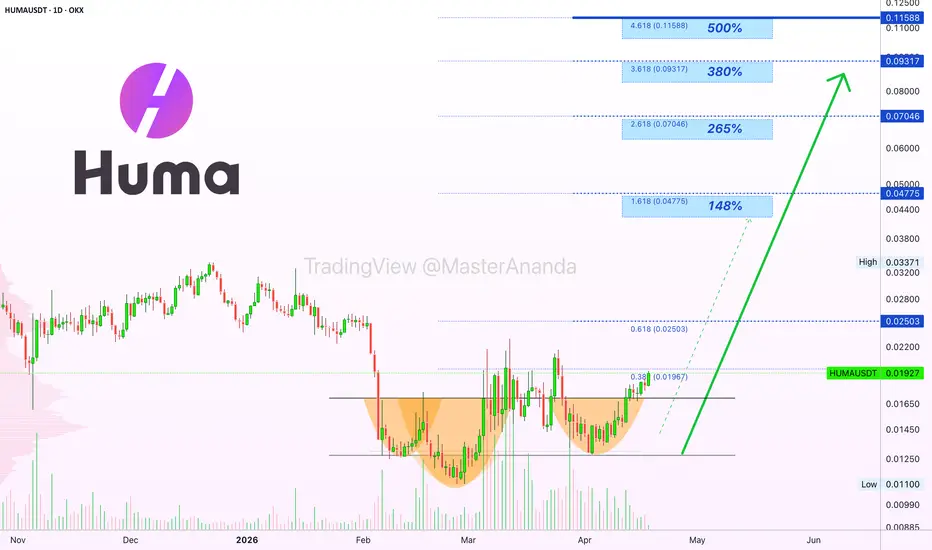
Huma Finance —Cryptocurrency, the future of moneyFull green candle today, about to close full green. Why are these moving?
These aren't the first projects growing strongly in 2026, many projects from the asian exchanges started moving months ago. When the action reaches the major exchanges and bigger projects, it means we are very close, to marketwide bullish action that is.
Huma Finance —HUMAUSDT
"A PayFi network accelerating cross-border and card payments with instant access to liquidity."
The chart is very good for a 265% rise, also for a nice 500%.
I've been looking at and tracking these pairs for months and they always caught my attention. I wouldn't share them because there wasn't enough activity nor momentum. Now that they are set to move very strongly, activity is no priority. Things change.
Today we are shy and young; tomorrow we are running, drinking and dancing under the rain.
Today the market can be quiet; it can turn wild in matter of days.
Positive, positive, positive up. The market grows after an all-time low. The market starts to grow after a bear market. The market grows from support.
Imagine seeing the start of a bear market at bottom prices, it doesn't happen. The start of the crash in 2025 happened from high prices and new all-time highs.
Market conditions are different now. See HUMAUSDT.
After the bottom was hit, a higher low, volume goes up with a flat bottom and today we get the full green candle.
My thinking is this: Get in and get out with 200-500%. A portion of the profits goes into the projects with long-term growth potential, those that we know can grow easily between 10-20X. Another portion goes into more and new trades.
It is active trading when the market starts to move, when it heats up. The passive trading—simply buying—can be done only through the accumulation phase, the past few months.
We are about to become active—are you with me?
I will be here sharing charts daily for your guidance and entertainment, to keep you company while you trade.
If you enjoy the content, you can share it with others or you can follow. All is good as long as we get to grow and exchange. It is a long-term process. You will be seeing me your entire life in this form or another. I hope we can grow together as the Cryptocurrency market continues to evolve.
All the statistics I am seeing are saying that the stablecoins are taking over the conventional forms of payments. It is already happening now, we are living in a new world.
It is the first time ever, in the history of money, that money becomes free—accessible to all. It is the first time in the history of humanity that the monopoly on money has been broken.
Expect the unexpected but be in the market. If you can't be in the market, plan to enter as soon as you can and consider staying in long-term. Not thinking about exchanging this for that, but just holding, having and being part of the money of the future. The money for this present age.
We are a technological civilization, Cryptocurrencies are perfect for the age of information—Aquarius—the age of the internet.
Namaste.
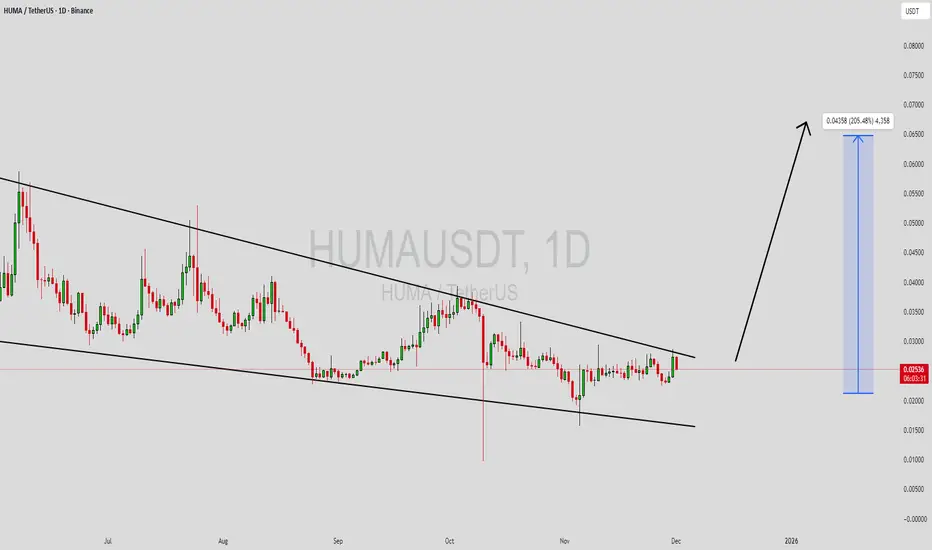
HUMAUSDT Forming Falling wedgeHUMAUSDT is forming a clear falling wedge pattern, a classic bullish reversal signal that often indicates an upcoming breakout. The price has been consolidating within a narrowing range, suggesting that selling pressure is weakening while buyers are beginning to regain control. With consistent volume confirming accumulation at lower levels, the setup hints at a potential bullish breakout soon. The projected move could lead to an impressive gain of around 140% to 150% once the price breaks above the wedge resistance.
This falling wedge pattern is typically seen at the end of downtrends or corrective phases, and it represents a potential shift in market sentiment from bearish to bullish. Traders closely watching HUMAUSDT are noting the strengthening momentum as it nears a breakout zone. The good trading volume adds confidence to this pattern, showing that market participants are positioning early in anticipation of a reversal.
Investors’ growing interest in HUMAUSDT reflects rising confidence in the project’s long-term fundamentals and current technical strength. If the breakout confirms with sustained volume, this could mark the start of a fresh bullish leg. Traders might find this a valuable setup for medium-term gains, especially as the wedge pattern completes and buying momentum accelerates.
✅ Show your support by hitting the like button and
✅ Leaving a comment below! (What is your opinion about this Coin?)
Your feedback and engagement keep me inspired to share more insightful market analysis with you!
HUMAUSDT 12H#HUMA is trading within a symmetrical triangle on the 12H timeframe. Enter this coin only after a solid breakout above both the triangle resistance and the 12H SMA200. In that scenario, the potential upside targets are:
🎯 $0.02129
🎯 $0.02436
🎯 $0.02743
🎯 $0.03180
🎯 $0.03737
⚠️ Always remember to use a tight stop-loss and maintain proper risk management.
HUMAUSDT Forming Bullish PennantHUMAUSDT is forming a clear bullish pennant pattern, a classic bullish continuation signal that often indicates an upcoming breakout. The price has been consolidating within a narrowing range, suggesting that selling pressure is weakening while buyers are beginning to regain control. With consistent volume confirming accumulation at lower levels, the setup hints at a potential bullish breakout soon. The projected move could lead to an impressive gain of around 140% to 150% once the price breaks above the pennant resistance.
This bullish pennant pattern is typically seen after a strong upward move followed by a brief consolidation phase, and it represents a pause before the continuation of the prevailing bullish trend. Traders closely watching HUMAUSDT are noting the strengthening momentum as it nears a breakout zone. The good trading volume adds confidence to this pattern, showing that market participants are positioning early in anticipation of continuation.
Investors’ growing interest in HUMAUSDT reflects rising confidence in the project’s long-term fundamentals and current technical strength. If the breakout confirms with sustained volume, this could mark the resumption of a powerful bullish leg. Traders might find this a valuable setup for medium-term gains, especially as the pennant pattern completes and buying momentum accelerates.
✅ Show your support by hitting the like button and
✅ Leaving a comment below! (What is your opinion about this Coin?)
Your feedback and engagement keep me inspired to share more insightful market analysis with you!
HUMA putting in Potential HL⚛️ HTF Context (Daily)
Prolonged downtrend
Compression forming near lows
Beginning to base and stabilize
This is important:
👉 We have NOT broken out yet
So this is:
👉 Pre Wedge Pop phase
⚛️ What That Means
This is the phase where:
Smart money starts positioning
Volatility compresses
Most traders are still bearish
You’re early here.
👉 This is where asymmetry lives
⚛️ LTF Structure (15m)
Clear trend shift intraday
EMA stack flipped bullish
Pullbacks holding clean
This gives us:
👉 BnB1 inside a developing HTF reversal
⚛️ Model Alignment
This is powerful because:
👉 HTF = Pre-break compression
👉 LTF = Already trending
That’s the exact combination you want.
⚛️ Scenarios
🟢 Bull Case (Primary)
15m continues trending
Daily breaks structure → confirms Wedge Pop
Expansion follows
This becomes:
👉 Early entry into full trend shift
🔴 Bear Case (Failure)
Daily fails to break
15m loses structure
Falls back into base
This becomes:
👉 Failed early positioning
⚛️ Execution Plan
This is NOT late.
This is:
👉 Early continuation inside HTF compression
Looking for:
Higher low holds
Clean pullbacks
Continuation pushes
⚛️ Teaching Point
There are phases:
Reversal Extension → catching the turn
Pre Wedge Pop → positioning BEFORE breakout
Crossback → Unconfirmed continuation
BnB1 → confirmation continuation
This is the one that pays the most when right.
⚛️ Closing
You’re not chasing here.
👉 You’re positioning before confirmation
If this breaks on the Daily This becomes one of the best asymmetric setups on the board
Huma Finance —Cryptocurrency, the future of moneyFull green candle today, about to close full green. Why are these moving?
These aren't the first projects growing strongly in 2026, many projects from the asian exchanges started moving months ago. When the action reaches the major exchanges and bigger projects, it means we are very close, to marketwide bullish action that is.
Huma Finance —HUMAUSDT
" A PayFi network accelerating cross-border and card payments with instant access to liquidity. "
The chart is very good for a 222% rise, also for an easy 400%.
I've been looking at and tracking these pairs for months and they always caught my attention. I wouldn't share them because there wasn't enough activity nor momentum. Now that they are set to move very strongly, activity is no priority. Things change.
Today we are shy and young; tomorrow we are running, drinking and dancing under the rain.
Today the market can be quiet; it can turn wild in matter of days.
Positive, positive, positive up. The market grows after an all-time low. The market starts to grow after a bear market. The market grows from support.
Imagine seeing the start of a bear market at bottom prices, it doesn't happen. The start of the crash in 2025 happened from high prices and new all-time highs.
Market conditions are different now. See HUMAUSDT.
After the bottom was hit, a higher low, volume goes up with a flat bottom and today we get the full green candle.
My thinking is this: Get in and get out with 200-400%. A portion goes into the projects with long-term growth potential, those that we know can grow easily between 10-20X. Another portion goes into more and new trades.
It is active trading when the market starts to move, when it heats up. The passive trading—simply buying—can be done only through the accumulation phase, the past few months.
We are about to become active—are you with me?
I will be here sharing charts daily for your guidance and entertainment, to keep you company while you trade.
If you enjoy the content, you can share it with others or you can follow. All is good as long as we get to grow and exchange. It is a long-term process. You will be seeing me your entire life in this form or another. I hope we can grow together as the Cryptocurrency market continues to evolve.
All the statistics I am seeing are saying that the stablecoins are taking over the conventional forms of payments. It is already happening now, we are living in a new world.
It is the first time ever, in the history of money, that money becomes free—accessible to all. It is the first time in the history of humanity that the monopoly on money has been broken.
Expect the unexpected but be in the market. If you can't be in the market, plan to enter as soon as you can and consider staying in long-term. Not thinking about exchanging this for that, but just holding, having and being part of the money of the future. The money for this present age.
We are a technological civilization, Cryptocurrencies are perfect for the age of information—Aquarius—the age of the internet.
Namaste.
HUMA/USDT - Descending Channel: Massive Breakout or Downside?The HUMA/USDT (2D timeframe) chart shows price moving within a clear Descending Channel:
Lower Highs continue to form → marked by the red resistance trendline 🔴
Lower Lows are also consistent → following the yellow support trendline 🟡
This channel reflects a structured bearish trend, but price is now approaching a critical zone ⚠️
Additionally:
There is a strong bounce reaction from the lower support area (~0.010 – 0.012) 🔄
Price is currently testing the mid-channel area and approaching the dynamic resistance (upper trendline) 📉
---
Key Levels 🎯
Key Resistances:
0.02320 (current minor resistance) 🚧
0.03000 (strong resistance / mid-high target) 🔝
0.03750 (major resistance / breakout confirmation zone) 💥
Key Supports:
0.01700 – 0.01500 (current support area) 🟢
0.01000 – 0.00978 (strong support / channel bottom) 🧱
---
Bullish Scenario 📈🚀
A bullish move will occur if price breaks out of the channel pressure:
Main confirmations:
Break & close above the red descending resistance trendline 🔴
Break above the 0.02320 level 📊
Upside targets:
0.03000 (first target) 🎯
0.03750 (main target / strong supply zone) 💥
Additional validation:
Increasing volume during breakout 📢
Successful retest of breakout area as support 🔄
➡️ If this scenario plays out, the bearish structure could shift into a bullish reversal trend 🔁📈
---
Bearish Scenario 📉⚠️
Bearish momentum remains dominant if price fails to break out:
Confirmations:
Strong rejection at the upper trendline ❌
Failure to hold above 0.02320 🚫
Downside targets:
0.01700 (nearest support) 🟢
0.01200 (mid-support) 📍
0.00978 (lower channel / major support) 🧱
➡️ As long as price remains inside the channel, this is still considered a bearish continuation pattern 🔻
---
Conclusion 🧠
HUMA is currently at a crucial decision zone ⚖️
The descending channel remains valid, but rebound momentum is starting to appear 🔄
A breakout from the channel could signal the beginning of a significant trend reversal 🚀
#HUMAUSDT #CryptoAnalysis #TechnicalAnalysis #DescendingChannel #BreakoutSetup #Altcoin #CryptoTrading #BearishTrend #BullishReversal #SupportResistance #PriceAction
HUMAUSDT Forming Falling WedgeHUMAUSDT is forming a clear falling wedge pattern, a classic bullish reversal signal that often indicates an upcoming breakout. The price has been consolidating within a narrowing range, suggesting that selling pressure is weakening while buyers are beginning to regain control. With consistent volume confirming accumulation at lower levels, the setup hints at a potential bullish breakout soon. The projected move could lead to an impressive gain of around 140% to 150% once the price breaks above the wedge resistance.
This falling wedge pattern is typically seen at the end of downtrends or corrective phases, and it represents a potential shift in market sentiment from bearish to bullish. Traders closely watching HUMAUSDT are noting the strengthening momentum as it nears a breakout zone. The good trading volume adds confidence to this pattern, showing that market participants are positioning early in anticipation of a reversal.
Investors’ growing interest in HUMAUSDT reflects rising confidence in the project’s long-term fundamentals and current technical strength. If the breakout confirms with sustained volume, this could mark the start of a fresh bullish leg. Traders might find this a valuable setup for medium-term gains, especially as the wedge pattern completes and buying momentum accelerates.
✅ Show your support by hitting the like button and
✅ Leaving a comment below! (What is your opinion about this Coin?)
Your feedback and engagement keep me inspired to share more insightful market analysis with you!
HUMAUSDT Forming Falling WedgeHUMAUSDT is forming a clear falling wedge pattern, a classic bullish reversal signal that often indicates an upcoming breakout. The price has been consolidating within a narrowing range, suggesting that selling pressure is weakening while buyers are beginning to regain control. With consistent volume confirming accumulation at lower levels, the setup hints at a potential bullish breakout soon. The projected move could lead to an impressive gain of around 90% to 100% once the price breaks above the wedge resistance.
This falling wedge pattern is typically seen at the end of downtrends or corrective phases, and it represents a potential shift in market sentiment from bearish to bullish. Traders closely watching HUMAUSDT are noting the strengthening momentum as it nears a breakout zone. The good trading volume adds confidence to this pattern, showing that market participants are positioning early in anticipation of a reversal.
✅ Show your support by hitting the like button and
✅ Leaving a comment below! (What is your opinion about this Coin)
Your feedback and engagement keep me inspired to share more insightful market analysis with you!
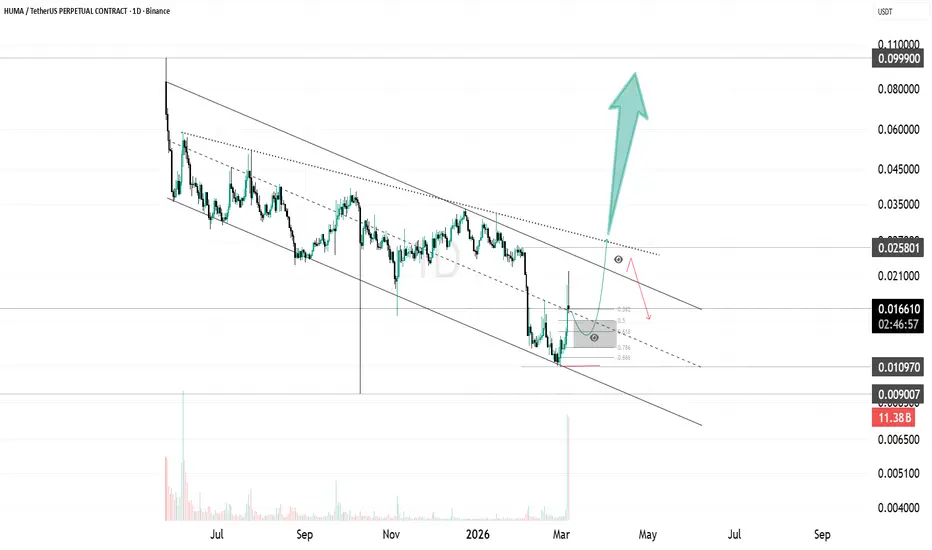
HUMA Market Structure Approaching Critical ResistanceHUMA has been trading inside a clear descending channel since the initial distribution phase, with price consistently respecting both the upper resistance and lower support boundaries. The structure has been defined by lower highs and lower lows, confirming the broader bearish trend.
Recently, the market reacted strongly from the lower boundary of the channel, forming a local bottom around 0.0109. This bounce pushed price back toward the mid-range resistance and Fibonacci retracement zone between 0.0152 and 0.0125, which is currently acting as the first major decision area.
If buyers manage to hold above the current retracement zone and build momentum, the next key resistance sits near 0.0258, which aligns with the upper descending trendline. A clean breakout above that level would signal a structural shift and open the door for a larger expansion toward 0.08–0.10.
However, if price fails to sustain strength and gets rejected from the 0.016–0.018 resistance area, the broader downtrend structure may continue. In that case, the market could revisit 0.011 support, and a breakdown below that level would expose 0.009 and lower channel support.
At this stage, HUMA is attempting a recovery from the channel floor, but the reaction at the mid resistance zone will determine whether this becomes a trend reversal or just another relief rally within the downtrend.
HUMAUSDT Forming Bullish MomentumHUMAUSDT is forming a clear bullish momentum pattern, a classic bullish reversal signal that often indicates an upcoming breakout. The price has been consolidating within a narrowing range, suggesting that selling pressure is weakening while buyers are beginning to regain control. With consistent volume confirming accumulation at lower levels, the setup hints at a potential bullish breakout soon. The projected move could lead to an impressive gain of around 80% to 90% once the price breaks above the wedge resistance.
This bullish momentum pattern is typically seen at the end of downtrends or corrective phases, and it represents a potential shift in market sentiment from bearish to bullish. Traders closely watching HUMAUSDT are noting the strengthening momentum as it nears a breakout zone. The good trading volume adds confidence to this pattern, showing that market participants are positioning early in anticipation of a reversal.
Investors’ growing interest in HUMAUSDT reflects rising confidence in the project’s long-term fundamentals and current technical strength. If the breakout confirms with sustained volume, this could mark the start of a fresh bullish leg. Traders might find this a valuable setup for medium-term gains, especially as the pattern completes and buying momentum accelerates.
✅ Show your support by hitting the like button and
✅ Leaving a comment below! (What is your opinion about this Coin?)
Your feedback and engagement keep me inspired to share more insightful market analysis with you!
HUMA/USDT – Reversal Incoming or Deeper Breakdown?HUMA has been moving inside a large Descending Channel for months, forming a repeated yet controlled pattern of selling pressure. Every rally has consistently failed to break the upper trendline, maintaining a strong lower-high structure. But now, something important is happening:
👉 Price is sitting directly above the Key Support at 0.025–0.0225, a long-standing “life-or-death” zone for buyers.
This is not just another support — this is the final defense before a major structural breakdown or a powerful market reversal.
---
🔶 Clear Technical Structure
1. Descending Channel (Major Trend)
The trend remains bearish, but the channel is tightening — an early sign of momentum shift.
2. Key Support Box (0.025–0.0225)
This zone has acted as a strong demand area multiple times.
The more it gets tested, the bigger the potential move — either a breakout upward or a sharp breakdown.
3. Midline Reaction
Price frequently reacts around the midline, showing that market participants are respecting this dynamic level.
4. Key Horizontal Targets
0.031 → 0.037 → 0.0445 → 0.055 → 0.067
These levels are not only resistance but also potential rally checkpoints if structure shifts bullish.
---
🟢 Bullish Scenario (Major Reversal Potential)
Bullish bias becomes valid only if:
1. Price breaks the upper trendline with clean momentum.
A breakout without volume is not valid.
2. Daily close above 0.031.
This confirms the long-term downtrend is weakening.
If confirmed, bullish targets:
TP1: 0.037 (nearest resistance, minor rejection zone)
TP2: 0.0445 (major structural resistance)
TP3: 0.055 (bullish structure activation)
TP4: 0.067 (high-value upside target)
Bullish Intent
The channel has extended for a long period — sellers may be exhausted.
Price is stabilizing near strong support.
Large reversals often begin from areas like this.
---
🔴 Bearish Scenario (Trend Continuation)
Bearish momentum continues if:
Daily close falls below 0.0225.
This would indicate the final support has failed.
Bearish downside targets:
T1: 0.018 (mid-to-lower channel zone)
T2: 0.015–0.0135 (lower boundary, potential capitulation sweep)
Bearish Intent
The Descending Channel remains dominant.
Selling pressure is still strong near the upper trendline.
Losing the key support can trigger panic-driven moves.
---
🎯 Market Psychology
The 0.025–0.0225 level currently represents:
A slow accumulation zone for smart money, or
A distribution zone before continuation downward
At this stage, the market is choosing its next direction — and the move that follows this zone is usually significant.
---
#HUMA #HUMAUSDT #CryptoAnalysis #TechnicalAnalysis #DescendingChannel #ReversalZone #BreakoutWatch #CryptoTrading #AltcoinAnalysis #MarketStructure #SupportAndResistance #ChartPatterns
HUMAUSDT Forming Falling WedgeHUMAUSDT is forming a clear falling wedge pattern, a classic bullish reversal signal that often indicates an upcoming breakout. The price has been consolidating within a narrowing range, suggesting that selling pressure is weakening while buyers are beginning to regain control. With consistent volume confirming accumulation at lower levels, the setup hints at a potential bullish breakout soon. The projected move could lead to an impressive gain of around 190% to 200% once the price breaks above the wedge resistance.
This falling wedge pattern is typically seen at the end of downtrends or corrective phases, and it represents a potential shift in market sentiment from bearish to bullish. Traders closely watching HUMAUSDT are noting the strengthening momentum as it nears a breakout zone. The good trading volume adds confidence to this pattern, showing that market participants are positioning early in anticipation of a reversal.
Investors’ growing interest in HUMAUSDT reflects rising confidence in the project’s long-term fundamentals and current technical strength. If the breakout confirms with sustained volume, this could mark the start of a fresh bullish leg. Traders might find this a valuable setup for medium-term gains, especially as the wedge pattern completes and buying momentum accelerates.
✅ Show your support by hitting the like button and
✅ Leaving a comment below! (What is your opinion about this Coin?)
Your feedback and engagement keep me inspired to share more insightful market analysis with you!
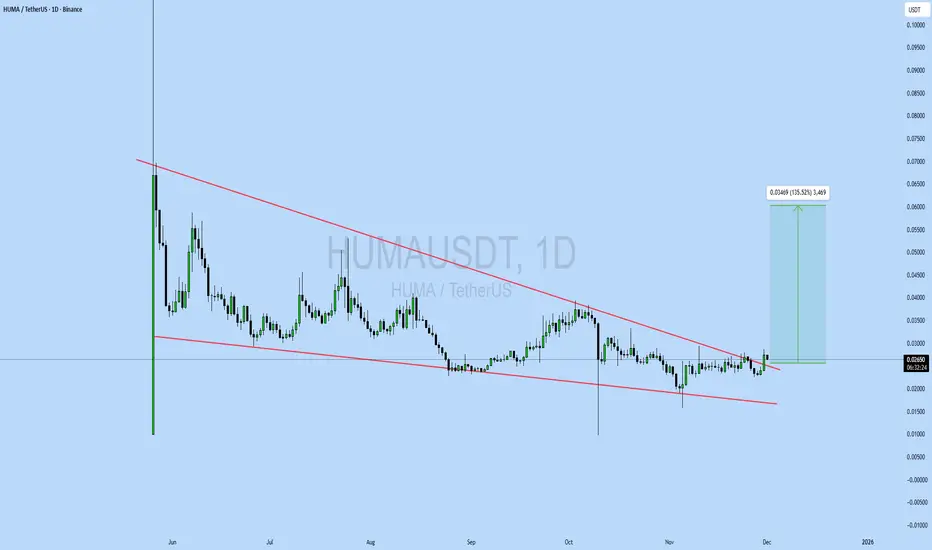
HUMAUSDT UPDATE#HUMA
UPDATE
HUMA Technical Setup
Pattern: Falling Wedge Pattern
Current Price: $0.0267
Target Price: $0.0347
Target % Gain: 135.52%
Technical Analysis: HUMA is breaking out of a falling wedge pattern on the 1D chart, signalling a bullish reversal after an extended downtrend. Price has compressed between descending trendlines and is now pushing above wedge resistance. The breakout is supported by improving structure, with upside projection derived from the wedge height targeting the highlighted resistance zone. Confirmation comes from sustained price acceptance above the breakout level, opening the door for continued upside momentum.
Time Frame: 1D
Risk Management Tip: Always use proper risk management.
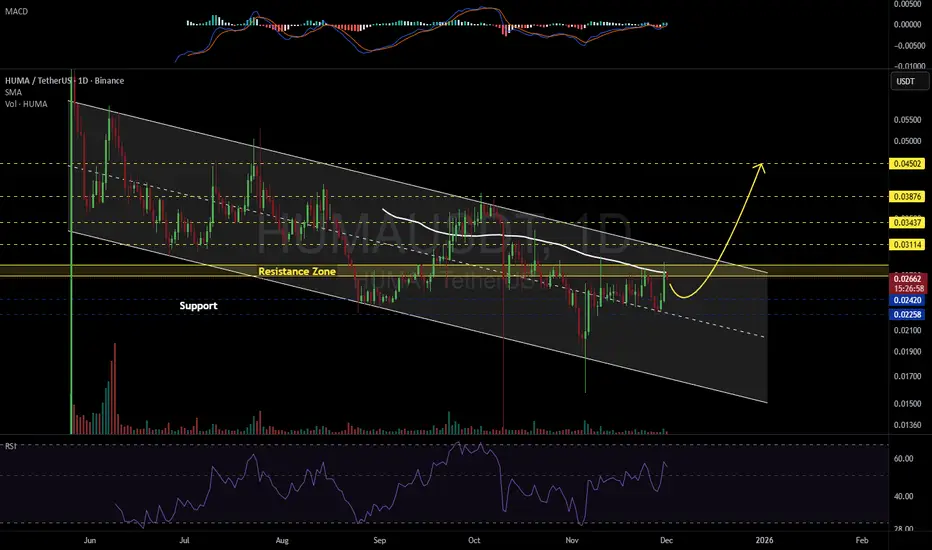
HUMAUSDT 1D#HUMA is moving inside a descending channel on the daily chart. It is currently facing a strong resistance zone, reinforced by the daily SMA100, which adds further pressure. Price may retest the support levels at $0.02420 and $0.02258.
If price breaks above the channel resistance, the potential targets are:
🎯 $0.03114
🎯 $0.03437
🎯 $0.03876
🎯 $0.04502
⚠️ Always remember to use a tight stop-loss and maintain proper risk management.
HUMAUSDT Forming Falling WedgeHUMAUSDT is forming a clear falling wedge pattern, a classic bullish reversal signal that often indicates an upcoming breakout. The price has been consolidating within a narrowing range around $0.052 USDT, suggesting that selling pressure is weakening while buyers are beginning to regain control. With consistent volume confirming accumulation at lower levels, the setup hints at a potential bullish breakout soon. The projected move could lead to an impressive gain of 190% to 200%+ once the price breaks above the wedge resistance, fueling searches for HUMAUSDT price prediction.
This falling wedge pattern is typically seen at the end of downtrends or corrective phases, and it represents a potential shift in market sentiment from bearish to bullish. Traders closely watching HUMAUSDT are noting the strengthening momentum as it nears a breakout zone near $0.055. The good trading volume adds confidence to this pattern, showing that market participants are positioning early in anticipation of a reversal in this AI-blockchain token.
Investors’ growing interest in HUMAUSDT reflects rising confidence in the project’s long-term fundamentals and current technical strength, particularly with decentralized AI marketplace features. If the breakout confirms with sustained volume, this could mark the start of a fresh bullish leg. Traders might find this a valuable setup for medium-term gains, especially as the wedge pattern completes and buying momentum accelerates in falling wedge breakout crypto plays.
✅ Show your support by hitting the like button and ✅ Leaving a comment below! (What is You opinion about this Coin) Your feedback and engagement keep me inspired to share more insightful market analysis with you!
HUMAUSDT UPDATE#HUMA
UPDATE
HUMA Technical Setup
Pattern: Bullish Falling Wedge Pattern
Current Price: $0.0317
Target Price: $0.0632
Target % Gain: 110.27%
NASDAQ:HUMA is breaking out of a falling wedge pattern on the 1D timeframe. Current price is $0.0317 with a target near $0.0632, showing over 110% upside potential. The breakout confirms bullish momentum with structure favoring continuation. Always use proper risk management.
Time Frame: 1D
Risk Management Tip: Always use proper risk management.