In-depth trading ideas
๏ปฟH TEAM PRIORITIZES OPERATIONAL SECURITYTurkish exchange CoinTR announced a multi-asset delisting, removing all USDT and TRY trading pairs for Humanity ( $H ) and dozens of other assets effective 13 August 2026. The decision followed a routine review to ensure a safer trading environment. Open orders were canceled automatically, though withdrawals remain open until 30 September 2026. This is bearish for H in the short term because it reduces trading venues and liquidity, potentially increasing volatility. It reflects broader exchange risk-management trends but may isolate some regional investors. In a July interview, founder Terence Kwok stated Humanity Protocol will refocus its cybersecurity efforts on operational security after a $36 million June exploit. The breach was traced to malware on a developerโs laptop that compromised private keys, highlighting a shift from smart-contract to human-targeted attacks. This is a neutral-to-bullish development for Hโs long-term prospects. It shows the team is addressing the root causeโpoor key managementโwhich is critical for rebuilding investor trust. However, execution and the success of the upcoming mainnet relaunch will be the true test. Humanity Protocol is in a critical rebuild phase, contending with exchange delistings while implementing crucial security reforms. Will its pivot to stronger operational safeguards successfully restore community confidence and drive the next growth cycle?
$H has already bounced nearly 80% from the $0.20 support area, $H has already bounced nearly 80% from the $0.20 support area, showing that buyers are still in control and the bullish structure remains intact. ๐
As long as price holds above $0.20, a move toward the $0.60 region remains a realistic target. ๐
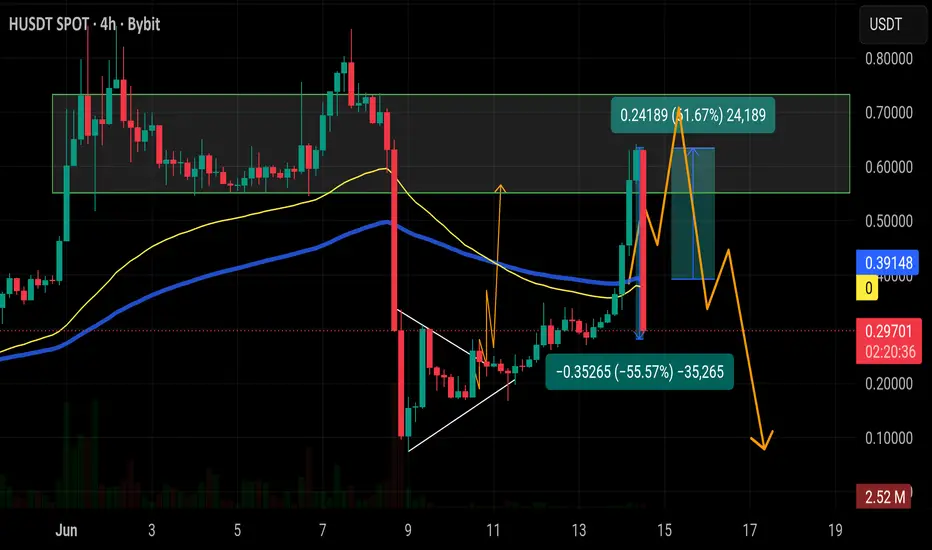
$H saw a perfect rejection from the $0.60-$0.80 supply zone, $H saw a perfect rejection from the $0.60-$0.80 supply zone, exactly where sellers were expected to step in after the 150% rally.
After reclaiming the 99 EMA and delivering another 60% surge, price ran straight into a major resistance area and was met with strong selling pressure. ๐
The rejection confirms that the $0.60-$0.80 zone remains a key supply area.
$H delivered another explosive 60% rally within 7 hours after re$H delivered another explosive 60% rally within 7 hours after reclaiming the 99 EMA, bringing the total gain from the bottom to more than 150%.
Price is now trading within the $0.60-$0.80 supply zone, an area that previously attracted heavy selling pressure. While momentum remains strong, traders should be aware that a pullback or period of consolidation is possible as price tests this resistance range. ๐
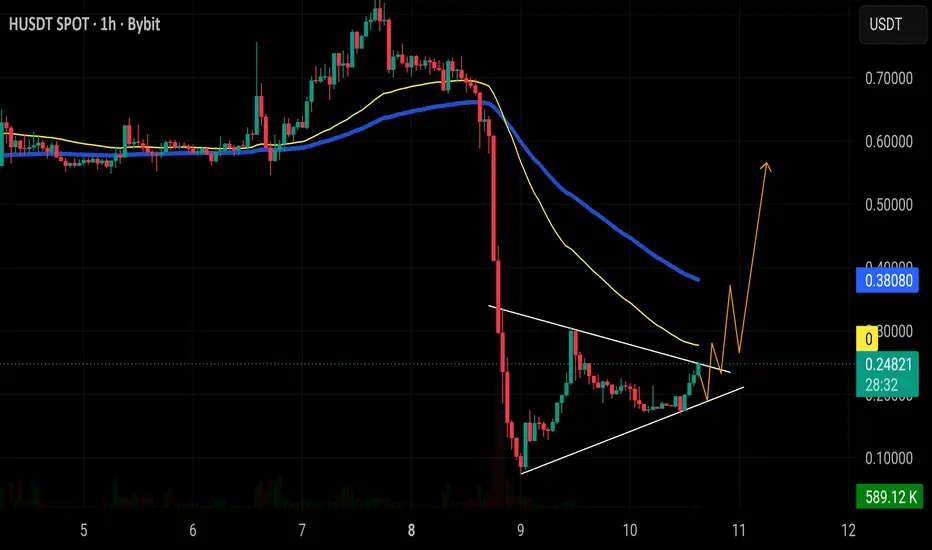
$H has already delivered an impressive 90% pump after breaking $H has already delivered an impressive 90% pump after breaking out of an ascending triangle pattern.
Price is now testing the 99 EMA, a key resistance level. A successful breakout and close above the 99 EMA could move toward the $0.60-$0.80 resistance zone.
That area remains a major supply zone, so some profit-taking or a temporary rejection would not be surprising after such a strong rally.
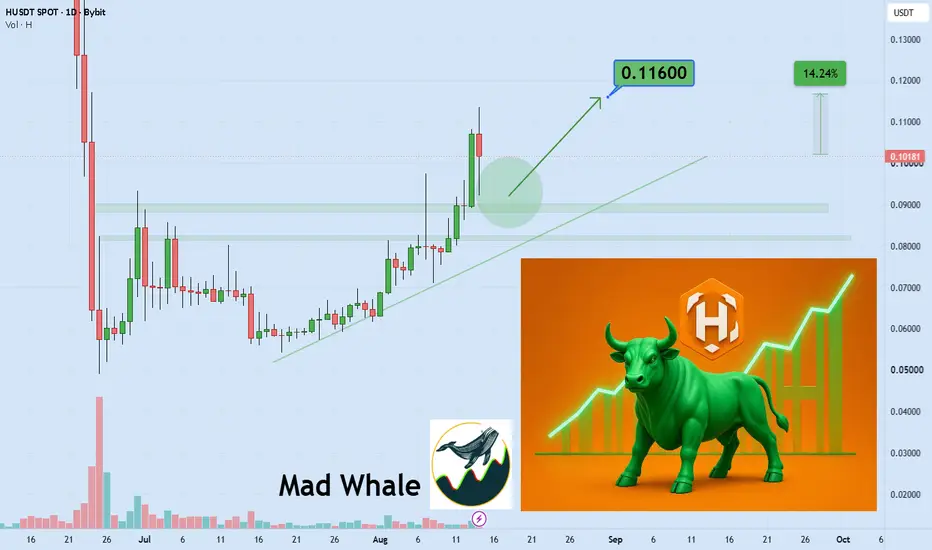
$H has already delivered a 65% move from the breakout zone $H has already delivered a 65% move from the breakout zone ๐
As long as price holds above the recent breakout area, the recovery structure remains intact and bulls could continue pushing toward higher resistance levels in the sessions ahead. ๐๐ฅ
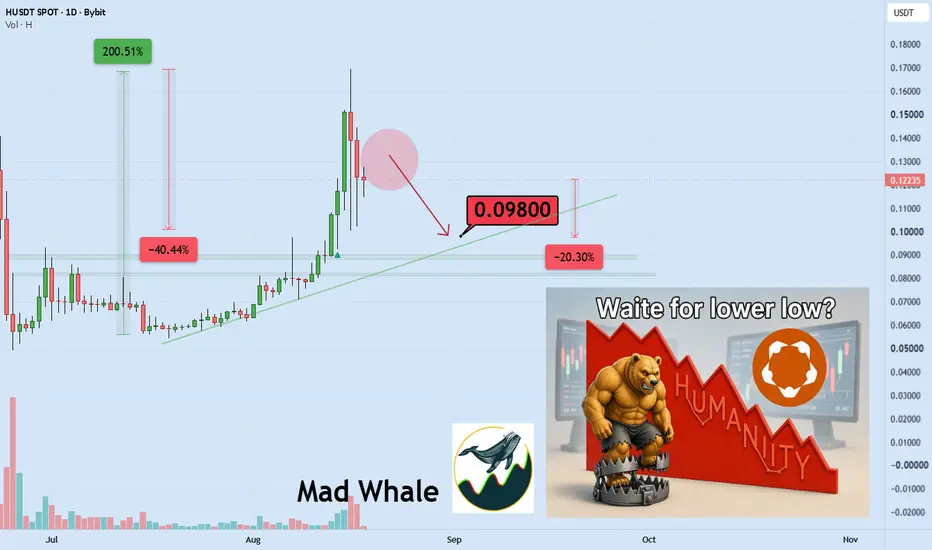
HUSDT โ 20% Correction Incoming? HUSDT is showing signs of slowing momentum after its recent move higher. If buyers fail to defend current support levels, a correction of around 20% could be the next likely scenario.
A pullback of this size would be considered normal after a strong rally and could help reset market conditions before the next major trend develops. The key area to watch is whether support holds or breaks under increased selling pressure.
Watch volume and price action closelyโconfirmation is more important than prediction.
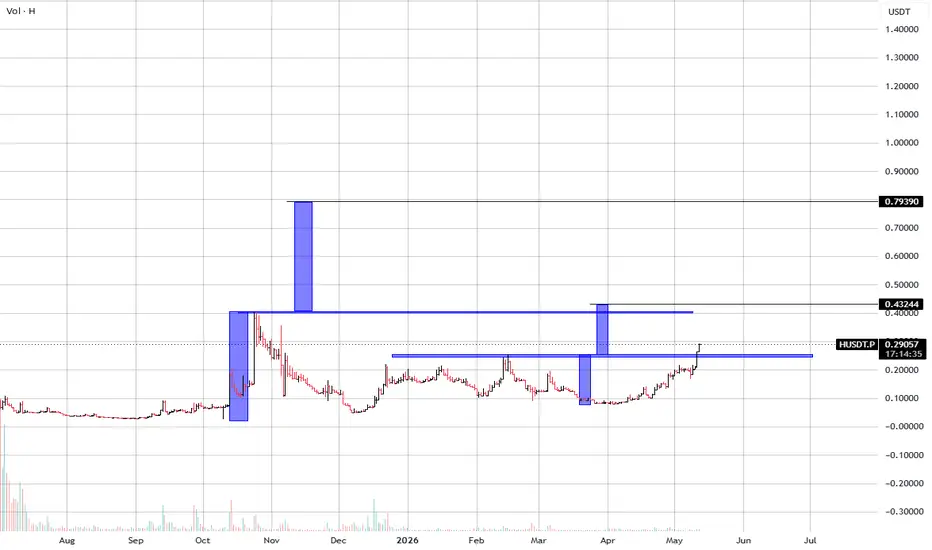
H โ Reclaiming a Major Resistance ZoneH is showing signs of a structural recovery after a long corrective phase, positioning itself within the microcap rotation narrative where accumulation begins shifting into momentum.
This is the type of setup where compression near resistance can lead to fast expansion.
๐ง Stage 1 โ Early Stage 2 Transition
H is building a strong recovery structure:
โ Major downtrend โ completed
โ Long accumulation โ established
โ Higher lows โ developing
โ Resistance reclaim attempt โ ongoing
After months of ranging between ~$0.10โ$0.22, price is now pressing back into a key breakout area.
๐ Current Setup
Price: ~$0.29
H is now:
Reclaiming the $0.24โ$0.30 zone
Building momentum into resistance
Printing stronger impulsive moves
This suggests demand is returning after a prolonged base phase.
๐งฑ Key Levels
Support:
$0.24 โ breakout / flip zone
$0.10 โ macro base
Resistance / Targets:
$0.43 โ first major resistance
$0.79 โ macro liquidity target
๐ฏ Scenario
โ
Bullish Case (Stage 2 Trigger)
If H:
Holds above $0.24
Breaks through $0.30โ$0.43
Continues with expanding volume
โ Transition into full Stage 2 expansion becomes likely
โ ๏ธ Weak Case
Failure to hold $0.24:
โ Return into range
โ Extended consolidation
(No major structural damage unless macro support fails)
๐ Final Thought
H is approaching a key inflection point:
๐ Reclaiming major resistance after long accumulation
If confirmation follows:
โก accumulation โ expansion
And thatโs where momentum can accelerate quickly.
Humanity protocol H hack๐ It looks like someone was systematically pushing #HUSDT higher on relatively low volume.
Then, right at the top, when trading activity exploded and volumes became dozens โ if not hundreds โ of times larger than the daily average, large positions were quietly unloaded.
As they say: "Everything for retail." ๐
And only after that, the Humanity Protocol team announced that hackers had exploited the project for $32 million.
But here's the interesting part.
Compared to what appears to have happened on the chart, that $32M looks like just a drop in the ocean.
Are these events connected? We can't say.
But the sequence of events certainly raises questions.
๐ Either way, this is another serious hit to the crypto community's trust in relatively young projects.
Especially in a market that is already struggling with:
โข weak liquidity
โข limited inflow of fresh capital
โข and increasingly cautious investors
๐ One more observation.
In our opinion, there are at least two more coins currently following a very similar pattern.
Slow accumulation.
Gradual price push.
Growing retail interest.
Suddenly exploding volume...
And then?
We'll see. (although the standard approach involves a rather steep reduction of 80%โ90%)
Would you like us to share our observations and highlight the projects where, in our opinion, traders should be especially careful? ๐
๐ง DYOR | This is not financial advice, just thinking out loud.
______________
โ Follow us โค๏ธ for daily crypto insights & updates!
๐ Donโt miss out on important market mov
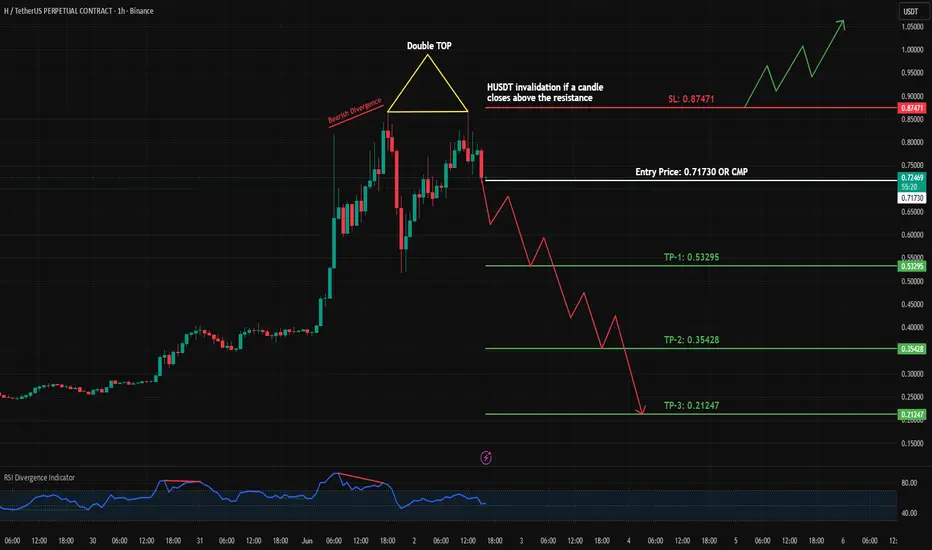
HUSDT Bearish Divergence + Double Top | Short Trade OpportunityHUSDT.P is currently trading within a strong uptrend on the higher timeframes. However, the 1-hour chart is showing early signs of weakness as a **Bearish Divergence** has formed alongside a Double Top Pattern.
These technical signals suggest that bullish momentum may be fading, increasing the probability of a short-term correction.
Trade Setup:
โข Entry: Current Market Price (CMP)
โข Direction: Short / Sell
โข Confirmation: Bearish Divergence + Double Top Pattern
โข Risk Management: Strict stop-loss and proper position sizing
Always wait for confirmation and manage your risk accordingly. No setup is guaranteed, and preserving capital should remain the top priority.
What do you think? Is a deeper correction ahead, or will buyers regain control? Share your analysis in the comments.
๐ Like | ๐ฌ Comment | ๐ Follow for more trading ideas and technical analysis.
#USDT #CryptoTrading #TechnicalAnalysis #BearishDivergence #DoubleTop #ShortTrade #DayTrading #SwingTrading #PriceAction #ChartAnalysis #CryptoSignals #TradingView #RiskManagement #ForexTrading #CryptoMarket #TraderLife #MarketAnalysis #TradeSetup #BTC #Altcoins
HUSDT Forming Bullish MomentumHUSDT is forming a clear bullish momentum pattern, a classic bullish wave signal that often indicates an upcoming breakout. The price has been consolidating within a narrowing range, suggesting that selling pressure is weakening while buyers are beginning to regain control. With consistent volume confirming accumulation at lower levels, the setup hints at a potential bullish breakout soon. The projected move could lead to an impressive gain of around 50% to 60% once the price breaks above the key resistance zone.
This bullish momentum pattern is typically seen at the end of downtrends or corrective phases, and it represents a potential shift in market sentiment from bearish to bullish. Traders closely watching HUSDT are noting the strengthening momentum as it nears a critical breakout area. The healthy trading volume adds confidence to this setup, showing that market participants may be positioning early in anticipation of a strong upward move.
Investorsโ growing interest in HUSDT reflects increasing confidence in the project's long-term fundamentals and current technical strength. The ongoing consolidation phase suggests that accumulation is taking place while bearish pressure gradually weakens. As momentum continues to build, the probability of a bullish breakout becomes increasingly favorable.
If the breakout confirms with sustained buying volume, this could mark the beginning of a fresh bullish leg. Traders may find this setup attractive for medium-term opportunities, especially as buying momentum accelerates and market sentiment improves. A successful breakout could unlock significant upside potential and attract additional attention from traders seeking high-growth opportunities.
โ
Show your support by hitting the like button!
โ
Leave a comment below! (What is your opinion about this coin?)
Your feedback and engagement keep me inspired to share more insightful market analysis with you! ๐๐
HUSDT/USDT โ Update๐ HUSDT/USDT โ Update
HUSDT continues showing strong bullish structure after defending the key support zone and maintaining higher lows inside the current accumulation range. The recent momentum suggests buyers remain in control, increasing the probability of a continuation move if trend confirmation continues.
๐ฏ TP 1: 0.2930
๐ฏ TP 2: 0.3180
๐ TP 3: Runner target open โ allowing the trend to capture maximum upside potential.
๐ As long as price remains above the support zone, the bullish scenario stays active.
This is our trading expectation and not financial advice : everything depends on confirmed trend continuation.
Will HUMANITY Break the $0.20 BarrierHUMANITY is entering a big resistance level that has rejected it multiple times ($0.20) and bullish momentum has pushed it back into this level, where there should be significant resistance.
Buyers have also formed a higher low structure and respected the upward trendline as it moves towards the resistance. Price has consolidated between the rising support and the falling resistance, often leads to an breakout when momentum pushes through.
Bullish scenario -Break $0.20 to $0.23 continuation higher.
Bearish scenario -Price rejects from resistance and pullbacks to support.
Overall, a move should happen soon.
HUSDT 1D#H is trading within a symmetrical triangle on the daily chart and is holding above the SMA100. In case of a breakout above the triangle resistance, the potential upside targets are:
๐ฏ $0.17437
๐ฏ $0.21351
๐ฏ $0.25264
๐ฏ $0.30836
๐ฏ $0.37934
โ ๏ธ Always remember to use a tight stop-loss and maintain proper risk management.