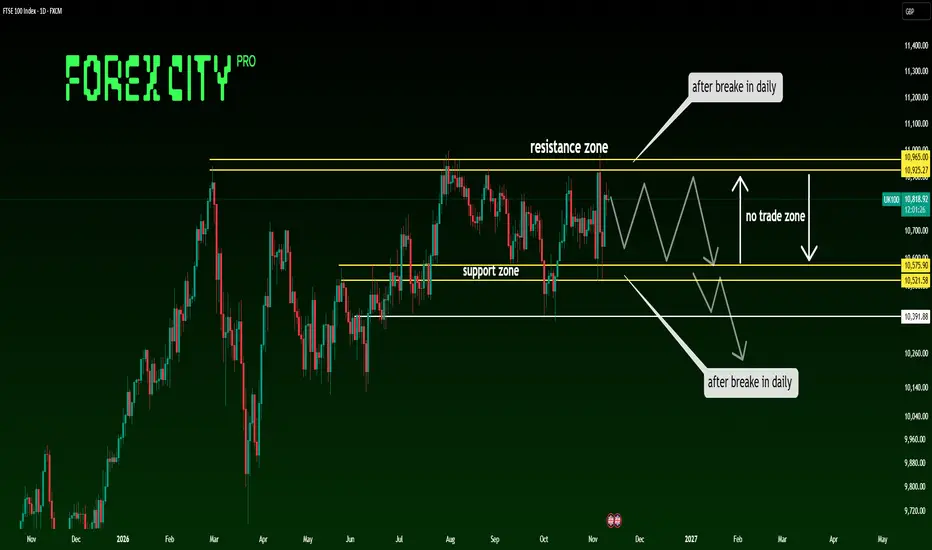
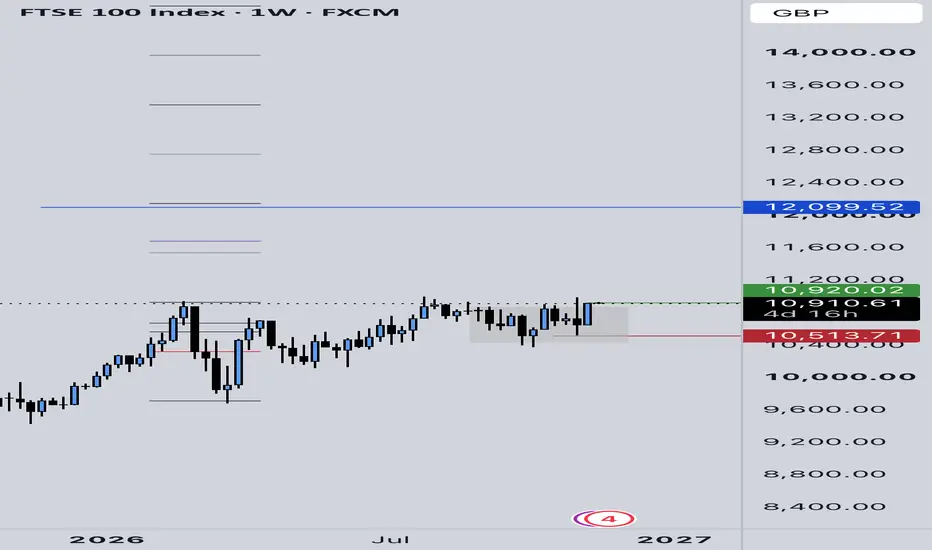
FTSE 100 | Geopolitical Risks, AI Bubble Fears & Inflation FTSE 100 | Geopolitical Risks, AI Bubble Fears & Inflation — Waiting for a Decisive Breakout!
Hello everyone, and welcome back to all my TradingView followers! 👋📊
Today, we are taking a closer look at the **FTSE 100 (UK100)** from both a fundamental and technical perspective.
The index is currently facing a combination of macroeconomic uncertainty, monetary policy challenges, geopolitical risks and growing concerns across global equity markets.
## 🌍 Fundamental Analysis | Global Economic Ou
In-depth trading ideas
UK100FT 2H: Resistance Rejection Puts Support Levels in Focus UK100FT 2H: Resistance Rejection Puts Support Levels in Focus
UK100FT is testing the 10,875–10,900 resistance area after a strong bullish rally within an ascending channel. Price is showing hesitation near resistance, increasing the possibility of a corrective pullback toward the marked support zones.
📉 Downside Route 🎯 Support 1: 10,700–10,725 🎯 Support 2: 10,550–10,580
🛡️ Key Resistance The 10,875–10,900 zone is the immediate supply area. Rejection from this region could encourage sellers
FTSE 100: higher lows press on 11,005, breakout eyes 11,195The FTSE 100 set an all-time high at 11,005 on 5 November and was rejected hard, falling more than 450 points in a day and a half. What has happened since is the interesting part. Instead of rolling over, the index has climbed back in steps, with each dip stopping higher than the last: 10,543 on 6 November, 10,764 on 10 November and 10,850 on 12 November. It is now trading near 10,960, less than 50 points from the record.
Why the bias is long
Higher lows pressing into a flat ceiling tell us buy
Bull Monday rise and dipGlobal financial markets begin the new trading week with signs of recovery following one of the most turbulent periods for technology shares in recent months.
Asian equities are rebounding, US stock futures are higher, and investors are cautiously returning to semiconductor companies following last week's sharp sell-off.
However, the underlying concerns have not disappeared. Investors remain uncertain about the profitability of artificial intelligence investment, the potential for tighter US r
UK100 — Bullish Expansion Toward 10,767The UK100 is shaping a potential recovery phase, with the current technical picture highlighting 10,767 as the next upside objective. The developing structure suggests that the index could attract renewed buying interest and work its way toward higher price territory.
Rather than focusing on short-term fluctuations, this outlook centers on the possibility of a broader upward extension. If buyers continue to strengthen their influence, the index may build a progressive advance toward the project
New Month money with 10680 10656 supportThe FTSE is starting November with a weaker short-term technical picture. Friday's attempted recovery has faded, and the index is trading below its daily pivot, with the 30-minute chart showing a sequence of lower highs.
However, the daily chart is still relatively neutral. Price is sitting close to its 10- and 25-day moving averages, and RSI remains slightly above 50.
My prediction today is for an early attempt to recover towards 10,732–745, followed by renewed selling if that resistance hold
Today's bias: Neutral to bearish below 10730-10760Global financial markets begin an exceptionally important week with investors balancing three competing influences: elevated oil prices, uncertainty surrounding artificial intelligence investment, and a series of major central bank decisions.
The Federal Reserve, European Central Bank and Bank of Japan are all expected to announce monetary policy decisions this week. Meanwhile, earnings from some of the world's largest technology companies will provide a crucial test of confidence in the AI inv
Potential bullish rise?UK100 is falling towards the pivot and could bounce toward the 1st resistance.
Pivot: 10,738.08
1st Support: 10,620.17
1st Resistance: 10,915.23
Disclaimer:
The opinions given above constitute general market commentary and do not constitute the opinion or advice of IC Markets or any form of personal or investment advice.
Any opinions, news, research, analyses, prices, other information, or links to third-party sites contained on this website are provided on an "as-is" basis, are intended to
FTSE 100 at 10,744 holds 10,630, is 10,892 next?The FTSE 100 closed Wednesday at 10,694.49 and was near 10,744 this morning. The close sat above its 20-day (10,648) and 200-day (10,518) averages and just under its 50-day at 10,705. The low to hold is 10,630.00 from 23 Oct. The weekly chart is up, with the 40-week average at 10,533 well below price, but the move is a slow grind, so the read is slight.
If it goes up (most likely). A daily close over 10,892.40, the 16 Oct high, would clear the recent top. Next is 10,989.50, the 31 Jul high and
UK100 — Bearish SetupUK100 is showing a weakening price structure, with recent market behavior pointing toward renewed downside potential. Selling momentum remains visible across the broader formation, while the upside is struggling to establish sustained strength.
The current setup favors a bearish continuation, with the analysis focused on the developing structure rather than short-term fluctuations. If sellers retain control, the index can extend lower as the downside sequence develops.
From a technical perspec
FTSE 100 Has Potential for Further DeclinesBased on the H4 chart, the FTSE 100 previously faced bearish pressure from September, reaching a swing low around 10,359.2 in early October. PEPPERSTONE:UK100
Following this low, the price staged a strong recovery, climbing to 10,892.9 by October 19.
However, this upward momentum could not be sustained, and the price once again came under selling pressure.
------------------------------------------------------------------------------------------------------------------
✅ Market Structure
FTSE100 UK inflation is the main focus todayUK inflation is the main focus for markets today. Higher-than-expected inflation increases the risk that the Bank of England will keep interest rates elevated for longer. This could put pressure on UK shares, particularly property companies and other interest-rate-sensitive sectors.
Comments from BoE Governor Andrew Bailey could provide further clues about the outlook for interest rates. Public-finance figures and UK house-price data will also offer insight into the strength of the economy.
Gl
UK100: The Next Big Move Is Taking Shape!👑 UK100 / FTSE100 — THE LONDON MARKET HEIST IS ON! 🇬🇧💷
🎯 BULLISH DAY / SWING TRADE BLUEPRINT
The Thief Trader crew is watching UK100 / FTSE100 for a potential upside opportunity — but the market still has to prove the move.
💰 MY ANALYSIS
My analysis focuses on a layered-entry approach rather than chasing price at one level.
Instead of entering everything at once, I am watching multiple buy-limit levels across the zone:
🟢 Layered Entry Zone:
10660 → 10750
This is a structured accumulation area
FTSE READY TO CRASH... History says so...Almost every FTSE down-turn has followed the same pattern. Maybe not 100% but a flash look at each period in time (in the small images) and you would think it's exactly the same chart.
Some periods have had more congestion at the top, so this chopping about could persist a little longer. However, the pattern always remains the same. In the chart, I have shown the formula for these bull market build-ups, plus the previous occasions in the FTSE that serve to prove the theory... Yes, history does
Bulls get a kicking but 10710 10660 supportGlobal markets are presenting a more cautious picture this morning following a significant reversal in European equities yesterday. The FTSE 100 and DAX both fell by more than 1% on Monday, while US technology shares staged a recovery. That divergence is important: concerns about European fiscal stability are now competing with uncertainty surrounding the profitability and financing of artificial intelligence.
Overnight, Asian equities have weakened again, oil remains elevated amid Middle Easte
UK 100 Eyes 11000 as Investors Rotate Away From AI StocksThe UK 100 enters the new trading week following an impressive rally which saw it gain approximately 2.4% over the previous five sessions, closing on Friday October 16th at 10838 and recording one of its strongest weekly performances since April in the process.
The renewed buying interest may be attributed to a shift in global investor sentiment, with concerns surrounding elevated US valuations and the sustainability of AI related investment spending prompting some investors to reduce exposure
FTSE 100 One final 1W MA100 correction before 20000.FTSE 100 (UK100) has been trading within a historical Channel Up since 1988. All major crises since 2000 (Dotcom, U.S. Housing, COVID) have hit its (green) Buy Zone (0.236 - 1.0 Fibonacci range) and turned out to be generational buy opportunities.
Right now the index is trading within the 0.618 - 0.5 Channel Fib with its 1M RSI having just formed a Bearish Cross. This resembles the Bearish Cross of February 1994, which also took place with the market within that Fibonacci Zone. This was the tim
A slightly more encouraging outlookGlobal markets begin the new week with a slightly more encouraging outlook, following Friday's recovery in equities and another decline in oil prices this morning.
The FTSE 100 gained more than 1% on Friday, the DAX rebounded and the S&P 500 recovered to finish the week higher. Gold has also continued its recovery towards $4,200. However, the underlying risks haven't disappeared. Government borrowing costs remain exceptionally high, geopolitical tensions continue to influence energy markets, an
The Hourly Swing Fakeout Pattern: What Really Matters?The hourly candle chart is a popular timeframe for shorter-term swing trading. It offers enough detail to identify changes in market structure while cutting out some of the noise of the lowest intraday timeframes.
One of the more recognisable swing trading patterns is a fakeout at an established support or resistance level. Price briefly breaks through a level, only to reverse back inside the previous structure. These patterns can be particularly interesting because they reveal an attempted mov
FTSE 100FTSE 100
The higher-timeframe structure remains decisively bearish, and the current setup is a continuation trade rather than an attempt to call a bottom.
On H4, price continues to respect a sequence of lower highs and lower lows. The recent recovery failed to reclaim the previous swing high and instead produced another rejection, keeping the broader market structure intact.
The Alligator reinforces that bias. The three lines are positioned in a bearish configuration, with price trading bene