ICNTUSDT - Long ICNTUSDT - Long Entry at the break of blue alligator line Long till 0-.2816 for double top formation. Entry:0.21300 SL: 0.2088 TP 1: 0.22173 TP 2: 0.22816Longby ahmadusman861
ICNT Preparing for a Bearish Move?Before anything else, you should know that this is a high-risk coin with strong volatility. Also, this analysis is based on a higher timeframe and requires patience to play out. In addition, entering or exiting a position should only be done after receiving proper triggers and confirmations. It appears that after the completion of the previous triangle, we now have an ABC structure on the chart, where wave A has already been completed. We are currently in wave B, which seems to be forming a symmetrical triangle. At the moment, price appears to be in wave I of this structure, which is considered a bearish wave. The expectation is that after a pullback into the red supply zone, price may continue moving toward the targets marked on the chart. The targets are clearly indicated on the chart. Make sure to move your stop loss to break-even once the first target is reached. A daily candle close above the invalidation level will invalidate this analysis. If you have a symbol you want analyzed, first hit the like button and then comment its name so I can review it for you. Do you also think ICNT is bearish?by behdarkUpdated 664
swing trade idea trade of the day...! #ICNT/USDT TRADE .. i am targeting @0.4318 minimiun @0.4662 max lets watch this Longby in_muhammad0
Don’t Miss This ICNT Setup! (12H)🚀 High-Probability Crypto Setup | Key Support, Bullish Structure & Liquidity Target | Low-Risk Long Opportunity Before anything else, it is important to understand that this asset is high-risk and highly volatile. Proper risk management and disciplined trading are essential when trading this market. On the lower part of the chart, we can clearly identify a strong Key Support Level that has been holding the price very well. This level has acted as a major demand zone where buyers consistently step in, preventing further downside and forming a solid base for potential upside continuation. On the lower timeframes, a Bullish Change of Character (CHoCH) has appeared on the chart. This is a very important structural signal, as it suggests that market momentum is shifting in favor of buyers. When a bullish CHoCH forms on lower timeframes, it often serves as an early warning that the higher timeframe structure may soon turn bullish as well. 📊 Liquidity & Market Structure Analysis At the upper part of the chart, there is a clear liquidity pool resting above recent highs. This area contains stop-loss orders and pending buy orders, making it a natural magnet for price. In many cases, the market tends to move toward these zones to sweep liquidity before continuing its main trend. Therefore, a move toward this area is highly possible in the near future. We also observe a strong and aggressive bearish drop on the chart. However, this move may have been a fake breakdown or liquidity grab, as the price quickly reversed to the upside. Since then, the market has been continuously clearing the highs of the spiky candles created during this seemingly fake dump. This behavior indicates strong buyer interest and absorption of selling pressure. 💡 Trading Plan – Entry, Targets & Risk Management We have defined a precise entry zone on the chart where traders can enter positions using a DCA (Dollar Cost Averaging) strategy. Scaling into the trade in this area helps reduce risk and improves the average entry price. ✅ Entry Strategy: Enter gradually within the marked zone using DCA Avoid full-size entries in one position Wait for confirmation when possible 🎯 Profit Targets: Two clear profit targets have been identified and marked on the chart. At Target 1 (TP1), secure partial profits After taking profit, move your stop-loss to Breakeven Let the remaining position run toward higher targets 🛡 Risk Management & Invalidation This setup offers a favorable risk-to-reward ratio due to the strong support zone, bullish structural signals, and liquidity-based targets. However, this bullish scenario will be invalidated if a daily candle closes below the invalidation level. Such a close would indicate weakness and potential trend continuation to the downside. ⚠️ Always respect your stop-loss and never risk more than you can afford to lose. 🔥 Final Thoughts This trading setup is based on: ✔ Strong Key Support Level ✔ Bullish CHoCH on lower timeframes ✔ Potential higher timeframe trend reversal ✔ Liquidity pool targets ✔ Fake breakdown and absorption ✔ Low-risk DCA entry zone If the price continues to respect the support zone and confirms bullish momentum, we may see a strong upside move toward higher liquidity levels and major resistance zones. If you would like us to analyze a coin or altcoin for you, first like this post, then comment the name of your altcoin below.by iMoneyTeamUpdated 444
ICNT/USDT — Clean Breakout From Long AccumulationExpansion Phase Begins December 18, 2025 ICNT has spent months building a well-defined base, compressing volatility and absorbing supply. Price is now breaking out of this range with increasing volume, signaling the start of a new expansion phase. Structurally, this is one of the cleanest setups ICNT has printed since its last major move. 🔍 Technical Overview Current price: ~$0.447 4EMA cluster: ~$0.33 / $0.28 / $0.25 → Price is clearly above all EMAs, confirming bullish momentum and trend continuation. Volume has expanded during the breakout, suggesting real participation, not a low-liquidity push. 📊 Market Structure Breakdown 1. Extended accumulation range (July → November) ICNT spent several months ranging between: Support: ~$0.18–0.20 Resistance: ~$0.42–0.44 This long period of sideways action allowed strong hands to accumulate while weak sellers were absorbed. 2. Failed breakdown & liquidity sweep (October) Price briefly swept below support: Triggered stop losses Absorbed sell-side liquidity Immediately reclaimed the range This was a classic bear trap, often seen before strong upside expansion. 3. Decisive breakout above range high Price has now reclaimed and held above: $0.42–0.44 (previous range high) This level is flipping from resistance into new structural support, a key signal that accumulation has ended. 🧱 Key Levels Major Support Zones $0.42–0.44 → critical flip zone $0.18–0.20 → base of the entire accumulation EMAs cluster ($0.25–0.33) → dynamic support on pullbacks As long as price holds above $0.42, the bullish structure remains intact. Resistance / Targets Ahead $0.55 → first expansion target $0.69 → major historical resistance These are logical zones where partial profit-taking or consolidation may occur. 🎯 Outlook ICNT is transitioning from accumulation to expansion, confirmed by: Higher highs and higher lows EMA support holding cleanly Volume expansion on breakout Bullish if: price holds above $0.42, and pullbacks remain shallow and controlled. If this structure holds, continuation toward $0.55 → $0.69 becomes increasingly likely. Bearish only if: price falls back below $0.42, which would invalidate the breakout and suggest further consolidation. good trading! Longby EdoardoTelveUpdated 5
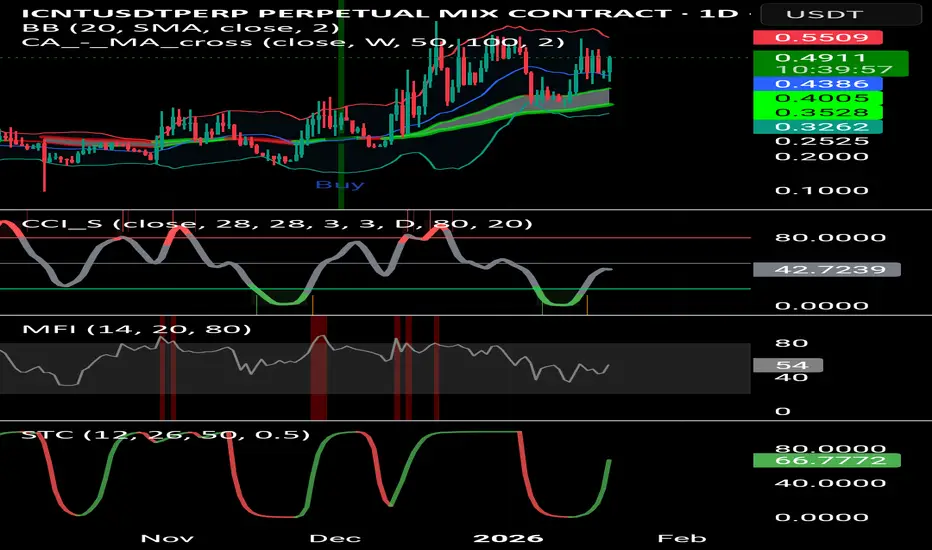
Trend: Sustained Bullish Momentum.Analysis: Price is holding steady above the BB baseline and MA clouds. While STC is in the upper zone, MFI and CCI show room for a secondary push. Outlook: Trend Following. Maintain long bias as long as it holds above the cloud.by Vortex99991
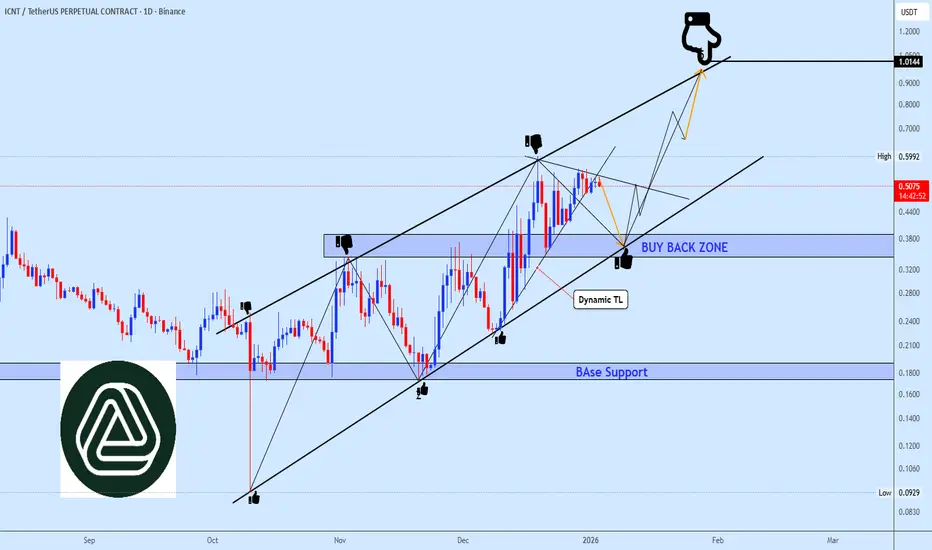
ICNTUSDT Buy-Back Zone in FocusICNTUSDT is currently trading within a well-defined ascending channel, maintaining its broader bullish structure. However, the recent breakdown below the immediate dynamic trendline signals shortterm weakness and opens the door for a corrective move toward the proposed buy-back zone. This demand area is technically significant and expected to act as a strong reaction zone. A successful hold and bullish response from this region would validate continuation within the ascending channel, with upside targets projected toward the $1 psychological and structural level. Price behavior around the buy-back zone will be critical for confirmation and risk management.Longby wesladUpdated 2213
ICNT: Market Makers’ Trap (12H)Over the past period, market makers have been pushing the price of ICNT upward in a low-volatility crypto market. This kind of controlled price expansion often happens when liquidity is being built quietly. However, at the moment, it appears that a bearish wave has started to form on this altcoin. Before jumping to conclusions, let’s take a closer look at what market makers are likely doing behind the scenes. Based on the structure we have marked on the chart, ICNT has entered the initial stage of a bullish phase from a higher-timeframe perspective. This move does not look impulsive or emotional; instead, it shows structured price behavior, which is usually a sign of professional participation. From a wave-structure standpoint, this bullish phase resembles a bullish Diagonal pattern. In this structure, Wave C appears to have already completed, and price action now suggests that Wave D is currently in progress. Wave D often comes with increased volatility, false breakdowns, and shakeouts designed to remove weak hands before the next directional move. To manage risk properly, we have identified two clear entry zones, where positions should be built using a DCA (Dollar-Cost Averaging) strategy, rather than entering all at once. This approach helps reduce emotional decision-making and improves average entry price during corrective moves. ⚠️ Invalidation rule: If a daily candle closes above the invalidation level, this analysis will be invalidated. Risk management comes first, and this condition must be respected. 🎯 Trade management: At Target 1, it is recommended to secure partial profits. After that, move the stop loss to breakeven (entry level) to protect capital and allow the trade to continue risk-free. As always, this setup is based on price structure, market behavior, and risk control, not prediction. Stay disciplined, manage risk, and let the market confirm the idea. If you have a coin or altcoin you want analyzed, first hit the like button and then comment its name so I can review it for you. This is not a trade setup, as it has no precise stop-loss, stop, or target. I do not publish my trade setups here.by behdark5
ICNT/USDT - Mega ExpansionICNT/USDT has been ranging for ~160 days, forming a well-defined high-timeframe accumulation box. Prolonged consolidation of this nature typically signals absorption by smart money and prepares the market for a high-momentum expansion phase. Price continues to respect both range highs and lows, confirming balance conditions. The longer the range, the stronger the eventual breakout.Longby Captain-MAO7
ICNT - Range Accumulation Before a Breakout MoveThe coin is currently in a clear accumulation range. Once the upper boundary is broken, the next target zone sits at $0.80–$1.00. If the lower boundary breaks instead, the price may head toward $0.095–$0.08. For now, it's important to wait for a breakout of either side of the range — this will likely determine the next strong directional move toward the respective targets.by ODYSSEY213
ICNT Analysis (12H)Considering the large liquidity pools that have been collected and the price reaching an origin of movement, the probability of a rejection from the supply zone is high. Since there is liquidity at the bottom of the chart as well, if the price breaks the demand zone, it may move toward the lower liquidity pools. However, if the demand zone holds as support, we could potentially see a new ATH. Let’s wait and see what happens Do not enter the position without capital management and stop setting Comment if you have any questions thank youby iMoneyTeamUpdated 330
ICNT Analysis (4H)It appears that a triangle is forming. We are currently completing wave D of this triangle — in fact, we are in the middle of wave D. To complete wave D, the price may make deeper drops. The best area for entering a sell/short position is the red zone. If the price reaches this zone, we can open a sell/short position. The targets are marked on the chart. A daily candle closing below the invalidation level will invalidate this analysis. For risk management, please don't forget stop loss and capital management When we reach the first target, save some profit and then change the stop to entry Comment if you have any questions Thank YouShortby behdark0
ICNTUSDT 1D#ICNT is moving inside a descending triangle pattern on the daily chart. Consider buying here and near the support levels at: $0.2744 $0.2371 In case of a breakout above the triangle resistance, the potential targets are: 🎯 $0.3777 🎯 $0.4324 🎯 $0.5019 🎯 $0.5382 🎯 $0.5904 ⚠️ Always use a tight stop-loss and apply proper risk management.by DigitalChartist5
ICNTUSDT 1D#ICNT has broken above the descending channel on the daily chart. RSI is showing possible bullish movement from here. In case of a successful retest of the channel, the potential targets are: 🎯 $0.2744 🎯 $0.3046 🎯 $0.3348 🎯 $0.3777 🎯 $0.4324 ⚠️ Always remember to use a tight stop-loss and follow proper risk management.by DigitalChartist4
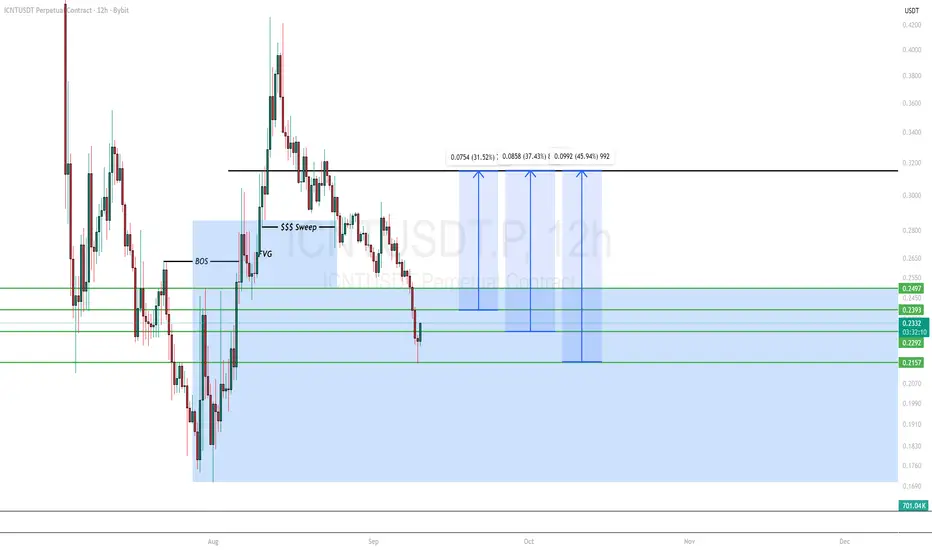
ICNTUSDT Trading Idea.Likely a reversal to the upside from 0.2393, 0.2292 or 0.2157 provided the weekly order block is not mitigated. The preferred position should be a long position.Longby RoyalExcellenceUpdated 336
ICNT PERPETUAL TRADE , Short from $0.3640ICNT PERPETUAL TRADE SELL SETUP Short from $0.3640 Currently $0.3640 Stop loss $0.60 Targeting $0.32 or Down (Trading plan ICNT go up to $0.40 will add more shorts) Follow the notes for updates In the event of an early exit, this analysis will be updated. Its not a Financial adviceShortby salahuddin20041Updated 662
$ICNT/USDT 3x BreakoutGETTEX:ICNT just broke out of a falling wedge on the 6H chart, a bullish pattern we’ve been watching closely. The breakout happened right from a strong support zone, which adds confidence. If momentum holds, we could be looking at a move toward $1 that’s over 3x from here. Worth keeping an eye on for sure. DYOR, NFA Longby stanleycrypto_18
ICNT/USDT>break resistanceICNT/USDT finally managed to break the key 0.29 resistance today after multiple attempts, confirming strength in the current uptrend. Following the breakout, price surged quickly to 0.33, showing strong bullish momentum and clear buyer dominance. Now, price is retesting the breakout zone, turning previous resistance into a potential new support. This healthy retest phase offers a solid opportunity to build a position (DCA) If the support around 0.27–0.255 holds, ICNT could be gearing up for the next leg toward the 0.37–0.41 zone.Longby Captain-MAO8

 Long
Long