Internet Computer/USD Tether Spot
No trades
No trades
In-depth trading ideas
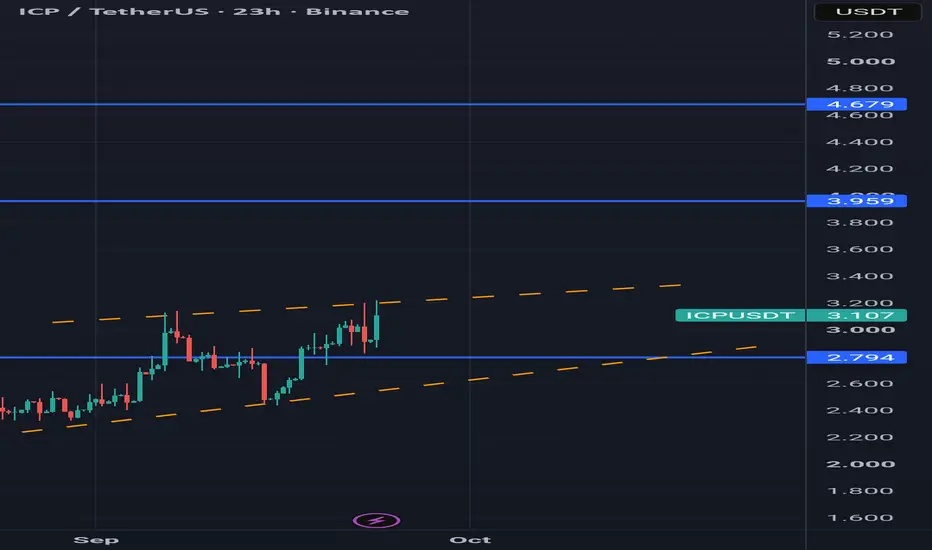
#ICPUSDT A Major Triangle Breakout Could Trigger aToward $3.09 #ICP
ICP has been trading on the daily timeframe for nearly a year, forming a series of triangle patterns. These patterns can signal potential trend reversals, particularly when they develop near strong support zones.
This is exactly the setup we are observing now. The price is approaching the completion of a triangle pattern while holding above a major support zone around $2.00. A breakout above the triangle's upper boundary could trigger a bullish move, with the next potential target at $3.0
ICP/USDT: Volatility Narrows as Price Holds Inside a Tight RangeOn the Binance four-hour chart, Internet Computer (ICP/USDT) has transitioned from a sustained October decline into an active volatility compression phase. Following a steady sequence of lower swings within descending volatility bands, selling momentum has decelerated and the outer variability bands have narrowed markedly. At the latest closed four-hour candle, price action locked into a tight horizontal range, while subsequent live trading continues to oscillate near the middle of that corridor
ICP/USDT: Key Support Holds the Potential for a Recovery Toward ICP is approaching a critical support zone between $2.83 and $2.90, where horizontal support aligns with the rising trendline on the 4H chart.
If buyers defend this area and bullish momentum strengthens, the price could recover toward the following resistance levels:
• $3.20
• $3.28
• $3.45 - $3.47
The RSI is showing signs of recovery, but further confirmation is needed before expecting a stronger upward move.
A breakdown below $2.83 could invalidate this bullish scenario and expose ICP to f
#ICP Crypto alt ICP (Internet Computer) | A Potential 2,000% Opportunity? 🚀
📈 Weekly Timeframe | Long-Term Bullish Scenario
ICP is approaching a potentially important phase in its long-term market structure.
On the weekly timeframe, ICP is still trading within a major descending trendline. A confirmed breakout above this trendline could signal a significant shift in market structure and potentially open the door to a new bullish cycle.
I’m watching the $2.50 zone as a potential entry area for a long-term po
ICP Long-Term Downtrend Under Pressure, Breakout Incoming?📊 Technical Analysis — Internet Computer CRYPTOCAP:ICP
⏳ Time Frame: 1W (Weekly)
💰 Current Price: Around $3.318
---
🔎 MARKET STRUCTURE
📉 ICP remains within a long-term bearish structure, as indicated by the descending trendline that has developed from the previous major high.
🔻 The yellow trendline acts as a major dynamic resistance, limiting price movement for several years.
📌 However, price is now approaching this trendline again. This is important because a breakout on the Weekly timef
$ICP WILL reach 18$ ??CRYPTOCAP:ICP is finally making an interesting move on the 2W chart.
The long-term downtrend line has been pushed above, which is a big technical development after almost 2 years of lower highs.
But I’m not calling it a confirmed breakout yet. 👀
The current 2W candle is still open. What I want to see is a strong candle close above the trendline and then hold that area as support.
If ICP can close and hold above the broken trendline, the higher resistance levels on the chart become the next ar
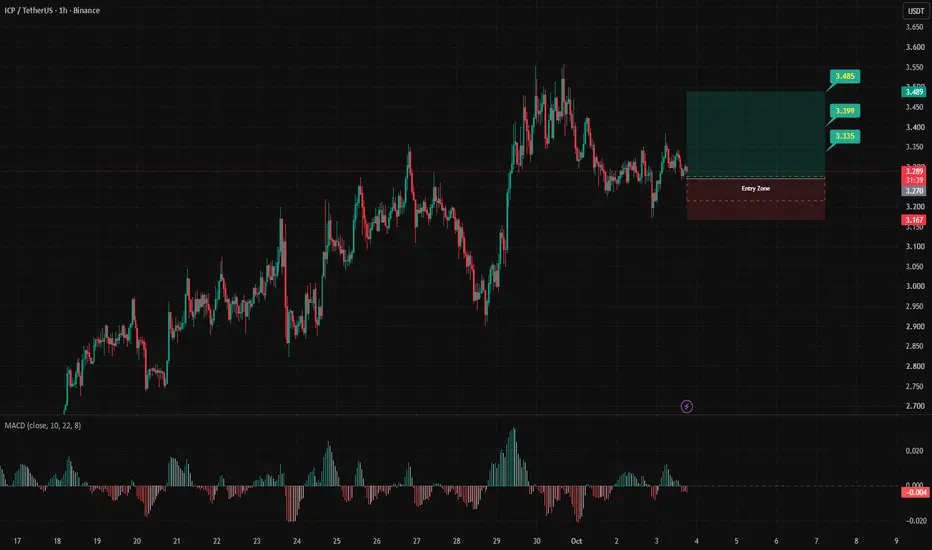
ICP ForecastBINANCE:ICPUSDT The reason behind our entry zone is that the overall trend is bullish, while on the lower timeframe we’re seeing a corrective move. The final bearish leg has formed a clear wedge, so we can expect a potential start of the next upward move.
Keep in mind that this is a limit set up. It’s better to let price come into our entry zone — meaning we want to see a little more downside and a deeper correction before entering.
⚠️ Risk Disclaimer
This is just our market view, not financi
$ICP Breaks Multi-Year Trendline, Is $80 Next? CRYPTOCAP:ICP Price Prediction: Internet Computer Breaks Multi-Year Trendline, Is $80 Next? 🚀
CRYPTOCAP:ICP IS WAKING UP: Crashed from a $250 ATH to a brutal -99% wipeout… and now the ICP comeback has officially started.
✅ #ICP up 75%+ from our High Risk Accumulation Zone
✅ Multi-year Trendline Resistance BROKEN on the weekly chart
Next key level for the ICP Breakout: Flip $4.092 and HOLD Above = Super Bullish. That's where the real ICP rally begins.
Macro Targets: $7.50 → $15 → $35 → $80
ICPUSDT – Bullish SetupBullish bias identified on the 1H timeframe, using Heikin Ashi candles to better visualize trend direction and momentum by filtering out some of the market noise.
Entry was refined on the 5M timeframe, waiting for a pullback/retest into the Alligator lip, followed by bullish candle confirmation.
EP: 3.327
SL: 3.229
TP Alert: 3.427
Published on the 1H chart due to TradingView publication timeframe restrictions; actual execution was taken on the 5M.
#ICP MULTI-YEAR DOWNTREND ENDING SOON! PAY CLOSE ATTENTION!🔥 #ICP Multi-Year Descending Trendline Breakout – 200%+ Reversal Potential Loading! 🚀📈
CRYPTOCAP:ICP (Internet Computer/USDT) is approaching the apex of a massive multi-year descending trendline on the 1W chart! Price is consolidating near key historical demand around $3.00, building momentum for a potential macro trend shift.
A clean weekly candle close breaking above the yellow diagonal trendline resistance could trigger an explosive trend reversal back toward major horizontal resistance n
ICP – Bulls Are Now in ControlICP has undergone an important shift in market structure, with momentum moving from bearish to bullish.
After breaking above the previous structure and ending the bearish sequence, price has started forming a clear rising trendline, marked in blue.
From here, our plan is straightforward.
As long as the green demand zone and the rising blue trendline continue to hold, we will be looking for trend-following long setups during bearish corrections.
The bullish structure remains valid until these
ICP/USDT (1h) Testing the Upper Boundary of a Rising WedgeICP/USDT is trading inside a rising wedge on the 1H chart, with price continuing to form higher lows while the upper trendline rises more gradually. The structure has been developing after the sharp recovery from the $2.84–$2.90 area, and price is now moving toward the upper boundary around $3.25–$3.30.
A confirmed breakout and hold above the upper trendline could trigger a bullish expansion toward the $3.60–$3.62 measured target area.
However, because a rising wedge can also act as a bearish re
ICP 4H – Extending Uptrend Toward Fresh HighsInternet Computer is trading around 3.121 on the 4H timeframe after a strong push to a fresh high near 3.250, continuing an uptrend that has been building steadily off the ascending trendline from the early August low near 1.95.
The structure here shows a consistent series of higher highs and higher lows since the start of August, with the rising trendline holding through every meaningful pullback along the way. Price broke through the 3.00 level in early September, spiking to a local high near
ICP: Screenshot This. Come Back Later.If you followed my QNT post, you already know why I don't share setups like that casually.
ICP is approaching that same level of quality.
Right now, price is developing within a Model 2 accumulation schematic, with $1.810 being the level that invalidates that specific Model 2 structure.
But here's the part I'm watching closely:
If price trades deeper and transitions from Model 2 → Model 1, I would consider the resulting accumulation significantly stronger within my framework.
And I'm no