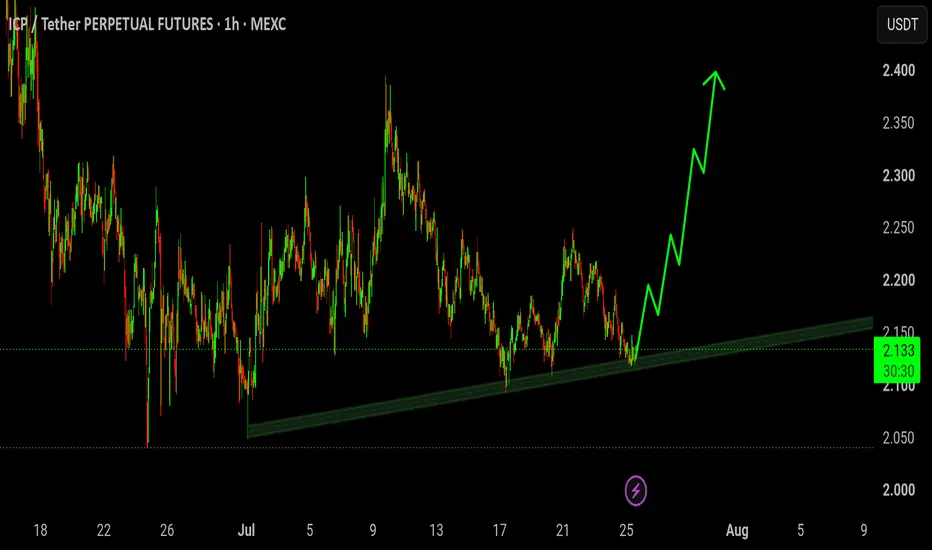
#ICP Possible Scenario The ICP/USDT 1-hour chart on MEXC is currently trading at 2.135 USDT, showing a clear ascending trendline structure that has been respected since late June. Price has formed a series of higher lows along this rising support, with the most recent bounce occurring near the 2.10 zone around July 25, indicating sustained buying interest at progressively higher levels.
In-depth trading ideas
ICP USDT LONG SIGNAL#98 ICP/USDT – Trade Setup (LONG)
📈 Position Type: LONG
🕒 Timeframe: 1H
📊 Market: Futures
💰 Entry Zone:
2.185
2.140
🛑 Stop-Loss:
2.099
🎯 Take-Profit Targets:
• TP1: 2.223
• TP2: 2.280
• TP3: 2.350
• TP4: 2.434
⚙️ Leverage:
5 *10
▫️ After TP1, move SL to Entry + 0.2%.
▪️ Exit Plan:
• 40% at TP1
• 20% at TP2
• 20% at TP3
20% at. TP4
📌 Risk Management:
Risk only 1–2% of your capital per trade.
⚠️ Always check and confirm the setup on your chart before entering the trade.
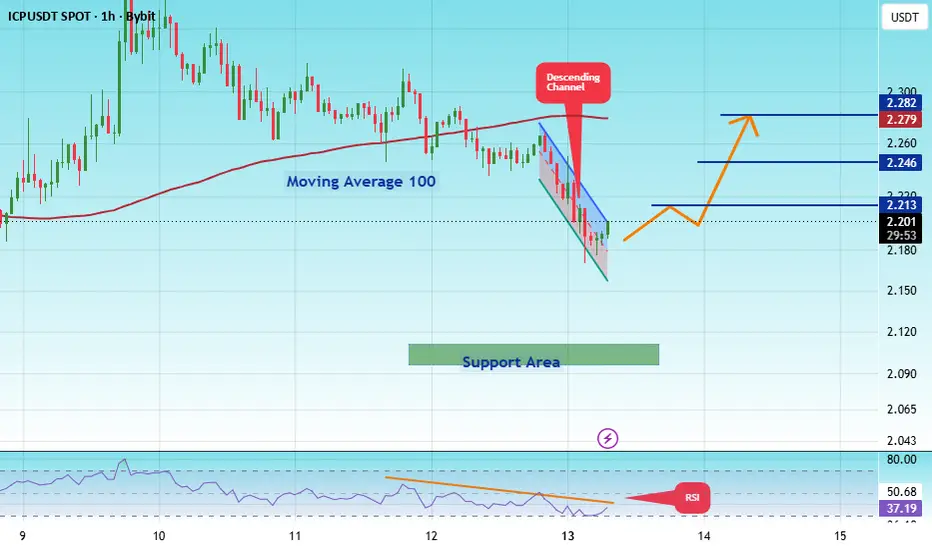
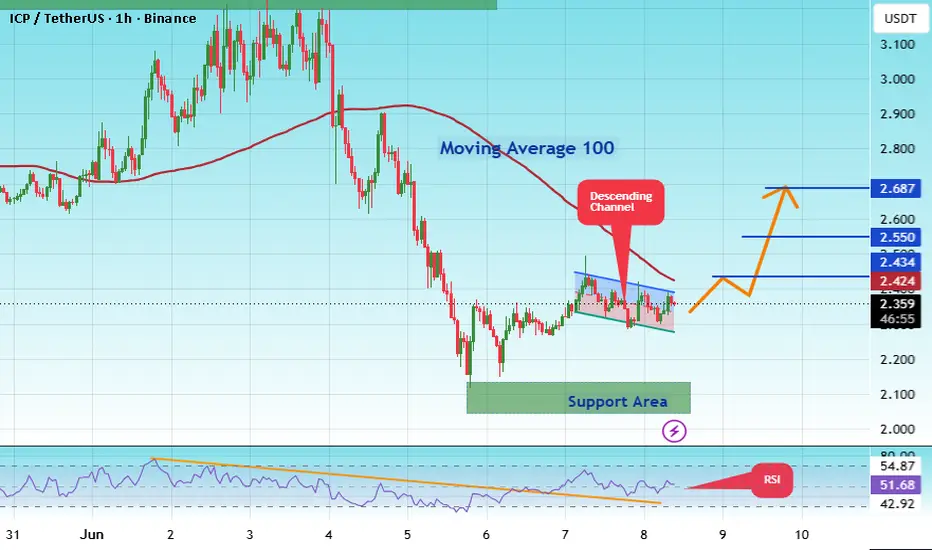
#ICPUSDT The price is moving in a descending channel#ICP
The price is moving within a descending channel on the 1-hour timeframe and has reached the lower boundary. It is now poised for a bounce and is expected to retest this boundary.
The Relative Strength Index (RSI) indicates a downward trend, which is likely to continue given the overbought conditions.
There is a key support zone (in green) at 2.05, and the price has bounced off this zone several times, making it a strong support level.
The price is trending towards the 100-period moving average, which we are approaching. This trend supports an upward move.
Entry Price: 2.13
First Target: 2.19
Second Target: 2.23
Third Target: 2.30
Stop Loss: At the resistance zone (in green)
Remember this simple rule: Money Management.
Any questions? Please leave a comment.
Thank you.
#ICPUSDT The price is moving in a descending channel#ICP
The price is moving within a descending channel on the 1-hour timeframe and has reached the lower boundary. It is now poised for a bounce and is expected to retest this boundary.
The Relative Strength Index (RSI) indicates a downward trend, which is likely to continue given the overbought conditions.
There is a key support zone (in green) at 2.00. The price has bounced off this zone several times, making it a strong support level.
The price is trending towards the 100-period moving average, which we are approaching. This trend supports an upward move.
Entry Price: 2.18
Target 1: 2.21
Target 2: 2.24
Target 3: 2.28
Stop Loss: At the resistance zone (in green)
Remember this simple rule: Money Management.
Any questions? Please leave a comment.
Thank you.
ICP USDT LONG SIGNAL#51. ICP/USDT – Trade Setup (LONG)
📈 Position Type: LONG
🕒 Timeframe: 1 H
📊 Market: Futures
💰 Entry Zone:
2.191
🛑 Stop-Loss:
2.110
🎯 Take-Profit Targets:
• TP1: 2.236
• TP2: 2.292
• TP3: 2.343
• TP4: 2.391
TP5: 2.434
TP6:
⚙️ Leverage:
5- 10
⚠️ After reaching TP1, move Stop-Loss to Entry Price.
📌 Risk Management:
Risk only 1–2% of your capital per trade.
Always confirm the setup on your chart before entry
$ICP is trading around $2.35, and the most important level......BINANCE:ICPUSDT is trading around $2.35, and the most important level isn't $2.40—it's the $2.30 mitigation block.
Most traders will wait for confirmation. The chart is already providing it.
📰 24H NEWS SNAPSHOT
There has been no major ICP-specific news or on-chain catalyst in the past 24 hours. Current momentum appears to be driven primarily by technical structure rather than fundamentals.
Follow @dfinity for official ecosystem updates and development announcements.
📊 MARKET BIAS
🟢 Bullish — Recent breakout above prior consolidation followed by a textbook mitigation into previous demand.
🎯 TRADE LEVELS
📍 Entry Zone: $2.300 – $2.263
🛑 Stop Loss: $2.249
Risk: -2.22% (from $2.300)
Consider risking 1% or less of total portfolio capital.
🎯 TP1: $2.400
+4.35%
1.96:1 RR
🎯 TP2: $2.549
+10.83%
4.88:1 RR
🎯 TP3: Trail above $2.549 if momentum continues and 4H candles close above resistance.
📐 Overall R:R: ≈4.9:1
🧠 CHART ANALYSIS
The chart shows a strong bullish impulse followed by a pullback into a clearly marked buy-side mitigation block around $2.300–$2.263.
This area previously acted as resistance before turning into support, creating a favorable high-probability retest.
As long as $2.249 holds, the market structure remains bullish. A clean rejection from the mitigation block could trigger another expansion toward $2.40 and eventually $2.549.
A decisive 4H close below $2.249 invalidates the setup.
🛡️ RISK MANAGEMENT TIP
Don't enter the full position immediately. Scale into the mitigation zone and only increase exposure after bullish confirmation. Avoid excessive leverage on a 4H setup.
📚 EDUCATIONAL NUGGET
Many traders chase breakout candles, but experienced traders often wait for the mitigation or retest. Entering after liquidity returns to demand usually improves your risk-to-reward instead of buying emotional momentum.
Remember the opening?
The level that matters isn't the breakout—it's the $2.30 mitigation block.
The chart already showed where institutional buyers could be waiting.
💬 Would you buy the mitigation or wait for a breakout above $2.40? Let me know below.
#ICP #InternetComputer #CryptoTrading #TechnicalAnalysis #CryptoSignals #PriceAction #Altcoins #Crypto
Swing Trade for #ICP/USDT | 12H TFSwing Trade for #ICP/USDT | 12H TF
ICP/USDT is trading inside a long-term Falling wedge and is currently testing the lower support trendline. Price is showing signs of accumulation near a high-volume demand zone, while selling pressure continues to weaken. A breakout above the descending resistance could trigger a strong bullish move.
Fundamental: Internet Computer (ICP) is a decentralized blockchain developed to power scalable Web3 applications and smart contracts directly on-chain.
Entry: 2.220 – 2.20
Target 1: 2.254
Target 2: 2.277
Target 3: 2.310
Target 4: 2.332
Mid-Term Holding: 2.440
Risk Management
Book partial profits at each target.
After TP1, move SL to Entry.
After TP2, move SL to TP1.
SL: 1.940
ICP at macro floor: base recovery toward $2.70The Macro Picture 🗺️
ICP fully unwound its May $4 blow-off, sliding through a series of lower highs before the market finally found a floor. The June flush to $2.10 marked a structural reset — the kind of deep correction that shakes out the last of the over-leveraged longs and builds the base for the next leg. Since then, price has coiled in a tight $2.10–2.40 accumulation range, and the current push to $2.35 with RSI reclaiming the midline near 55 suggests buyers are stepping back in. This is the quiet part of the cycle where positions get built before the move.
The Setup ⚙️
The Buy Area: The $2.10–2.20 band has absorbed every sell-off since the flush. Bulls are defending this floor, and as marked on the chart, price is pressing up and away from it with momentum turning.
The Accumulation Zone: A deeper flush toward $2.10 opens a textbook pocket for staggered, averaging-based entries — the structural reset makes this a high-confluence zone to build a position rather than chase.
The Ceiling: The $2.45 decision line is the first hurdle. A clean reclaim flips the local structure bullish and opens the path toward the $2.70 macro resistance above.
The Roadmap: Primary target sits at $2.70 — the green roadmap points there as price works up from the base toward the range ceiling. Invalidation: a clean daily close below $2.10 would invalidate this bullish thesis and signal the base has failed.
More setups in profile.
#ICP #CRYPTO #InternetComputer #Altcoins #TechnicalAnalysis
Internet Computer ICP price analysis Unexpectedly, our community asked us to take a look at CRYPTOCAP:ICP
So let's break it down.
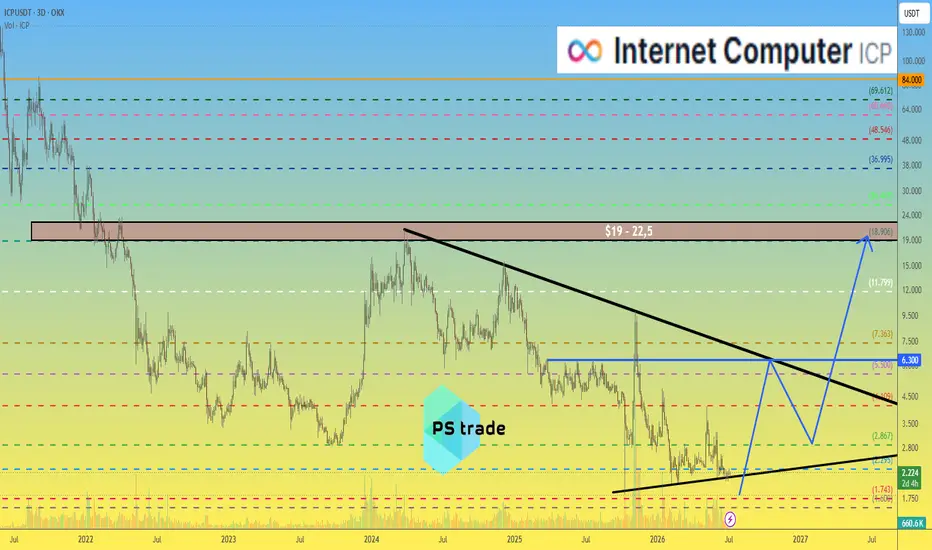
At the time of writing, #InternetComputer has a market capitalization of roughly $1.2B, with #ICP trading around $2.20.
That's exactly why we think it's important to stay realistic.
Dreaming about $80 is already quite ambitious.
Talking about $500–700... probably isn't great for your mental health 😱
📊 Looking at the chart objectively, our base scenario is much more conservative.
If everything goes well, OKX:ICPUSDT could eventually revisit the $19–22.5 area.
That would still be an exceptional return from current levels.
But the road there is unlikely to be fast or easy.
👀 One more thing caught our attention.
For almost a month, CRYPTOCAP:ICP has been trading inside an unusually tight range between $2.10 and $2.30.
Long consolidations often end with sharp moves.
And we can't rule out one final liquidity sweep toward $1.60 before a larger recovery begins.
That's also where the risk-to-reward ratio starts looking much more attractive.
📌 So our approach is simple:
👉 If you're planning to build a long-term position, placing buy orders closer to $1.60 may offer a better opportunity.
👉 If you're already holding CRYPTOCAP:ICP ...
Well... patience has always been one of the most valuable skills in crypto. 😄
💬 What do you think — is Internet Computer still one of the market's most undervalued projects, or has the market already priced in its long-term potential?
______________
◆ Follow us ❤️ for daily crypto insights & updates!
🚀 Don’t miss out on important market moves
🧠 DYOR | This is not financial advice, just thinking out loud
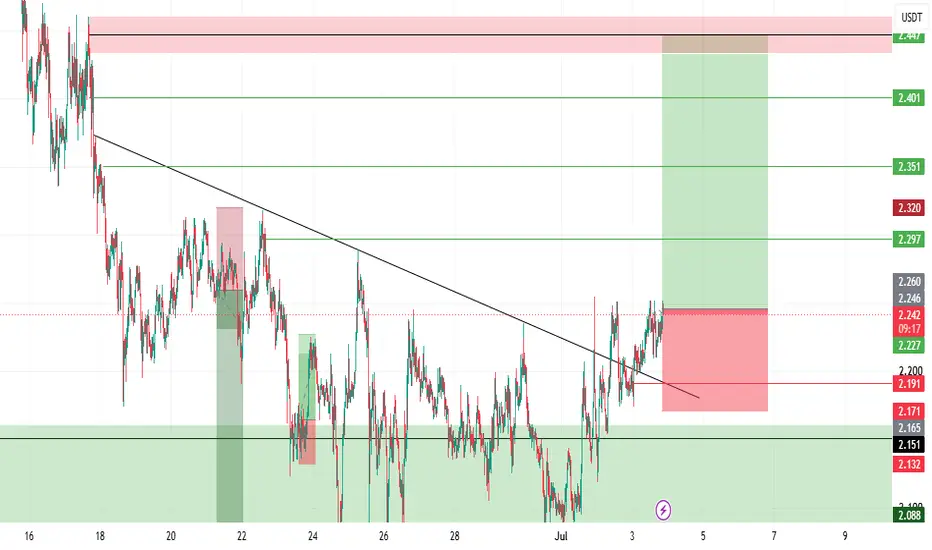
ICP USDT LONG SIGNAL#3
ICP/USDT – Trade Setup (LONG)
📈 Position Type: LONG
🕒 Timeframe: 1 H
📊 Market: Futures
💰 Entry Zone:
Market
2.190
🛑 Stop-Loss:
2.170
🎯 Take-Profit Targets:
• TP1: 2.297
• TP2: 2.350
• TP3: 2.400
• TP4: 2.447
TP5:
TP6:
⚙️ Leverage:
5- 10
⚠️ After reaching TP1, move Stop-Loss to Entry Price.
📌 Risk Management:
Risk only 1–2% of your capital per trade.
Always confirm the setup on your chart before entry
#ICPUSDT The price is moving in a descending channel#ICP
The price is moving within a descending channel on the 1-hour timeframe and has reached the lower boundary. It is now poised for a bounce and is expected to retest this boundary.
The Relative Strength Index (RSI) indicates a downward trend, which is likely to continue given the overbought conditions.
There is a key support zone (in green) at 1.96, and the price has bounced off this zone several times, making it a strong support level.
The price is trending towards the 100-period moving average, which we are approaching. This trend supports an upward move.
Entry Price: 2.13
First Target: 2.18
Second Target: 2.21
Third Target: 2.26
Stop Loss: At the resistance zone (in green)
Remember this simple rule: Money Management.
Any questions? Please leave a comment.
Thank you.
ICP 8H – Descending Trendline Pressing Into Horizontal SupportICP on the 8H timeframe is currently trading around 2.401 after a sustained decline from the early June high near 3.200, with price now compressing between a descending trendline from above and a key horizontal support level near 2.150–2.200.
The chart shows price spiking from the late April range near 2.300–2.400 up to a high near 3.900 in early May before sellers took over and erased the majority of that move. A recovery attempt in late May pushed price back toward 3.200 before rolling over sharply again in early June, dropping into the 2.150–2.200 horizontal support zone that has acted as a floor across the entire visible structure. A descending trendline originates from the May spike high and has capped every recovery since, currently sloping down into the 2.300–2.350 area. Price has been grinding lower along this trendline while sitting just above the horizontal support, creating a compression zone between the two.
Price is now pressing directly into the 2.150–2.200 horizontal support for the second time while the descending trendline continues to push from above, leaving very little room before one of the two levels breaks.
Key Levels To Watch
→ 3.800–3.900 – May spike high, major resistance above
→ 3.100–3.200 – Prior recovery high, resistance
→ 2.650–2.700 – Mid-structure resistance zone
→ 2.300–2.350 – Descending trendline, current overhead resistance (dynamic)
→ 2.150–2.200 – Horizontal support, current test
→ 2.000–2.050 – Next support below, round number zone
→ Below 1.920 – Extended breakdown territory
A hold at the 2.150–2.200 horizontal support and a break above the descending trendline near 2.300–2.350 would signal a structural shift, opening a recovery toward 2.650–2.700 and potentially back toward the 3.100–3.200 resistance on a full trend reversal.
A loss of the 2.150–2.200 horizontal support on a confirmed 8H close would remove the only remaining floor in the structure, exposing price to a move toward 2.000–2.050 and below with the descending trendline continuing to suppress any recovery attempts from above.
Price compressed between descending trendline and horizontal support, decision point near.
Hold 2.150–2.200 and break trendline → recovery opens toward 2.650–2.700. Lose 2.150 → floor gone, downside toward 2.000–2.050. Bias neutral to bearish inside compression. Shift bullish only on confirmed trendline break to the upside.
ICPUSDT Testing a Key Reaction ZoneICPUSDT is currently interacting with an important reaction zone identified from recent market structure.
Key observations:
• Price is approaching a significant area of interest
• Reaction from this zone could determine the next short-term move
• Confirmation is required before any directional bias
Possible scenarios:
1. Strong rejection from the zone
2. Breakout and continuation
This analysis is shared for educational purposes only.
Not financial advice.
Follow for more market analysis.
ICP USDT SHORT SIGNAL ENA/USDT – Trade Setup (SHORT)
📈 Position Type: SHORT
🕒 Timeframe: 15M
📊 Market: Futures
💰 Entry Zone:
0.090
0.09176
🛑 Stop-Loss:
0.0931
🎯 Take-Profit Targets:
• TP1: 0.08832
• TP2: 0.08610
• TP3: 0.08368
• TP4: 0.08119
TP5: 0.07749
⚙️ Leverage:
5–10
⚠️ After reaching TP1, move Stop-Loss to Entry Price.
📌 Risk Management:
Risk only 1–2% of your capital per trade.
Always confirm the setup on your chart before entry
#ICPUSDT The price is moving in a descending channel#ICP
The price is moving within a descending channel on the 1-hour timeframe and has reached the lower boundary. It is now poised for a bounce and is expected to retest this boundary.
The Relative Strength Index (RSI) indicates a downward trend, which is likely to continue given the overbought conditions.
A key support zone (in green) has been identified at 1.94. The price has bounced off this zone several times, making it a strong support level.
The price is trending towards the 100-period moving average, which we are approaching. This trend supports an upward move.
Entry Price: 2.25
First Target: 2.38
Second Target: 2.50
Third Target: 2.70
You can close at the second target or wait for the third target to be reached. The choice is yours.
Stop Loss: At the resistance zone (in green).
Remember this simple rule: Money Management.
Any questions? Please leave a comment.
Thank you.
#ICPUSDT The price is moving in a descending channel#ICP
The price is moving within a descending channel on the 1-hour timeframe and has reached the lower boundary. It is now poised for a bounce and is expected to retest this boundary.
The Relative Strength Index (RSI) indicates a downward trend, which is likely to continue given the overbought conditions.
There is a key support zone (in green) at 2.05, and the price has bounced off this zone several times, making it a strong support level.
The price is trending towards the 100-period moving average, which we are approaching. This trend supports an upward move.
Entry Price: 2.35
Target 1: 2.43
Target 2: 2.55
Target 3: 2.68
Stop Loss: At the resistance zone (in green)
Remember this simple rule: Money Management.
Any questions? Please leave a comment.
Thank you.
ICPUSDT 1D#ICP continues to trade within a compression structure, holding above a key demand zone while remaining capped by a long-term descending trendline.
The $2.087–$2.278 area has acted as strong support multiple times, making it a critical level to watch. As long as price holds above this zone, a breakout attempt toward the descending resistance remains possible.
However, the broader trend remains bearish until buyers reclaim the trendline and establish acceptance above the $3.20–$3.30 region.
📈Bullish targets:
🎯 $2.710
🎯 $3.141
🎯 $3.489
🎯 $3.837
🎯 $4.333
🎯 $4.964
📉Bearish targets (if support fails): $1.884 → $1.538
Bias: Neutral while inside the range, bullish on breakout, bearish on support loss.
⚠️ Always remember to use a tight stop-loss and maintain proper risk management.
ICP USDT LONG SIGNALICP /USDT – Trade Setup (long)
📈 Position Type: LONG
🕒 Timeframe: 15M
📊 Market: Futures
💰 Entry Zone:
2.316
2.280
🛑 Stop-Loss:
2.249
🎯 Take-Profit Targets:
• TP1: 2.420
• TP2: 2.498
• TP3: 2.60
• TP4:
. TP5:
⚙️ Leverage:
5–10
⚠️ After reaching TP1, move Stop-Loss to Entry Price.
📌 Risk Management:
Risk only 1–2% of your capital per trade.
Always confirm the setup on your chart before entry.
$ICP Holding Major HTF Demand While Compression Continues FWB:ICP Holding Major HTF Demand While Compression Continues 👀
ICP continues stabilizing inside the major 2.49–2.54 HTF discount zone after weeks of aggressive downside pressure. Price is no longer expanding lower aggressively, while repeated reactions from demand suggest buyers are slowly absorbing liquidity near current levels. The overall structure now looks more like accumulation than clean bearish continuation.
The chart also shows ICP compressing beneath descending HTF resistance while building a higher low base inside demand. If buyers reclaim structure properly above current resistance, the next liquidity zones sit around 2.77, 3.01, and potentially 3.26 over time. Momentum is still early, but downside pressure has clearly weakened compared to previous selloffs.
For now, patience still matters. The safer long setup comes after another liquidity sweep into discount followed by bullish reclaim and stronger displacement confirmation from support.
Analysis by Leo524.
#ICP #ICPUSDT #Crypto #Bitcoin #Altcoins #Trading #Leo524
ICP Main Trend 10 2025Logarithm. Timeframe: 1 week. I'm updating my previous trading idea for the primary and secondary trends (it achieved its goals with pinpoint accuracy), published 2.5 years ago.
A patient and consistent person will be rewarded, while a restless person will not.
Locally, this reversal zone is after a futures long takeout:
Low-liquidity instruments and huge leverage (targeted by the main information traffic of "easy money" lures) are incompatible... logically... But, it's profitable for exchanges to create such futures trading instruments, as people will leave their money there. There's no real supply or demand, and exchange algorithms completely control the price (volatility), which is why "traders" are doomed.
That's why we've recently seen cascading collapses in futures liquidity and mass liquidations, which have been reflected in the spot market. Spike prices on many instruments reached -40-80%, practically in a completely empty order book.
It's quite easy to direct the price to such a massive liquidation up or down on a large exchange by manipulating the entire trading volume, given low supply and demand. However, this is impossible (considered blatant manipulation) on a single instrument, and there will be many questions and lawsuits. But if this is done on hundreds of cryptocurrencies simultaneously and across all exchanges, under a correspondingly negative news backdrop, everything is fine; it's the market and the negative news.
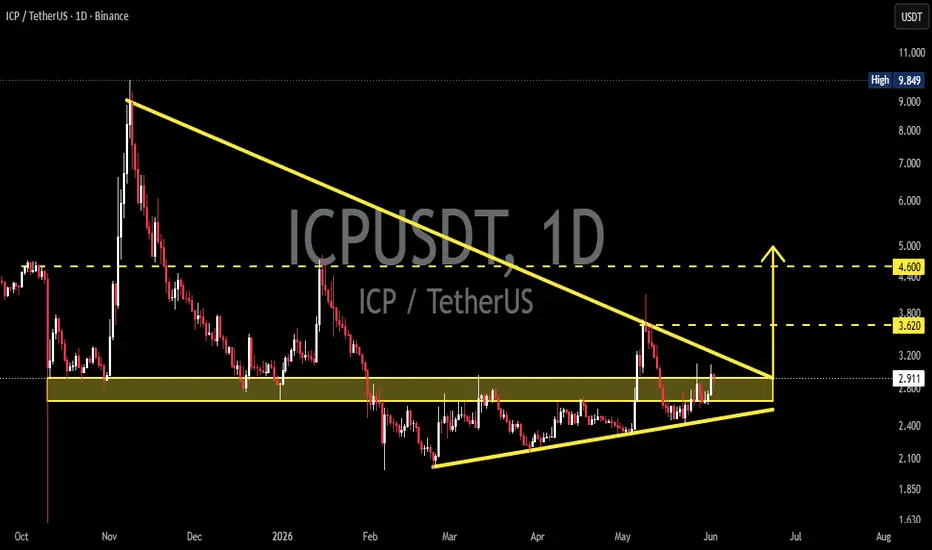
ICPUSDT - Critical Point: Major Accumulation or Final Breakdown?The ICPUSDT chart is currently showing a very interesting structure after experiencing a prolonged downtrend since its November 2025 peak. Price is now moving within an Ascending Support and Descending Resistance structure, creating a compression zone as it approaches the apex point. 📐
In addition, there is a strong demand zone (yellow block) between 2.60 – 2.90 USDT 🟨, which has repeatedly acted as a key support area over the past several months. Every time price enters this zone, buying pressure reappears and prevents deeper declines.
At the moment, price is testing a long-term descending resistance trendline that has capped price action for months. The closer price gets to the intersection of these two trendlines, the greater the probability of an explosive move. ⚡
---
🔍 Pattern Formation
📐 1. Descending Resistance Trendline
The descending trendline that started from the peak around $9.80 remains the primary resistance.
Pattern Characteristics:
✅ Lower Highs have continued to form since November 2025.
✅ Indicates that long-term selling pressure is still present.
✅ A valid breakout would require price to break and close above this trendline.
---
📈 2. Ascending Support Trendline
On the lower side, support has been steadily rising since February 2026.
Characteristics:
✅ Higher Lows continue to form.
✅ Suggests buyers are gradually accumulating positions.
✅ Indicates an ongoing accumulation phase.
---
🔺 3. Large Symmetrical Triangle
The combination of both trendlines creates a Symmetrical Triangle pattern.
Pattern Characteristics:
🔹 Volatility continues to decrease.
🔹 Price is moving toward the apex.
🔹 Typically followed by a significant breakout after an extended consolidation phase.
🔹 Volume often declines during the formation and expands during the breakout.
🔹 The longer the pattern develops, the larger the potential move after the breakout.
---
🟢 Bullish Scenario
A bullish confirmation would occur if price:
✅ Holds above the 2.60 – 2.90 USDT demand zone.
✅ Breaks above the descending resistance trendline.
✅ Achieves a daily close above the 3.20 – 3.30 USDT area.
🎯 Bullish Targets
🥇 Target 1: 3.62 USDT
A nearby horizontal resistance level that previously acted as a rejection area.
🥈 Target 2: 4.60 USDT
The next major resistance level and the primary breakout target of the triangle pattern.
🥉 Target 3 (Aggressive): 5.00+ USDT
If bullish momentum strengthens significantly, price could continue its recovery toward the psychological $5.00 area and beyond.
📈 Bullish Supporting Factors
✔️ Strong demand zone remains intact.
✔️ Higher Lows continue to develop.
✔️ Selling pressure appears to be weakening.
✔️ Compression structures often precede large price movements.
✔️ Risk-to-reward is becoming increasingly attractive for medium-term buyers.
---
🔴 Bearish Scenario
A bearish scenario becomes active if:
❌ Price fails to break the resistance trendline.
❌ Strong rejection occurs near the upper trendline.
❌ The 2.60 – 2.90 USDT demand zone is broken with a daily close below the area.
🎯 Bearish Targets
🔻 Target 1: 2.40 USDT
The nearest minor support level.
🔻 Target 2: 2.10 USDT
A historical support area that previously generated strong rebounds.
🔻 Target 3: 1.85 USDT
A major support zone if a full breakdown from the triangle structure occurs.
⚠️ Bearish Risk Factors
⚠️ False breakout (fakeout) above the trendline.
⚠️ Weak breakout volume.
⚠️ A sharp Bitcoin correction that could pressure the broader altcoin market.
⚠️ Failure to defend the primary demand zone.
---
🎯 Conclusion
ICPUSDT is currently entering one of its most important phases in recent months. The 2.60 – 2.90 USDT demand zone 🟨 serves as the main defense area for buyers and the foundation of the developing bullish structure.
As long as price remains above this demand zone, the potential for a breakout toward 3.62 USDT and 4.60 USDT remains highly favorable. 🚀
However, if this demand zone is lost, bearish momentum could drive price back toward lower support levels. 📉
📌 Traders should closely monitor price action around the descending resistance trendline and breakout volume for confirmation of the next major move.
#ICPUSDT #ICP #InternetComputer #Crypto #Cryptocurrency #Altcoin #Binance #TechnicalAnalysis #TradingView #ChartAnalysis #Bullish #Bearish #SymmetricalTriangle #Breakout #Accumulation #SupportAndResistance #PriceAction #CryptoTrading #Altseason #USDT