ID appears to be trading within a triangle pattern (4H)From the point where we placed the green arrow on the chart, ID appears to have entered a triangle pattern, which is still developing. At the moment, it looks like the price is in Wave D of the triangle.
If the price reaches the red zone, it is expected to be rejected and move back toward the green zone.
A triangle is a corrective pattern, so this consolidation may take some time to complete.
These low-cap altcoins tend to have relatively low trading volume. Be sure to manage your risk carefully by controlling your position size and leverage when trading them.
If you have a coin or altcoin you want analyzed, first hit the like button and then comment its name so I can review it for you.
Do you also think ID is bullish?
In-depth trading ideas
SPACE ID (ID) LONG — 8H ALMA Setup (WR 78%)█ SETUP
BYBIT:IDUSDT.P · 8H · long only.
(Context: SPACE ID — crypto identity / web3 naming protocol; alt-beta to BTC liquidity and risk appetite.)
ALMA Averaging Strategy: ALMA 3 / σ2, SD band 2, min diff 6 bars to add / 1 bar to exit, 25% per bar, up to 4 adds, hard stop −10% from average entry.
Strategy Tester (ID 8H):
Win rate 78% · profit factor 3.3 · max drawdown 9.6%
Avg winning trade +11.7% · avg losing trade −6.8%
Typical hold ~13×8H bars on winners — alt-identity mean-reversion grid on the 8H Averaging template · 72-trade sample
█ WHY NOW
Fresh 8H ALMA long on the 20 Jul 16:00 UTC bar ~ 0.03147 — first lot on this Averaging template (1 of 4).
Bar-close ENTRY on the Bybit perp — not a discretionary SPACE ID narrative chase and not a hand-picked “alt dip” call. Hard stop −10% from fill ~ 0.0283 . Exits follow Pine ALMA flip + min diff or the hard stop. Scale-in stays 25% per bar, up to 4 adds, if lower bars qualify (entry gate needs 6 bars between adds).
═
█ MACRO
Sector: ID = SPACE ID — on-chain identity / naming beta; flows track broad alt risk appetite more than a single protocol catalyst.
Tape (mid–20 Jul): crypto still chopping after the mid-Jul risk-off / repair week — BTC around the mid-$60Ks into 20 Jul, with thin name-specific SPACE ID headlines in the window. No dated ID catalyst overrides the fill.
Execution is 8H ALMA Averaging on the arm bar, not a token-roadmap or “alt season” forecast.
═
█ OUTLOOK
Positive factors
- Tester skew: 78% WR · PF 3.3 · avg win +11.7% vs avg loss −6.8% — workable hit-rate with winners larger than typical losers on a 72-trade sample
- Fresh ≤24h first lot ~0.03147 — template just armed, not a late chase into a finished move
- Close-to-close max drawdown ~9.6% on the tester path — path risk is contained vs many alt grids, while the live −10% hard stop still bounds script risk per ladder
- 8H clock + 6-bar add gate = slower scale-in than 4H meme grids — fewer frantic add prints if the wash extends orderly
Negative factors
- Snapshot gap — no factor board: ID not on the 20 Jul watchlist collect — no independent EMA / ALMA Cur-vs-Avg, SMC, or VWAP Touch confirmation; technical read is live 8H chart + strategy overlay only
- First lot only (1 of 4) — no averaged cushion yet if 8H extends lower before the 6-bar add gate qualifies
- Alt-beta / perp gap risk — BTC risk-off days can wick thin identity names through a %-stop before the next bar close
- No fresh SPACE ID headline or research brief in-window — nothing idiosyncratic cushions a broad alt flush
- Avg win vs avg loss is solid but not extreme — one extended loser can still offset several small wins if the ladder prints the full stop path
Takeaway: the 8H ALMA strategy and 78% WR / PF 3.3 support a disciplined first-lot long at ~0.0315, but the missing factor board, first-lot-only state, and pure alt-beta tape frame a scripted mean-reversion grid — not a catalyst bounce; nominal risk stays on the −10% hard stop / Pine exit path.
Base case: follow 8H ALMA Averaging · hold/add on qualifying bars while BTC/alt beta stays orderly · grind toward the next ALMA exit band if the mid-Jul repair continues without a fresh risk-off gap.
Bear case: lose 8H ALMA · BTC risk-off gaps the perp · −10% from ~0.03147 toward ~0.0283 · template posts the stop and waits for the next bar-close arm.
Chart: BYBIT:IDUSDT.P 8H — ALMA Averaging Strategy.
Educational idea. Live position — past backtest ≠ future results. NFA.
#IDUSDT#ID
The price is moving within a descending channel on the 4-hour timeframe and has reached the lower boundary. It is now poised for a bounce and is expected to retest this boundary.
The Relative Strength Index (RSI) indicates a downward trend, which is likely to continue given the overbought conditions.
There is a key support zone in green at 0.0269, and the price has bounced off this zone several times, making it a strong support level.
The price is trending towards the 100-period moving average, which we are approaching. This trend supports an upward move.
Entry Price: 0.0330
Target 1: 0.0343
Target 2: 0.0343
Target 3: 0.0379
Stop Loss: At the resistance zone in green
Remember this simple rule: Money Management.
Any questions, please leave a comment.
Thank you.
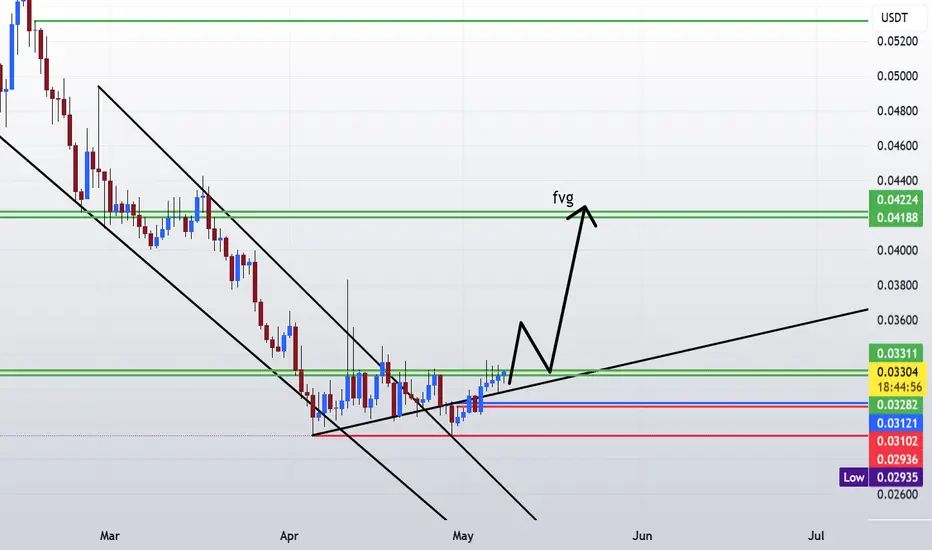
IDUSDT Forming Ascending ChannelIDUSDT is forming a clear ascending channel pattern, a classic bullish wave signal that often indicates an upcoming breakout. The price has been consolidating within a well-defined upward channel, suggesting that selling pressure is gradually weakening while buyers continue to regain control. With consistent trading volume confirming accumulation at lower levels, the current setup hints at a potential bullish breakout in the near future. If the breakout is confirmed, the projected move could lead to an impressive gain of around 40% to 50%.
This ascending channel pattern is commonly seen during healthy market trends and often represents a continuation of bullish momentum after a period of consolidation. Traders closely watching IDUSDT are noticing strengthening momentum as the price approaches a key breakout zone. Healthy trading volume further reinforces this setup, indicating that market participants are positioning early in anticipation of a sustained upward move.
Growing investor interest in IDUSDT reflects increasing confidence in the project's long-term potential and its current technical structure. If buyers successfully push the price above the channel resistance with sustained volume, it could mark the beginning of a fresh bullish leg. The ongoing consolidation phase suggests steady accumulation, creating favorable conditions for a strong continuation rally once the breakout is confirmed.
Traders may find this an attractive medium-term opportunity, especially as the ascending channel pattern nears completion and buying pressure continues to build. A confirmed breakout could attract additional market participation and accelerate the move toward the projected upside target.
✅ Show your support by hitting the like button.
✅ Leaving a comment below! (What is You opinion about this Coin)
Your feedback and engagement keep me inspired to share more insightful market analysis with you!
#IDUSDT#ID
The price is moving within a descending channel on the 1-hour timeframe and has reached the lower boundary. It is now poised for a bounce and is expected to retest this boundary.
The Relative Strength Index (RSI) indicates a downward trend, which is likely to continue given the overbought conditions.
A key support zone has been identified in green at 0.0277. The price has bounced off this zone several times, making it a strong support level.
The price is trending towards the 100-period moving average, which we are approaching. This trend supports an upward move.
Entry Price: 0.0318
Target 1: 0.0333
Target 2: 0.0352
Target 3: 0.0378
You can close at the second target or wait for the third target. The choice is yours.
Stop Loss: At the resistance zone in green.
Remember this simple rule: Money Management.
Any questions? Please leave a comment.
Thank you.
IDU / USDT | July Q3 26' | Day ChartID / TetherUS
I saw this on TradingView homepage. I have no idea what it is but I love to chart candles.
On June 5th -6th Price action tested the Yearly SwingLow created March 1 2023 and broke the level of support.
On June 10th a bullish engulfing candle gained the distribution range and started an accumulation ladder.
Price is currently above a daily FrontSide candle which has an expectation to create a low angle accumulation trend and continue the ladder up to the weekly BackSide level (grey line at .0446) which is acting as resistance.
I've marked the new low which is a weekly Inv. BackSide candle acting as support. Price may come back down to here. If so, we want to see the body of the candles closing above this weekly level or its price discovery dump to the marked moves at .02 and .01 cents.
If price breaks above the weekly level at .04 then there is another weekly BackSide level and weekly Inv.FrontSide level waiting as resistance.
-------------------------
Multiple Time-Frame Analysis; Color Code | Strength favors the higher timeframe.
Yearly timeframe = black
Monthly timeframe = pink
weekly = grey
daily = red
4hr = orange
1hr = yellow
15min = blue
5min = green if they are shown. (Level visibility on intervals is set to timeframe the level was found on and below to keep chart view organized.)
** Candle Science explained **
A Range = two or more consecutive color candles.
There are two types of ranges - accumulation and distribution.
DISTRIBUTION RANGES DEFINED: BackSide (BS) Candle - First distribution candle in a distribution range. Expectation = strong reaction to price. long wicks reaching to or away from level.
FrontSide (FS) Candle - Last distribution candle in a distribution range. Expectation = reversal, create a trend in the opposite direction. Distribution candles are used as support.
ACCUMULATION RANGES DEFINED:
Inverse BS (Inv.BS) - First Accumulation candle in an accumulation range. Expectation. = strong reaction to price. long wicks reaching to or away from level.
Inverse FS (Inv.FS) - Last accumulation candle in an accumulation range. Expectation = reversal, create a trend in the opposite direction. Accumulation candles are used as resistance.
Space ID: Bottom Reversal vs Long-Term Bull MarketThe last three weeks are green. See this. There is a perfect downtrend within the falling wedge channel and the candles follow a certain pattern, it is like a program is doing the trading. Before the market changes, the pattern left by the candles starts to change.
After March 2026 IDUSDT stops printing the usual candles, it turns sideways. Before the structural change, we see a sudden increase in volatility. Candles big and small, up and down. Volume was up significantly, the highest ever as usual close to the all-time low, then the market becomes calm again but instead of a downtrend, we now have only green candles and you know what follows.
The downtrend lasts exactly two years, March 2024 through March 2026. I repeat the dates often so that you can see what I see and agree with me. So that you can see the opportunity and take action solely for your own benefit.
So now ID is breaking out of this long-term downtrend, it is still early though. The bottom soon will be gone and we are already moving within a long-term bullish cycle, it starts at the all-time low. The all-time low happened earlier this month, we have three weeks of bullish action and that is only the start.
If the bear market lasted two years, the bull market can last four (wishful thinking of course). A bull market can last one year, two years, four years, six years and so on. It is a mixed bag. We are treading uncharted territory, anything goes.
Namaste.
Is #ID ready to Recover From its Correction? Key Areas to WatchYello, Paradisers! Is #ID preparing for a massive breakout from a long-term compression pattern, or are traders about to get caught in another fake move? Let's view #SPACEID trading setup:
💎#IDUSDT is currently trading around $0.031 on the 4H timeframe while developing inside a well-defined falling wedge pattern, a structure that is often associated with bullish reversals after prolonged downtrends. Price has recently pushed into the upper boundary of the wedge, showing increasing buying interest as the range continues to tighten.
💎The most important area to watch right now is the descending resistance trendline near the current price. A confirmed breakout above this trendline, supported by increasing volume, would significantly improve the probability of a larger bullish move. Even more importantly, traders should look for the 50 EMA to act as support during a retest after the breakout. This would provide additional confirmation that buyers are taking control of the short-term trend.
💎 The nearest support zone is located around $0.0260, which is currently serving as a key defensive level for #IDUSD. As long as the price remains above this support, the bullish structure remains intact. The recent reaction from this area demonstrates that buyers are actively defending lower prices. If buyers successfully break and hold above the falling wedge resistance, the first upside target stands at the moderate resistance zone near $0.050. This level represents a significant technical barrier and could attract temporary profit-taking activity. However, a decisive move above this resistance would signal that bullish momentum is accelerating.
💎Should the bullish breakout continue with strong participation, the next major objective would be the strong resistance zone around $0.0693. Reaching this level would represent a substantial upside move from current prices and confirm a complete trend reversal from the previous bearish structure.
💎From a momentum perspective, the MACD has already printed a bullish crossover, while the histogram continues to expand positively. This suggests that momentum is gradually shifting in favor of buyers. Although momentum indicators alone should never be used as confirmation, they currently align with the bullish technical structure developing on the chart. On the downside, traders should closely monitor the demand zone around $0.0191. A breakdown below this level would invalidate the current bullish setup.
Trade smart, Paradisers. This setup will reward only the disciplined.
MyCryptoParadise
iFeel the success🌴
ID/USDT - Descending Trendline, – Breakout or Rejection?On the 4-Day timeframe, ID/USDT remains within a long-term downtrend structure, highlighted by the yellow Descending Trendline that has been suppressing price action since the peak around $0.72.
🔻 The price is now showing early signs of recovery after forming a series of higher lows near the bottom. Recent price action suggests that buyers are attempting to regain control and challenge the major resistance represented by the long-standing descending trendline.
📌 This Descending Trendline is currently the most important technical level, as a valid breakout could shift market sentiment from bearish to bullish in the medium term.
━━━━━━━━━━━━━━━━━━━━
📉 Pattern Formation: Descending Trendline
A Descending Trendline forms when price continuously creates Lower Highs within a downtrend.
🔍 Pattern Characteristics:
✅ Indicates long-term seller dominance.
✅ The more times the trendline is tested, the weaker the resistance tends to become.
✅ A breakout above the trendline often signals the beginning of a trend reversal.
📈 In this chart, the price has been rejected multiple times by the trendline and is now approaching this key resistance area once again.
━━━━━━━━━━━━━━━━━━━━
🟢 Bullish Scenario
The bullish outlook will be confirmed if price can:
✔️ Break and close decisively above the Descending Trendline.
✔️ Successfully retest the trendline as new support.
✔️ Be accompanied by increasing buying volume.
🎯 Bullish Targets:
🎯 $0.0558 → Initial resistance
🎯 $0.0790 → Mid-term target
🎯 $0.1037 → Major target
🚀 If bullish momentum continues, this breakout could mark the beginning of a new accumulation phase following an extended downtrend.
━━━━━━━━━━━━━━━━━━━━
🔴 Bearish Scenario
The bearish outlook remains valid if:
❌ Price fails to break above the Descending Trendline.
❌ Strong rejection occurs at the trendline resistance.
❌ Price continues forming Lower Highs and Lower Lows.
🎯 Bearish Targets:
📍 First support: $0.0260
📍 Major support: $0.0230
⚠️ A breakdown below these support levels could trigger further downside and extend the long-term bearish trend.
━━━━━━━━━━━━━━━━━━━━
🔍 Key Levels to Watch
🚧 Resistance Levels:
🔸 $0.0558
🔸 $0.0790
🔸 $0.1037
🛡️ Support Levels:
🔹 $0.0260
🔹 $0.0230
📈 Dynamic Resistance:
🟡 Descending Trendline (Yellow Trendline)
━━━━━━━━━━━━━━━━━━━━
💡 Conclusion
ID/USDT is currently approaching a critical decision point after experiencing a prolonged decline from its historical peak.
📉 While the overall structure remains technically bearish, the repeated testing of the Descending Trendline increases the probability of a significant breakout.
🟢 If buyers successfully break and hold above the trendline, the upside targets at $0.0558 – $0.1037 become realistic areas to watch.
🔴 On the other hand, failure to break above resistance may result in another retest of the lower support zone, keeping the bearish trend intact.
⚡ The current trendline area is the key battleground that will likely determine the next major market direction.
📌 Trade the confirmation, not the prediction.
━━━━━━━━━━━━━━━━━━━━
#IDUSDT #ID #Crypto #Cryptocurrency #TechnicalAnalysis #TradingView #PriceAction #DescendingTrendline #TrendlineBreakout #Bullish #Bearish #BreakoutTrading #Altcoins #Binance #CryptoTrading #SupportAndResistance #TrendReversal #MarketStructure
IDUSDT Forming Falling WedgeIDUSDT is forming a clear falling wedge pattern, a classic bullish wave signal that often indicates an upcoming breakout. The price has been consolidating within a narrowing range, suggesting that selling pressure is weakening while buyers are beginning to regain control. With consistent volume confirming accumulation at lower levels, the setup hints at a potential bullish breakout soon. The projected move could lead to an impressive gain of around 90% to 100% once the price breaks above the wedge resistance.
This falling wedge pattern is typically seen at the end of downtrends or corrective phases, and it represents a potential shift in market sentiment from bearish to bullish. Traders closely watching IDUSDT are noting the strengthening momentum as it nears a breakout zone. The strong trading volume adds confidence to this pattern, showing that market participants are positioning early in anticipation of a reversal.
Investors’ growing interest in IDUSDT reflects rising confidence in the project's long-term fundamentals and current technical strength. If the breakout confirms with sustained volume, this could mark the start of a fresh bullish leg. The current market structure suggests that buyers are steadily gaining control while bearish pressure continues to weaken.
Traders might find this a valuable setup for medium-term gains, especially as the falling wedge pattern completes and buying momentum accelerates. A successful breakout could attract additional market attention and potentially push the price toward significantly higher levels in the coming weeks.
✅ Show your support by hitting the like button!
✅ Leaving a comment below! (What is your opinion about this Coin?)
Your feedback and engagement keep me inspired to share more insightful market analysis with you!
#ID/USDT Ready to go up#ID
The price is moving within a descending channel on the 1-hour timeframe and has reached the lower boundary. It is now poised for a bounce and is expected to retest this boundary.
The Relative Strength Index (RSI) indicates a downward trend, which is likely to continue given the overbought conditions.
A key support zone has been identified in green at 0.0244. The price has bounced off this zone several times, making it a strong support level.
The price is trending towards the 100-period moving average, which we are approaching. This trend supports an upward move.
Entry Price: 0.0273
First Target: 0.0279
Second Target: 0.0290
Third Target: 0.0305
You can close at the second target or wait for the third target. The choice is yours.
Stop Loss: At the resistance zone in green.
Remember this simple rule: Money Management.
Any questions? Please leave a comment.
Thank you.
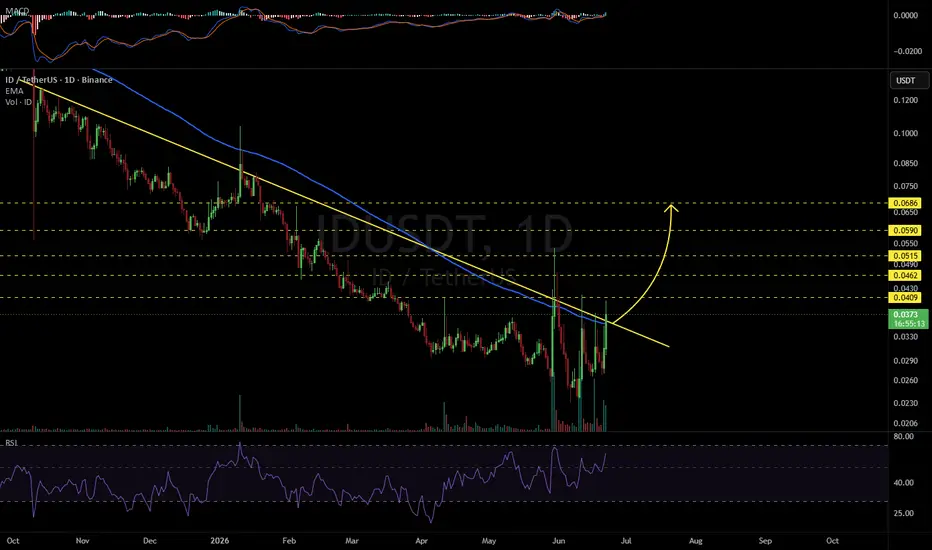
IDUSDT 1D#ID is breaking out above the descending resistance and the daily EMA100. If the daily candle closes above these levels, the following upside targets could come into play:
🎯 $0.0409
🎯 $0.0462
🎯 $0.0515
🎯 $0.0590
🎯 $0.0686
⚠️ Always remember to use a tight stop-loss and maintain proper risk management.
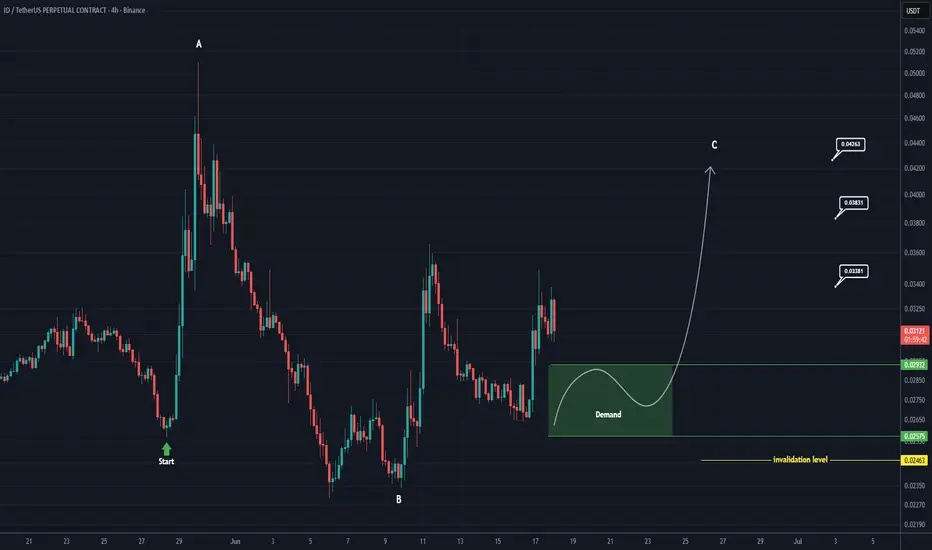
Smart Money Moving Into ID (4H)After a period of correction and the formation of small-bodied, shallow corrective candles, bullish candles with strong momentum have recently started to appear, suggesting that a bullish phase may be developing on ID.
Contrary to the broader market, which remains in the red, ID appears bullish and seems to have started an ABC pattern or possibly a more complex corrective structure.
As long as the green zone is maintained, the price could move toward higher levels, with the targets marked on the chart.
Consider building a position using a DCA (Dollar-Cost Averaging) strategy within the green zone.
A daily candle close below the invalidation level would invalidate this outlook and analysis.
If you have a coin or altcoin you want analyzed, first hit the like button and then comment its name so I can review it for you.
What do you think? Is ID Bullish?
#IDUSDT Medium-term Bullish potential !#ID
The price is moving within a descending channel on the 1-hour timeframe and has reached the lower boundary. It is now poised for a bounce and is expected to retest this boundary.
The Relative Strength Index (RSI) indicates a downward trend, which is likely to continue given the overbought conditions.
There is a key support zone in green at 0.0221. The price has bounced off this zone several times, making it a strong support level.
The price is trending towards the 100-period moving average, which we are approaching. This trend supports an upward move.
Entry Price: 0.0288
Target 1: 0.0300
Target 2: 0.0322
Target 3: 0.0345
Stop Loss: At the resistance zone in green
Remember this simple rule: Money management.
Any questions? Please leave a comment.
Thank you.
IDUSDT Forming Falling WedgeIDUSDT is forming a clear falling wedge pattern, a classic bullish wave signal that often indicates an upcoming breakout. The price has been consolidating within a narrowing range, suggesting that selling pressure is weakening while buyers are beginning to regain control. With consistent volume confirming accumulation at lower levels, the setup hints at a potential bullish breakout soon. The projected move could lead to an impressive gain of around 140% to 150% once the price breaks above the wedge resistance.
This falling wedge pattern is typically seen at the end of downtrends or corrective phases, and it represents a potential shift in market sentiment from bearish to bullish. Traders closely watching IDUSDT are noting the strengthening momentum as it approaches a key breakout zone. The steady trading volume adds confidence to this pattern, showing that market participants are positioning early in anticipation of a reversal.
Investors’ growing interest in IDUSDT reflects rising confidence in the project’s long-term fundamentals and current technical strength. If the breakout confirms with sustained volume, this could mark the beginning of a strong bullish leg. The current structure suggests that buyers are gradually gaining dominance while selling pressure continues to weaken.
Traders might find this a valuable setup for medium-term gains, especially as the falling wedge pattern completes and buying momentum accelerates. A successful breakout could trigger strong follow-through movement and push the price significantly higher in the coming trend phase.
✅ Show your support by hitting the like button!
✅ Leaving a comment below! (What is your opinion about this Coin?)
Your feedback and engagement keep me inspired to share more insightful market analysis with you!
IDUSDT Forming Falling WedgeIDUSDT is forming a clear falling wedge pattern, a classic bullish wave signal that often indicates an upcoming breakout. The price has been consolidating within a narrowing range, suggesting that bearish momentum is gradually weakening while buyers are beginning to step back into the market. With steady volume supporting accumulation near key support levels, the setup points toward a potential bullish breakout in the near term.
The projected move could result in an impressive gain of around **140% to 150%** once the price successfully breaks above the wedge resistance. This falling wedge pattern is commonly observed during the final stages of a downtrend or correction, often signaling a shift in market sentiment from bearish to bullish.
Traders closely watching IDUSDT are noticing strengthening price action as the asset approaches a critical breakout zone. Healthy trading volume adds further confidence to the setup, indicating that market participants may be positioning themselves ahead of a potential trend reversal. Growing interest in IDUSDT reflects increasing confidence in both its technical structure and future market potential.
If the breakout is confirmed with sustained buying volume, it could mark the beginning of a strong bullish leg. This setup may offer an attractive opportunity for medium-term traders looking to capitalize on momentum as the falling wedge pattern nears completion and bullish pressure continues to build.
✅ Show your support by hitting the like button!
✅ Leave a comment below! (What is your opinion about this coin?)
Your feedback and engagement keep me inspired to share more insightful market analysis with you!
#ID/USDT Ready to go up#ID
The price is moving within a descending channel on the hourly timeframe. It has reached the lower boundary and is heading towards breaking it. A retest of this boundary is expected.
The Relative Strength Index (RSI) is showing a downward trend, moving in a downtrend and likely to continue due to overbought conditions.
There is a key resistance zone in green at 0.0472. The price has bounced off this zone several times, making it a strong support level.
A consolidation trend is observed above the 100-period moving average, which we are approaching. This trend supports a decline towards this level.
Entry Price: 0.0482
Target 1: 0.0491
Target 2: 0.0501
Target 3: 0.0511
Stop Loss: At the resistance zone in green.
Remember this simple thing: Money Management.
For any questions, please leave a comment.
Thank you.
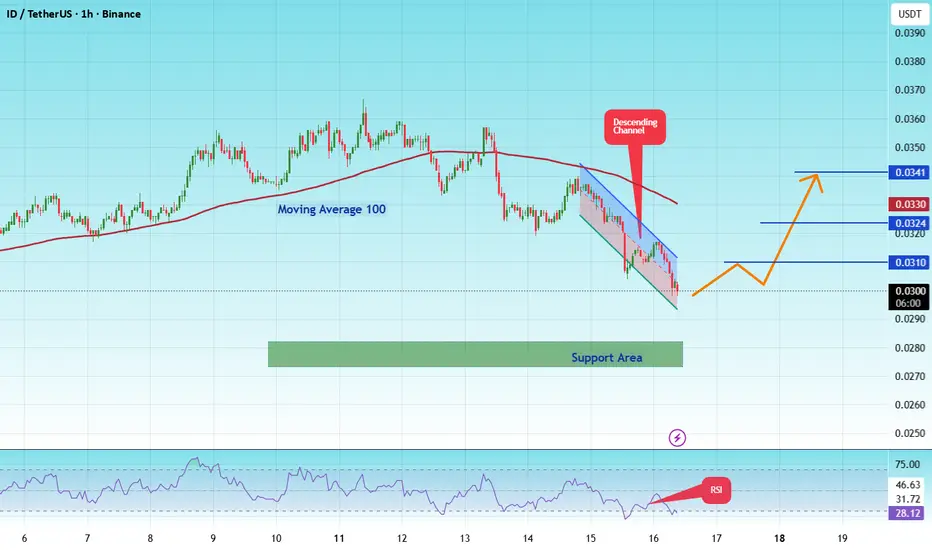
#IDUSDT Medium-term Bullish potential !#ID
The price is moving within a descending channel on the hourly timeframe. It has reached the lower boundary and is trending towards a bounce. A retest of this boundary is expected.
The Relative Strength Index (RSI) indicates a downward trend, and this trend is likely to continue due to the overbought condition.
A key support zone has been identified in green at 0.0270. The price has bounced off this zone several times, making it a strong support level.
The price is trending towards the 100-period moving average, which we are approaching. This trend supports an upward move.
Entry Price: 0.0300
First Target: 0.0310
Second Target: 0.0324
Third Target: 0.0341
You can close at the second target or wait for the third target to be reached. The choice is yours.
Stop Loss: At the resistance zone in green.
Remember this simple rule: Money Management.
Any questions? Please leave a comment.
Thank you.
IDUSDT Forming Falling WedgeIDUSDT is forming a clear falling wedge pattern, a classic bullish wave signal that often indicates an upcoming breakout. The price has been consolidating within a narrowing range, suggesting that selling pressure is weakening while buyers are beginning to regain control. With consistent volume confirming accumulation at lower levels, the setup hints at a potential bullish breakout soon. The projected move could lead to an impressive gain of around 90% to 100% once the price breaks above the wedge resistance.
This falling wedge pattern is typically seen at the end of downtrends or corrective phases, and it represents a potential shift in market sentiment from bearish to bullish. Traders closely watching IDUSDT are noting the strengthening momentum as it nears a breakout zone. The good trading volume adds confidence to this pattern, showing that market participants are positioning early in anticipation of a reversal.
Investors’ growing interest in IDUSDT reflects rising confidence in the project’s long-term fundamentals and current technical strength. If the breakout confirms with sustained volume, this could mark the start of a fresh bullish leg. Traders might find this a valuable setup for medium-term gains, especially as the wedge pattern completes and buying momentum accelerates.
✅ Show your support by hitting the like button and
✅ Leaving a comment below! (What is your opinion about this coin?)
Your feedback and engagement keep me inspired to share more insightful market analysis with you!
#IDUSDT Ready to go higher#ID
The price is moving within a descending channel on the 1-hour timeframe and has reached the lower boundary. It is now poised for a bounce and is expected to retest this boundary.
The Relative Strength Index (RSI) indicates a downward trend, which is likely to continue given the overbought conditions.
There is a key support zone in green at 0.0295. The price has bounced off this zone several times, making it a strong support level.
The price is trending towards the 100-period moving average, which we are approaching. This trend supports an upward move.
Entry Price: 0.0313
First Target: 0.0319
Second Target: 0.0326
Third Target: 0.0335
You can stop at the first and second targets and close below them, or continue towards the third target. Stop Loss: At the resistance zone in green.
Remember this simple rule: Money Management.
Any questions? Please leave a comment.
Thank you.
IDUSDT Forming Falling WedgeIDUSDT is forming a clear falling wedge pattern, a classic bullish wave signal that often indicates an upcoming breakout. The price has been consolidating within a narrowing range, suggesting that selling pressure is weakening while buyers are beginning to regain control. With consistent volume confirming accumulation at lower levels, the setup hints at a potential bullish breakout soon. The projected move could lead to an impressive gain of around 60% to 70% once the price breaks above the wedge resistance.
This falling wedge pattern is typically seen at the end of downtrends or corrective phases, and it represents a potential shift in market sentiment from bearish to bullish. Traders closely watching IDUSDT are noting the strengthening momentum as it nears a breakout zone. The good trading volume adds confidence to this pattern, showing that market participants are positioning early in anticipation of a reversal.
Investors’ growing interest in IDUSDT reflects rising confidence in the project’s long-term fundamentals and current technical strength. If the breakout confirms with sustained volume, this could mark the start of a fresh bullish leg. Traders might find this a valuable setup for medium-term gains, especially as the wedge pattern completes and buying momentum accelerates.
✅ Show your support by hitting the like button and
✅ Leaving a comment below! (What is your opinion about this coin?)
Your feedback and engagement keep me inspired to share more insightful market analysis with you!
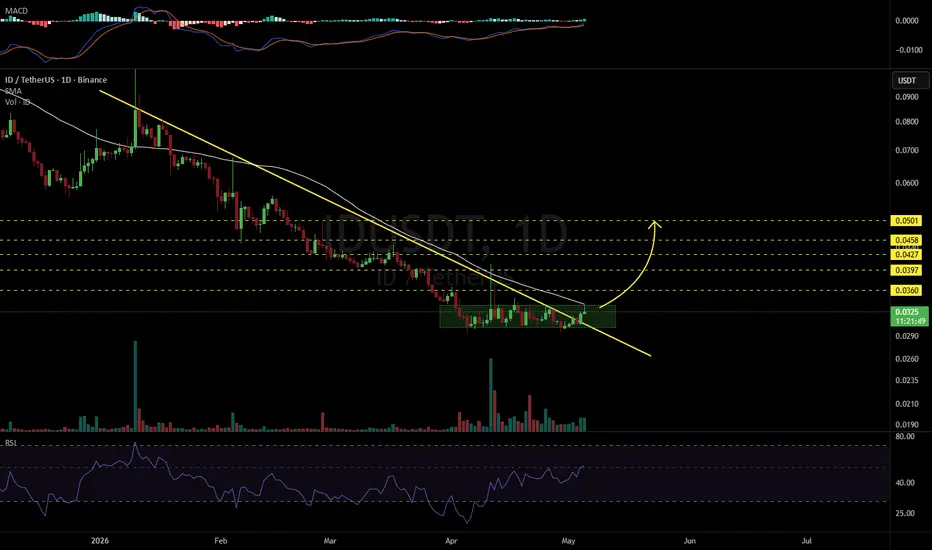
IDUSDT 1D#ID has broken above the descending resistance on the daily chart but is still ranging within a box and facing the daily SMA50. In case of a breakout above these levels, further upside continuation can be expected:
🎯 $0.0360
🎯 $0.0397
🎯 $0.0427
🎯 $0.0458
🎯 $0.0501
⚠️ Always remember to use a tight stop-loss and maintain proper risk management.