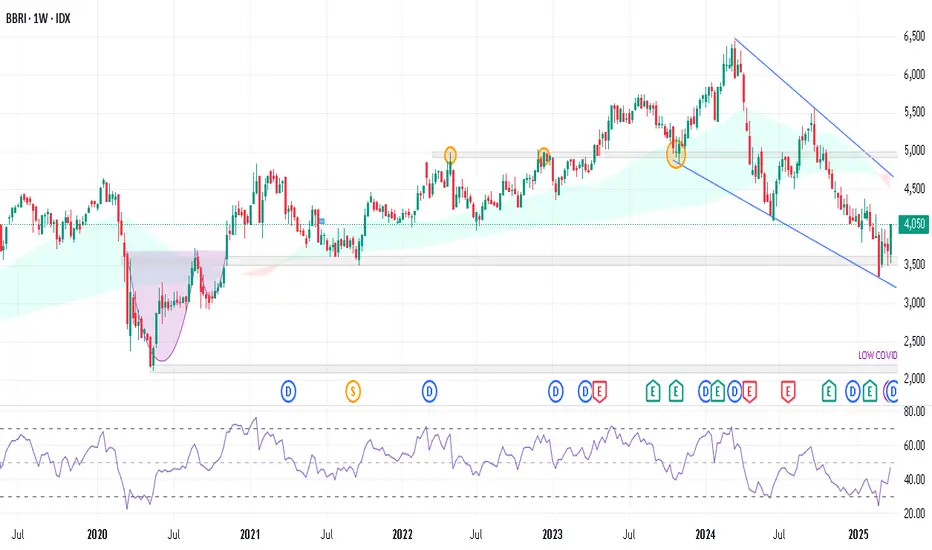
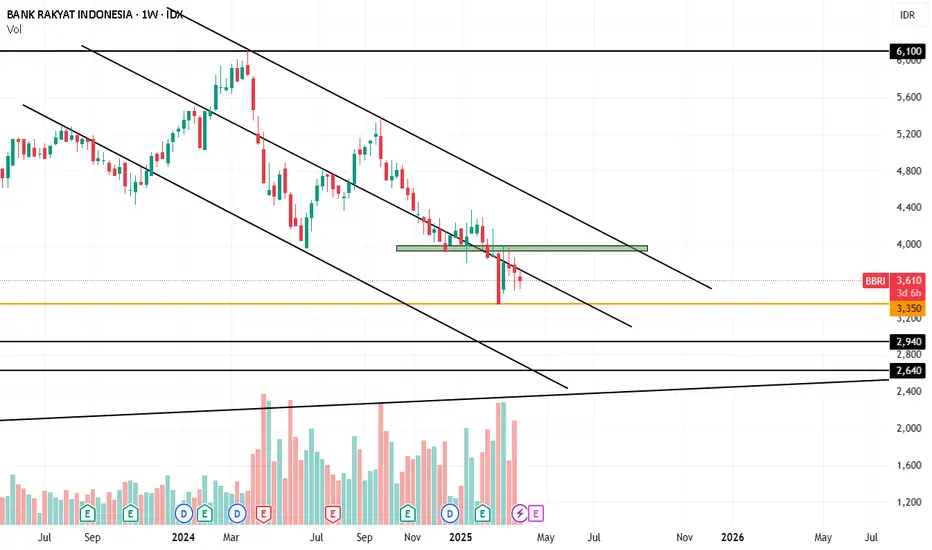
BBRI Plan Until Next YearIDX:BBRI
I only interested in buying around 2850-2800 or better below it.
Above those prices, risk/reward becomes not good enough for me.
Prices encountered resistance twice at the 3050-3100 area and failed.
Stoploss would be 2470-2500 area, because if price breaks below that, there will be a demand zone at 1870 - 2150.
This is my own opinion.
Do your own research.
PT Bank Rakyat Indonesia (Persero) Tbk Class B
No trades
No trades
In-depth trading ideas
BBRI Outlook: Bearish Structure Toward Major DemandBBRI remains under strong bearish pressure on the weekly timeframe. Price structure continues to form a series of lower highs and has broken several key support levels, indicating that sellers are still dominant. The current price is around 2,740 after failing to hold the previous support area, so the overall movement still has potential to continue toward the lower demand zone.|
In conclusion, BBRI’s bias remains bearish. A stronger recovery scenario will only become more valid if price starts
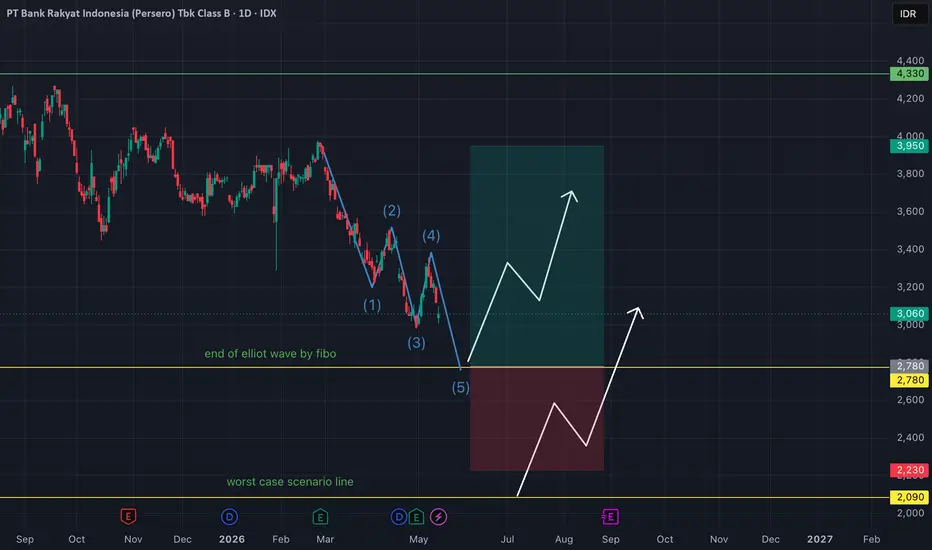
BBRI forecastingBased on my analysis, BBRI's current price movement is still in a downtrend. By applying the Elliott Wave cycle, I observe that the final wave has formed. This is also supported by Fibonacci analysis to identify potential price movements before entering a long position.
Going 'long' here is a speculative trade, not a long-term hold. It should be noted that a long entry must only be executed if it is supported by candlestick patterns such as a bullish engulfing, a star, or a hammer.
However, I
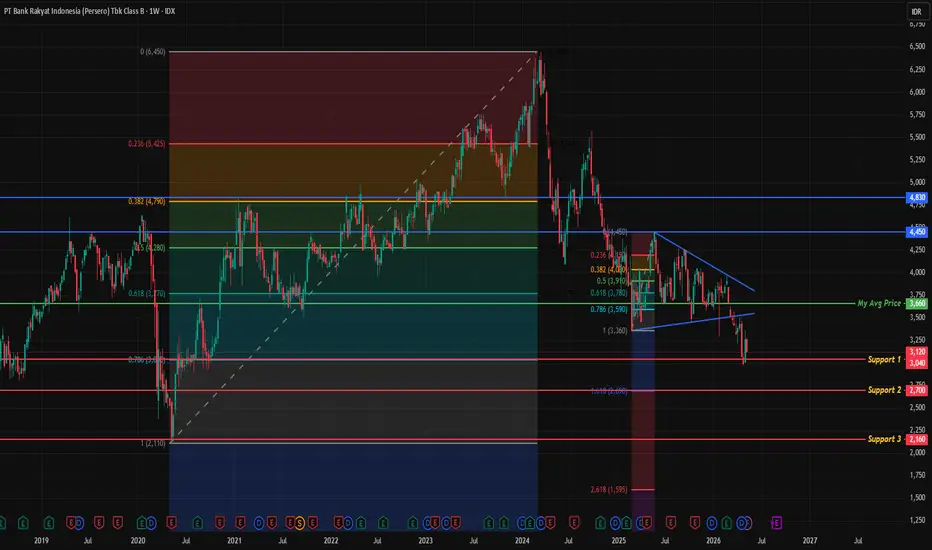
BBRI Weekly Analysis UpdateCurrent Price: ±3,120
Average Buy Position: 3,660
Focus of this analysis:
* support identification,
* Fibonacci structure,
* and the symmetrical triangle breakdown.
---
# Market Structure
BBRI remains under medium-term bearish pressure.
From the updated chart:
* the symmetrical triangle has already broken down,
* key horizontal support failed to hold,
* and price is now trading below my average buy position at 3,660.
The 3,660 area has now turned into:
* a psychological resistance,
* a
BBRI.JK WILL END IT'S CORRECTION SOON?Based on Elliot Wave perspective, it's showing potential ending of correction, the 5th wave of C of ABC correction could be ended around this level, which is happened to be 78.6% fibo level as well.
I suggest to enter 50% of trading size now and wait for bullish confirmation/ rejection candle on daily to enter another 50%. The upward movement can be very sweet, i don't aim for 20-30%, it's 50% potential gain trade!
GOOD LUCK and CHEEERSS!!
BBRI again and againBBRI is easy to trade IMO, not in fundamental thing, but only from price action and technical.
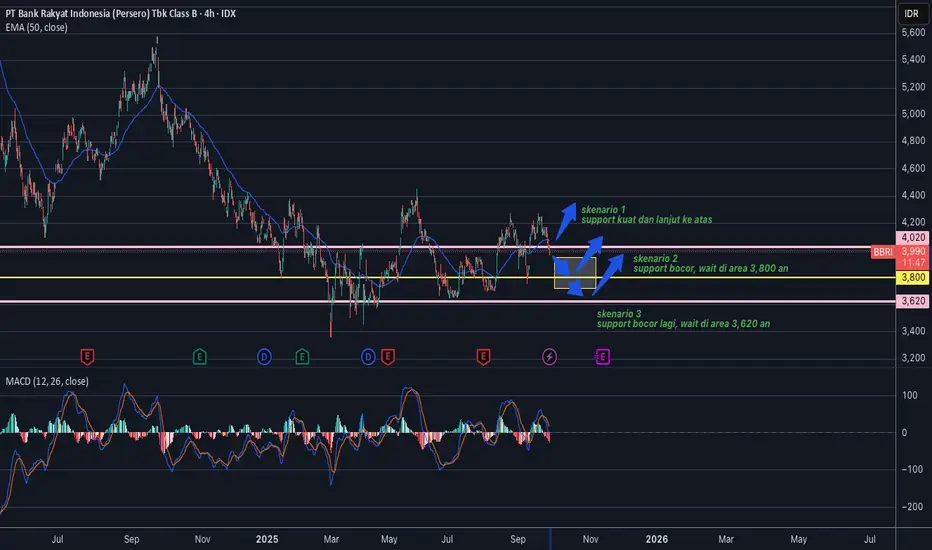
Today 29 September 2025, break session, IDX:BBRI price at 3,990
From chart, we can see if now try to break strong support level 4,020
If everything normal, there's 3 scenario :
1. Price can close at above support level today. Then, I will buy only, simple.
2.a. Today close below support level. Wait at area around 3,800, there's local support. Wait and see the price action near that box area, if the
WAITING PATIENTLY FOR THE END OF ABC CORRECTION 3050-3250The consolidation (consider as Wave 4 of C) was broken and it started the last bearish Wave as 5 of the C.
I am waiting to buy around 3050-3250 as i see it will be the end of the Wave C.
After it completes the C, the next will be ALL BULL..
LET'S GO!!
CHEEERRRSSS...!!!
BBRI - Analisis Fundamental / Analisis TechnicalFundamental
Price: ~IDR 4,140 per share.
Earnings: EPS ~376, showing good profit generation.
Dividend Yield: ~8.4%, quite attractive.
Assets & Equity: Growing steadily, though debt is also increasing.
Strength: Strong in micro/SME lending, wide customer base.
Risk: Economic slowdown, rising interest rates, and loan defaults (NPL).
Technical
Support: IDR 3,740–3,900
Resistance: IDR 4,290–4,380
Trend: Short-term downtrend, but near oversold → possible rebound.
Current Action: Price i
Needs ConfirmationJust to the point... The structure still looks bad but there is no invalid confirmation that it will continue to fall.
Weekly closed nya juga jelek
The action?
1. Speculation, buy now with averaging strategy There was demand in the previous candles. Invalid if the price drops below support
2. Waiting in the support area, in order to achieve a better RR ratio if the price drops until there.
3. Wait for the price to escape from dynamic resistance
DYOR
Trade with your own decision
BBRI hakaBBRI currently at Rp 3,630 closing price 9 April 2025.
Technical :
Near on support line at Rp 3,620. Still solid this line I think.
MACD give the good sign too
Macro :
Cum Date Dividend on 10 April 2025. Dividend Rp 208,4 (5.7% from the current price).
Trump delay the tariff in 90 days ahead. ( The news )
So, it's a good news for short term period.
It will be pump hard haha.
Thankyou for reading my ideas.
DWYOR.
I hope everyone have a good health and good life!
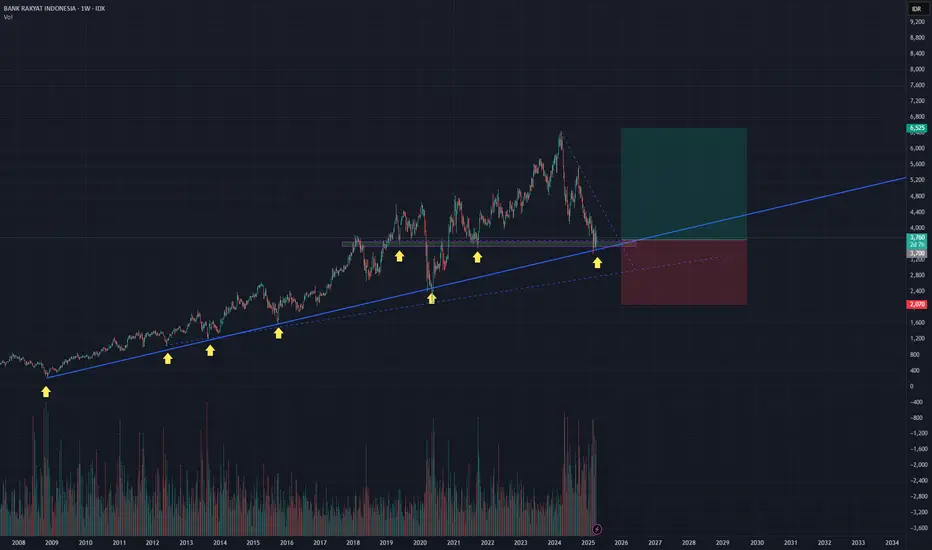
BBRI Weekly Outlook – Testing a Multi-Decade TrendlineTicker: BBRI (IDX)
Timeframe: Weekly
Status: High-Priority Technical Watchlist
🔹 Long-Term Structure
BBRI is currently testing a major ascending trendline that has been in play since 2008. This zone has historically served as a reliable long-term inflection point, having been tested multiple times over the past 15+ years.
The trendline has held six or more significant touchpoints, strengthening its technical validity.
Price action is also aligned with a horizontal demand zone (approx. 3,400–3
BBRIBbri
Wait and see first
For long investors,bbri is still bullish but for trader or beginner investors,do not enter first
Because for the weekly the price has breaked thru MA200,we will monitor whether the support of 3.350 will break through or not i fit breaks through
We will monitor the price of 2.650-2.950
BBRI BUY NOW 3350! Support level at 3050-3150BBRI is now probably trade in the end of its deep correction, as on the technical view, by the Elliot Waves count, it is now completing the WAVE 5 of C (it confirmed by the Bullish Divergence on MACD).
The price could be be a little lower on the next 1-5 trading days to the 3050-3150, which is the 78.6% fibonacci retracement from broken uptrend. It is really strong support and i believe i would not be broken.
For about 6-12 months ahead, aim for minimum target of 30% return from this level.
A
BBRI Potential Drop to 3090 Before a ReboundI'm forecasting that BBRI may decline further to the 3090-2930 demand zone, where an unfilled order block exists. There's a potential bounce in the 3750-3690 area, but if selling pressure continues, the price could reach the lower support before reversing. Watching for confirmation at these key levels before taking action.
What do you think? let discuss below? 😊
Forecasting BBRI1. Key Support & Resistance Levels
Strong support: 3,620 – 3,500
Nearest resistance: 4,040 – 4,250
Major resistance: 4,800 – 5,025
Minor support: 3,810 (current price area)
2. Potential Price Movement
If the price holds at 3,810 and doesn’t break down to 3,620, there is a potential technical rebound toward 4,040 – 4,250.
If the price breaks down from 3,810 and breaches 3,620, there is a risk of further decline to 3,500 or even lower.
If the price rebounds from 3,810 and breaks through 4,040, the
Analysis of BBRITechnical Analysis of BBRI
Price Level Analysis
Strong Support 3,800 - 3,900
Short-Term Resistance 4,100 - 4,300
Long-Term Resistance 4,600 - 4,800
Cut Loss Level 3,700 (if a deeper breakdown occurs)
📉 Current Situation: The price is approaching strong support at 3,900.
If a rebound occurs, the first target is 4,100 - 4,300.
If 4,300 resistance breaks, the price may rise to 4,600 - 4,800.
If it drops below 3,800, there is a risk of further decline.
❌ BBRI Risks
🔸 Economic Pressure & Inflation