🇮🇩 IHSG at a Crossroads: Reading the Chart Before MSCI’s DecisThe Indonesian stock market is entering one of its most pivotal moments in years. With MSCI’s reclassification decision arriving next week, every investor — local or foreign — is watching closely. But before we react to headlines, let’s read what the chart is actually telling us.
📊 What the Chart Shows
The Jakarta Composite Index is currently trading at 6,127, sitting at a critical technical junction on the 2H timeframe.
From an Elliott Wave perspective, the structure suggests that a 5-wave impulse has completed near the 5,324 low seen in early June. What we are likely experiencing now is a corrective A-B-C sequence — a natural, healthy retracement after a completed impulse.
The key levels to watch:
• 6,258 — 6,479 → Resistance zone (50%–38.2% Fib). A relief bounce could test this area
• 5,724 → First meaningful support if selling pressure resumes (78.6% Fib)
• 5,379 → Major structural floor — this level matters
• 4,183 → Wave D projection target if the full corrective sequence plays out (161.8% extension)
The market is not in freefall. It is correcting in a structured, readable pattern.
🔍 About the MSCI Review
MSCI has raised concerns about Indonesia’s market — specifically around shareholding transparency and pricing reliability. These are governance issues, not fundamental economic collapse.
Indonesia’s GDP remains one of Southeast Asia’s largest. The central bank has been actively defending the rupiah. Reforms are already underway, including doubling the minimum free-float requirement to 15%.
The critical question next week: Emerging Market or Frontier Market?
Here is the honest picture:
A downgrade is possible — but not certain. And even if it happens, it is not the end of the story.
When countries like Pakistan and Argentina were reclassified to Frontier, markets initially sold off sharply — but both eventually stabilized and offered strong re-entry opportunities for patient investors. Reclassification resets expectations, and sometimes, that reset is exactly what a market needs.
🧭 Three Scenarios Going Forward
Scenario 1 — MSCI Delays the Decision
Most market-friendly outcome. New IDX leadership gets time to address governance concerns. Expect a short-term relief rally toward 6,479–6,751. The corrective structure would extend before continuing lower.
Scenario 2 — Indonesia Retains EM Status
Stronger relief rally. Confidence partially restored. However, structural concerns remain — the rally is likely to be capped unless real governance reform follows the announcement.
Scenario 3 — Downgrade to Frontier Market
Forced outflows from EM-tracking funds will accelerate. The 5,379 support zone becomes the first critical test. If breached, the wave projection toward 4,183 becomes technically valid. This is not a crash — it is a repricing toward fair value under new conditions.
🛡️ What This Means for You as an Investor
The worst thing you can do right now is make emotional decisions based on fear of a headline.
The chart is telling you that structure exists — this is a measured correction, not a collapse. Smart money does not panic at wave corrections. It prepares levels.
Three things worth doing this week:
1. Know your key levels — 5,379 is the line in the sand. Watch it closely after the MSCI announcement
2. Size your positions accordingly — uncertainty is elevated; this is not the time for maximum exposure
3. Keep a watchlist ready — if a downgrade triggers a flush to the 4,183 zone, that could represent a generational re-entry opportunity for long-term investors in Indonesian equities
📌 Final Thought
Indonesia has been here before — navigating external pressure, currency stress, and global sentiment shifts. The fundamentals of a 280-million-person economy do not disappear because of an index reclassification.
The chart shows a correction in progress. The news confirms the catalyst. But between those two realities lies opportunity — for those who read the map before the storm, not after.
Stay informed. Stay structured. Watch the levels.
This analysis is for educational purposes only and does not
constitute financial advice. Always do your own research.
— RoyHiddenTesla
IDX Composite Index
No trades
No trades
In-depth trading ideas
Will the IHSG rebound? IDX:COMPOSITE IDX:COMPOSITE
The IHSG has experienced weakness over the past few weeks. However, it is still currently in a bullish trend. I see the IHSG starting to form a bearish head and shoulders pattern, while also having the potential for a short-term rebound.
The rebound targets for the IHSG are:
* Resistance 1: 7,000
* Resistance 2: 7,500
However, if the index breaks below the 5,850 support level on a closing basis, this pattern will be considered invalid.
IDX Composite (IHSG): Nearing the End of Wave 5Overview
Looking at the daily (1D) chart for the IDX Composite (IHSG), the index is currently undergoing a prolonged corrective phase. Based on Elliott Wave theory, we can clearly identify a bearish 5-wave impulse sequence unfolding.
Technical Breakdown
Completed Waves: We have seen the completion of waves (1) through (4). As typical in Elliott Wave structures, wave (3) was the sharpest and longest leg down. The recent lower high confirms the end of wave (4).
Current Position (Wave 5): The index is currently in the middle of a wave (5) decline, breaking down past immediate psychological levels. The current price is hovering around 6,599.
Target / Demand Zone: The downward trajectory of wave (5) is pointing toward a major demand zone, highlighted by the blue box on the chart (near the 6,000 - 6,100 psychological area). This zone aligns with previous historical support structures.
Forecast & Trading Plan
The white arrow outlines the anticipated scenario: once wave (5) fully materializes and hits the blue demand zone, we expect the downward momentum to exhaust. This area should act as a strong launchpad for a significant bullish reversal or at least a strong A-B-C upward correction.
Conclusion
For now, the short-term bias remains bearish as wave (5) completes its leg down. However, bears should be cautious, and bulls should start keeping this on their radar. Wait for a solid reversal confirmation (such as a bullish engulfing candle or high buying volume) inside the blue box before looking for long setups.
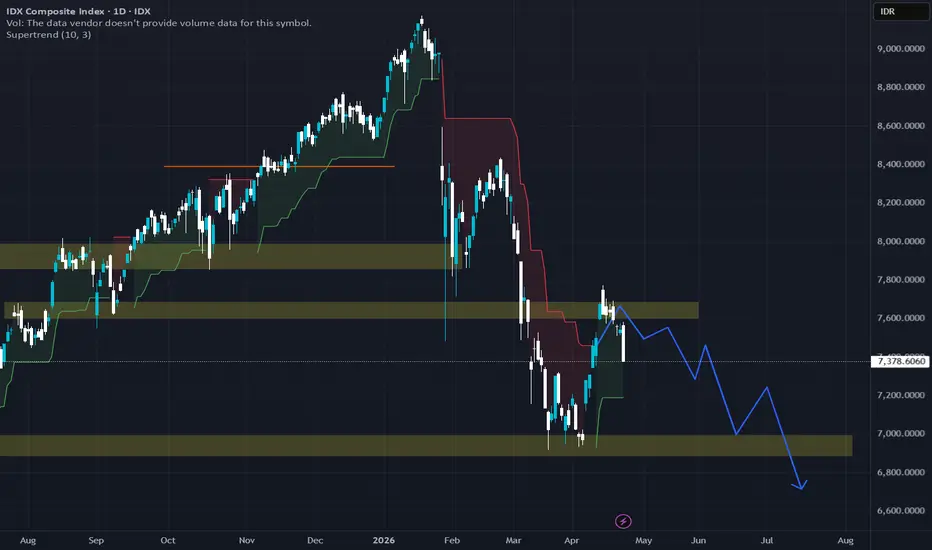
Composite / IHSG outlook in 2026 (Important description below)!Iran has agreed to a two-week ceasefire, which is expected to cause asset prices to surge sharply over the next 1–2 weeks as the market anticipates that the conflict may de-escalate or even come to an end. The IHSG has already been heavily discounted, even though Indonesia is a highly attractive economy and is projected to have one of the largest GDPs by 2045 (likely among the top five after China, India, and the U.S.),
This presents an opportunity for you to buy at very low prices, particularly in Indonesia’s key sectors such as banking—which is currently heavily discounted, including BBRI, BBCA, BMRI, and BBNI—as well as the energy, commodities, and renewable energy sectors. I believe today is the right day to hold Indonesian stocks for the very long term. (Also consider the yield you’ll receive in the future.)
lets discuss , comment below
IDX Composite (JKSE) Bad for Indonesia RupiahNews:
-Bad for IDR, It means foreigners can obtain rupiah at a lower price compared to the US dollar and can sell part of their holdings and transfer them to large companies that are still undervalued, gaining more shares through this phenomenon.
-Foreign rebalancing IDX portofolio
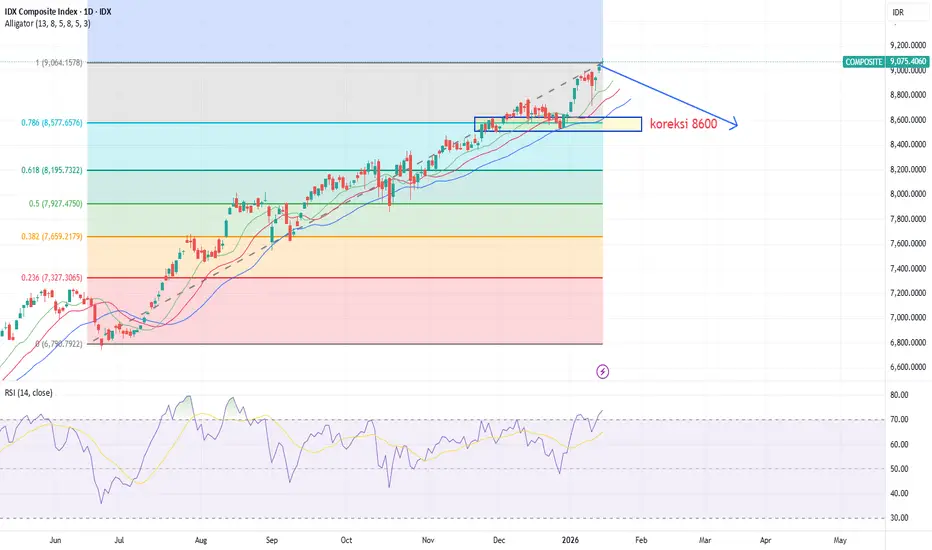
$IHSG (JKSE)The IHSG Has Strengthened over the past few weeks.I observe the formation of an abcd pattern on the weekly time frame. Based in historical data,once this pattern is completed, it is usually followed by a healthy correction. I see this healthy correction occurring at three support levels
Support 1 : 7950
Support 2 : 7550
Support 3 : 7200
Disclaimer On IDX:COMPOSITE
IDX Composite (JKSE) MSCI's Indonesia Rule Change NEWS:
MSCI is changing how it calculates the free float specifically for Indonesian shares, as it assesses that the data on public ownership has been inaccurate.
Key Changes:
The free float will be calculated by taking the lower figure between the data from company reports and the data from KSEI (which categorizes "corporate," "others," and "scrip" ownership as non-free float).
This rule will be tested until the end of 2025 and officially implemented in the May 2026 review.
MSCI is also changing its free float rounding rule, which could lower the index weight of some stocks.
Implications:
Since many Indonesian shares are owned by large corporate groups, the free float figure will decrease, potentially reducing Indonesia's overall weight in the MSCI indices.
Consequently, the potential for foreign outflows increases (due to index weight adjustments).
Four stocks are at the highest risk of being deleted from the index: CUAN, ICBP, KLBF, and INDF.
In short:
MSCI is making the free float calculation for Indonesia stricter and more realistic—the effect could trigger foreign fund outflows from several large-cap stocks as their weights are expected to fall.
Technical Analysis:
*The chart tells everything.
Indonesia’s Stock Market at a Crossroad: Will Composite Index (IIHSG Weekly Outlook: Testing the Upper Channel as Momentum Weakens
Market Overview
The Indonesia Composite Index (IHSG) has maintained a broad uptrend structure for nearly a decade, supported by the nation’s resilient macroeconomic backdrop and continued investor appetite for domestic equities. Since 2015, the index has moved within a long-term ascending channel, establishing higher highs and higher lows across major cycles.
However, as of late October 2025, IHSG is testing a critical inflection zone near the upper boundary of this long-term channel, positioned between 8,200 and 8,300. The market has shown hesitation around this area, with several sessions of profit-taking emerging after briefly touching the upper resistance line.
While the broader trend remains constructive, early signs of momentum loss are becoming visible on key technical indicators such as the MACD and Stochastic RSI, suggesting that the index may be entering a short-term cooling phase following its strong multi-month rally.
Long-Term Structure: The Channel That Defines the Trend
A glance at the weekly chart reveals that IHSG has been respecting a well-defined ascending channel since 2015. Each cycle low—seen in 2015, 2020, and 2023—was followed by an upward recovery that consistently brought prices back toward the upper channel resistance.
This channel not only defines the market’s long-term bullish rhythm but also serves as a visual gauge for potential overextension. Every time IHSG approached the top boundary, a period of consolidation or technical correction followed. The most recent move is consistent with this historical pattern: as the index touched the upper channel near 8,300, selling pressure started to emerge, indicating that investors may be locking in profits after a prolonged advance.
From a structural perspective, the primary uptrend remains intact. The support zone around 7,700–7,800 marks the midline area and is crucial for maintaining bullish momentum. A weekly close below this support could trigger a deeper retracement toward the lower band of the channel around 7,300–7,400.
As long as IHSG stays above 7,700, the medium-term outlook remains positive, but the index is now at a stage where upward progress may become more gradual and selective.
MACD: Momentum Losing Steam
The Moving Average Convergence Divergence (MACD) indicator, a key measure of market momentum, remains in the positive territory but is showing the first signs of softening. The histogram bars, which measure the difference between the MACD line and its signal line, have started to narrow. This suggests that bullish momentum, while still present, is fading in strength.
Historically, similar MACD slowdowns on the weekly timeframe have preceded sideways phases or corrective waves lasting several weeks. If the MACD line crosses below its signal line in the coming sessions, it would confirm a bearish crossover, increasing the probability of a short-term pullback.
At this stage, it’s not an outright reversal signal, rather, a warning that the rally is maturing. For swing traders and portfolio managers, this is typically a period to scale back aggressive long positions, lock in partial profits, and reassess exposure to sectors that have already priced in strong earnings growth or macro optimism.
Stochastic RSI: From Overbought to Cooling Down
Read full analysis on :
darrismanresearch com
join telegr Channel :
Saham Kita
IDX Composite (JKSE) Forecast: Q4 2025 Trend ProjectionFundamental:
-
Technical Analysis:
-This analysis was created using candle calculations multiplied by the Fibonacci golden ratio.
-There is a high potential for November 3, 2025, to be a retracement stopping point, which is close to the Full Moon phase on November 5, 2025. The Bullish trend is then expected to continue until December 29, 2025, a date close to the next Full Moon phase on January 3, 2026.
Note:
-The projected dates have a tolerance of ±1 to ±2 days.
-This analysis becomes invalid if future (market) data does not support it.
IDX:CDIA IDX:COMPOSITE
Forecasting a Halt in the IDX Composite (JKSE) DeclineFundamental Analysis:
-
Technical Analysis:
A bearish stochastic divergence has appeared on the Daily chart, signaling that a downward trend is currently taking place, the IDX Composite decline is forecast to halt or reverse direction on October 21st, aligned with the 'New Moon' lunar cycle.
Conclusion:
closely monitor the market on October 21st and ensure you have cash ready.
IDX:COMPOSITE IDX:CDIA IDX:PANI
Three Key Charts To Watch for Indonesia Right NowThe market appears to be at a significant decision point, reacting to the recent cabinet changes (especially Minister of Finance). The price action across these three key charts suggests investors are cautious.
IDX Composite (JCI): The index has pulled back from its recent highs and is now testing a critical support level around 7,448. While the longer-term trend remains bullish, a break below this support would increase the probability of a bearish reversal, signaling growing investor concern.
USD/IDR: The currency pair is pushing against a well-defined resistance at approximately 16,455. The price has been consolidating below this level for months. A decisive breakout above this ceiling would confirm Rupiah weakness and suggest a higher likelihood of capital outflows.
Indonesia 10Y Bond Yield: After a period of decline, yields are now trending upward. A move above the resistance near 6.616% would indicate that investors are selling government bonds. This is a classic sign of increasing risk aversion in the market.
In short, a breakdown of support in the JCI, combined with breakouts in the USD/IDR and bond yields, would confirm a broad-based negative sentiment from investors.
IDX Roadmap Impulsive Bullish Trend📈 IDX Roadmap — Impulsive Bullish Trend
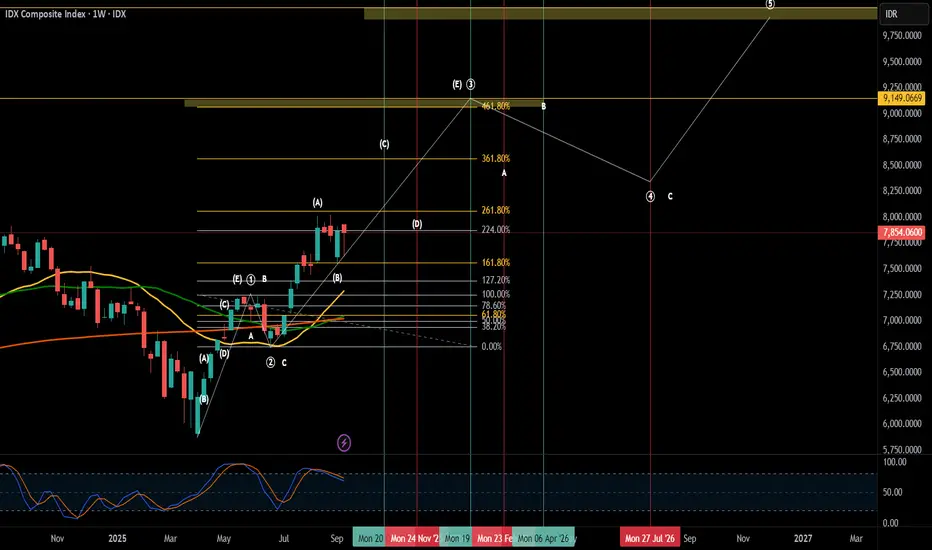
This roadmap outlines a potential impulsive bullish structure on the IDX Composite Index over the medium to long term.
The projection is based on Elliott Wave structure combined with Fibonacci Extension levels to map out possible price trajectories.
🟢 Green Vertical Lines — Vibrational Date (Bull)
Indicate potential bullish acceleration phases, aligned with wave cycle timing and supported by technical signals from moving averages and the stochastic oscillator.
🔴 Red Vertical Lines — Vibrational Date (Bear)
Indicate potential short-term corrective (bearish) phases, expected before the main bullish trend resumes.
📌 Note:
- This roadmap is not a buy/sell recommendation. It’s meant as a big-picture directional guide to help anticipate market behavior.
-Always apply risk management and look for confirmation on lower timeframes.
IDX Composite: Bullish in medium term- long termIDX is currently entering wave 2 (correction wave) with a target decline in the range of 6600-6800 (supply zone).
In my opinion, this decline is part of the move towards wave 3 (bullish wave) in the medium term.
Investment strategy:
Gradual collection of bluechip stocks in the banking sector, commodities when the JCI is corrected approaching the supply zone and Collect for a period of 1-1.5 years.
For me, the JCI has just started entering a long-term Bullish wave.
IHSG / COMPOSITE (IDX) DAILY CHART DOUBLE TOP DETECTEDIHSG going to close the gap at 65xx.. (first gap).
the worst case IHSG will close the 2nd gap (61xx) << Mostly happened.
after that we hope IHSG will start to Bullish once more.
so just wait n see for now. After IHSG closing all the gap, we can start buying all the bluchip stock like banking sector (BBRI, BBCA, BMRI, BBNI).