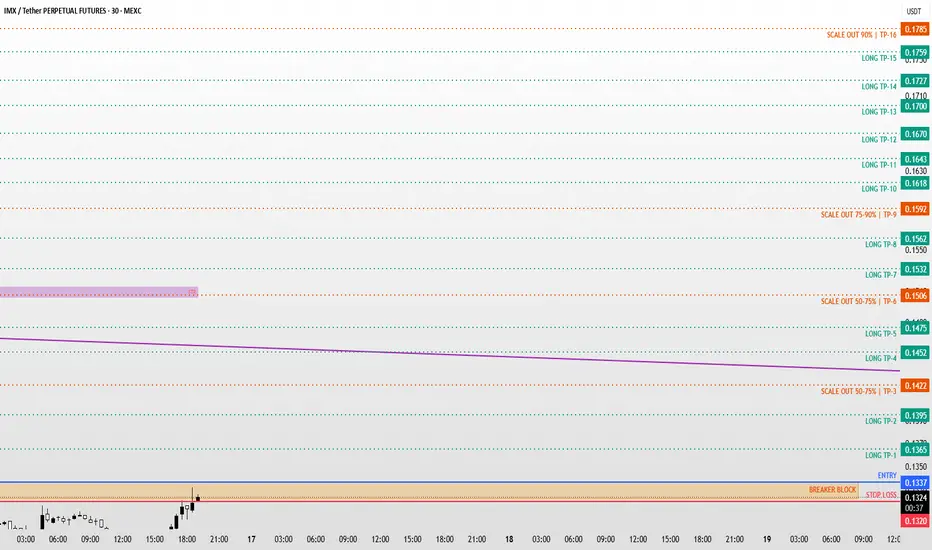
IMX / IMXUSDT Long Setup | Breaker Block ReclaimMARKET ANALYSIS
IMX is currently reacting from a key technical area highlighted on the chart.
As long as the protected support zone remains intact, the bullish market structure remains valid and higher liquidity targets may continue to attract price action.
A breakdown below the invalidation l
IMX: local squeeze with $0.15 destinationThe Macro Picture 🗺️
IMX unwound its May $0.21 highs through a steady descent that bottomed at $0.115 in early July. Since then the structure has shifted from trend to range — price is now rotating inside a $0.115–0.15 band, a volatility playground where the lows keep getting defended and the ralli
IMX 4H – Channel Breakdown Recovering Into ResistanceIMX on the 4H timeframe is currently trading around 0.1788 after breaking below the lower boundary of a descending channel near 0.1120–0.1145 in late June and recovering sharply, with price now pressing into the 0.1300–0.1310 horizontal resistance zone that defined the lower range of the prior chann
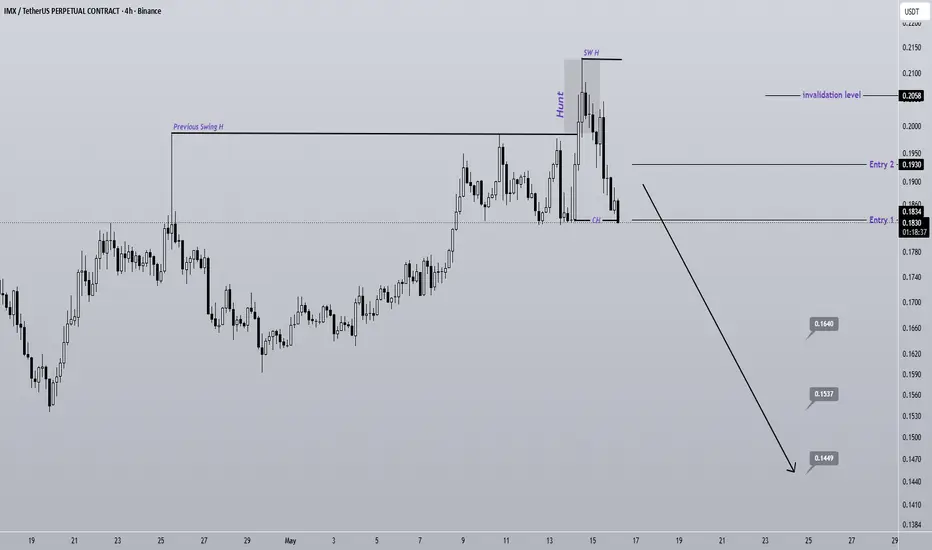
IMX Sweeps the Lows Bearish Move Incoming?One of our setups has formed on IMX. The previous swing low was hunted, followed by a reversal and the formation of a bearish CH.
Price has lost its bullish momentum. A large amount of stops and liquidity has been collected, and the price is expected to drop toward the marked targets.
We have two
IMKUSDT Forming Bullish MomentumIMKUSDT is forming a clear bullish momentum pattern, a classic bullish continuation signal that often suggests a potential breakout could be approaching in the near term. The price has been consolidating within a tightening range, indicating that selling pressure is gradually weakening while buyers
ImmutableX (IMX) Can Grow For Years, Bottom Reversal Confirmed IMXUSDT is really bullish right now. A recovery is starting to intensify after a true bear market end and bottom.
ImmutableX started its decent March 2024 after a strong bullish period. This descent was brutal and ended only recently.
The first low happened 6-February 2026 followed by a double-bot
IMX Under Pressure | Sellers Targeting Lower Levels (12H)The price structure suggests that IMX is forming a large diametric pattern, indicating a complex corrective phase rather than a simple trend. At the current stage, price action appears to be progressing within wave G, which is typically considered the final leg of this structure and carries a bearis
Immutable X (IMX) Hits Bottom · New Bull Market Starts Now!The bullish wave is out of proportion with the bear market. The last bullish wave was 682% strong lasting 182 days, six months. The bear market though hit a new all-time low and lasted two years.
If you are a bear and you see a Cryptocurrency project rising non-stop for years and hitting new all-ti
IMXUSDT 1D#IMX has broken above the descending resistance on the daily chart with strong volume. It is now facing the daily SMA50; in case of a breakout above it, the potential upside targets are:
🎯 $0.2121
🎯 $0.2612
🎯 $0.3009
🎯 $0.3406
🎯 $0.3971
🎯 $0.4690
⚠️ Always remember to use a tight stop-loss and mai
See all ideas
Summarizing what the indicators are suggesting.
Oscillators
Neutral
SellBuy
Strong sellStrong buy
Strong sellSellNeutralBuyStrong buy
Oscillators
Neutral
SellBuy
Strong sellStrong buy
Strong sellSellNeutralBuyStrong buy
Summary
Neutral
SellBuy
Strong sellStrong buy
Strong sellSellNeutralBuyStrong buy
Summary
Neutral
SellBuy
Strong sellStrong buy
Strong sellSellNeutralBuyStrong buy
Summary
Neutral
SellBuy
Strong sellStrong buy
Strong sellSellNeutralBuyStrong buy
Moving Averages
Neutral
SellBuy
Strong sellStrong buy
Strong sellSellNeutralBuyStrong buy
Moving Averages
Neutral
SellBuy
Strong sellStrong buy
Strong sellSellNeutralBuyStrong buy
Displays a symbol's price movements over previous years to identify recurring trends.