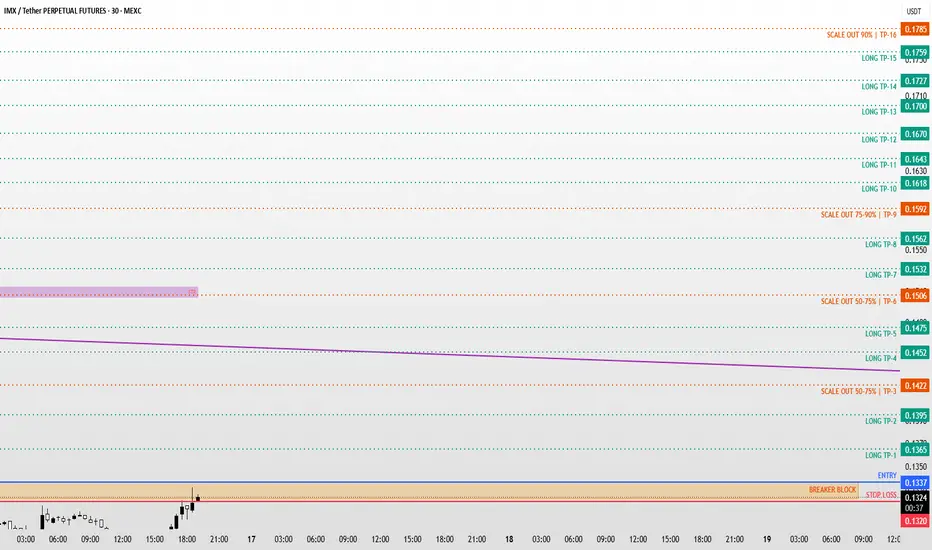
IMX / IMXUSDT Long Setup | Breaker Block ReclaimMARKET ANALYSIS
IMX is currently reacting from a key technical area highlighted on the chart.
As long as the protected support zone remains intact, the bullish market structure remains valid and higher liquidity targets may continue to attract price action.
A breakdown below the invalidation level would weaken the current bullish scenario and require a reassessment of market conditions.
📍 Entry, Stop Loss and Take Profit levels are marked directly on the chart.
━━━━━━━━━━━━━━
⚠️ DISCLAIMER
This publication is provided solely for educational and market observation purposes.
Nothing contained in this analysis should be considered financial advice, investment advice, or a recommendation to buy or sell any financial instrument.
All trading and investment decisions remain solely the responsibility of the individual trader.
Always conduct your own research and apply proper risk management before entering any position.
━━━━━━━━━━━━━━
🎯 PARALOG
▪️Crypto Market Analysis
▪️BTC Futures Signals
▪️Bitcoin & Altcoin Market Analysis
Precision • Momentum • Timing
━━━━━━━━━━━━━━
Exchange: #MEXC Futures
#bitcoin #btc #crypto #futures #technicalanalysis
In-depth trading ideas
IMXUSDT Forming Bullish MomentumIMXUSDT is forming a clear bullish momentum pattern, a classic bullish wave signal that often indicates a drop. The price has been consolidating within a narrowing range, suggesting that selling pressure is weakening while buyers are beginning to regain control. With consistent volume confirming accumulation at lower levels, the setup hints at a potential bullish breakout soon. The projected move could lead to an impressive gain of around 20% to 30% once the price breaks above the wedge resistance.
This bullish momentum pattern is typically seen at the end of downtrends or corrective phases, and it represents a potential shift in market sentiment from bearish to bullish. Traders closely watching IMXUSDT are noting the strengthening momentum as it nears a breakout zone. The healthy trading volume adds confidence to this pattern, showing that market participants are positioning early in anticipation of a reversal.
Investors' growing interest in IMXUSDT reflects rising confidence in the project's long-term fundamentals and current technical strength. If the breakout confirms with sustained buying volume, this could mark the start of a fresh bullish leg. Traders might find this a valuable setup for medium-term gains, especially as the momentum pattern completes and buying pressure continues to accelerate.
✅ Show your support by hitting the like button and
✅ Leaving a comment below! (What is You opinion about this Coin)
Your feedback and engagement keep me inspired to share more insightful market analysis with you!
IMX: local squeeze with $0.15 destinationThe Macro Picture 🗺️
IMX unwound its May $0.21 highs through a steady descent that bottomed at $0.115 in early July. Since then the structure has shifted from trend to range — price is now rotating inside a $0.115–0.15 band, a volatility playground where the lows keep getting defended and the rallies faded back toward the middle. Price sits in the lower half near $0.128 with RSI balanced around 47. With the floor established and momentum neutral, buying into the lower portion of the range rather than chasing strength is the higher-confluence play, and the path of least resistance leans back toward the upper boundary.
The Setup ⚙️
The Buy Area: The $0.12–0.128 band has absorbed the recent dips. Bulls are defending the equilibrium, and as marked on the chart, price is holding above the $0.12 local support with room to rotate higher.
The Ceiling: The $0.15 decision line caps the range. A clean reclaim flips the local structure bullish and opens the path toward the $0.16 macro resistance above.
The Range Play: The zone between $0.12 and $0.15 creates a structural playground for grid-based accumulation — staggered entries across the range capture the chop while the market decides its next macro leg.
The Roadmap: Primary target sits at $0.15 — the green roadmap points there as price works up from the support toward the range top. Invalidation: a clean daily close below $0.115 would invalidate this bullish thesis and signal a structural breakdown out of the range.
More setups in profile.
#IMX #CRYPTO #ImmutableX #Layer2 #TechnicalAnalysis
IMX 4H – Channel Breakdown Recovering Into ResistanceIMX on the 4H timeframe is currently trading around 0.1788 after breaking below the lower boundary of a descending channel near 0.1120–0.1145 in late June and recovering sharply, with price now pressing into the 0.1300–0.1310 horizontal resistance zone that defined the lower range of the prior channel structure.
The chart shows a descending channel from the May high near 0.1800, with the upper trendline connecting successive lower highs from late May through the mid-June high near 0.1540 and continuing to slope down into the 0.1340–0.1370 area currently. The lower channel trendline caught the early June low near 0.1210 before price recovered back into the channel and pushed up toward 0.1540 in mid-June, where the upper trendline rejected it cleanly. Price then sold off steadily through late June, broke below the lower channel boundary, and pushed into a low near 0.1120–0.1123 before reversing sharply. The horizontal level near 0.1300–0.1310 acted as a pivot throughout June and now sits as the first meaningful resistance above the breakdown low, with a secondary level near 0.1210–0.1220 just beneath it. Price has recovered from the breakdown low and is pressing directly into 0.1300–0.1310 from below.
The recovery off the breakdown low has been sharp but price is now back at the underside of the broken channel structure, with the descending upper trendline sitting just overhead near 0.1340–0.1370 and adding a second layer of resistance.
Key Levels To Watch
→ 0.1780–0.1800 – May high, major resistance above
→ 0.1610–0.1650 – Prior consolidation zone, resistance
→ 0.1490–0.1540 – Prior recovery high, upper channel resistance
→ 0.1340–0.1370 – Descending upper trendline, overhead resistance (dynamic)
→ 0.1300–0.1310 – Horizontal pivot, current test
→ 0.1210–0.1220 – Secondary horizontal support
→ 0.1120–0.1145 – Breakdown low, lower channel boundary
A confirmed break above 0.1300–0.1310 and a reclaim of the descending upper trendline near 0.1340–0.1370 would suggest the breakdown was a wick rather than a structural break, reopening the path toward 0.1490–0.1540 and potentially 0.1610–0.1650 on a full channel re-entry.
A rejection at 0.1300–0.1310 and a return toward 0.1210–0.1220 would keep the breakdown structure intact, and a loss of 0.1120–0.1145 on a confirmed close would confirm the channel breakdown as structural with no clear support visible beneath.
Sharp recovery off breakdown low now testing first meaningful resistance. Reclaim 0.1300–0.1310 and clear trendline near 0.1340 → breakdown invalidated, eyes on 0.1490–0.1540. Reject here → structure remains broken, loss of 0.1120 opens extended downside. Bias neutral to cautiously bullish above breakdown low. Shift bearish only on confirmed close below 0.1120–0.1145.
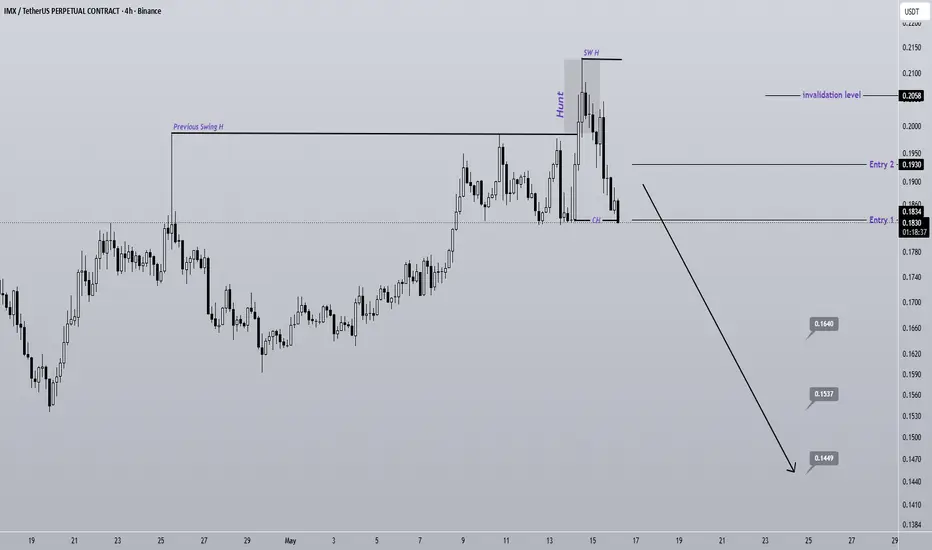
IMX Sweeps the Lows Bearish Move Incoming?One of our setups has formed on IMX. The previous swing low was hunted, followed by a reversal and the formation of a bearish CH.
Price has lost its bullish momentum. A large amount of stops and liquidity has been collected, and the price is expected to drop toward the marked targets.
We have two entry points, and the position should be entered using DCA.
Take partial profits at the first target, then move your stop to breakeven.
A daily candle close above the invalidation level will invalidate this analysis.
If you would like us to analyze a coin or altcoin for you, first like this post, then comment the name of your altcoin below.
What is your opinion about IMX?
IMKUSDT Forming Bullish MomentumIMKUSDT is forming a clear bullish momentum pattern, a classic bullish continuation signal that often suggests a potential breakout could be approaching in the near term. The price has been consolidating within a tightening range, indicating that selling pressure is gradually weakening while buyers continue to regain strength around important support levels. This type of structure commonly reflects accumulation before a stronger bullish expansion begins.
The projected breakout from this bullish momentum structure could result in a strong upward move of around 90% to 100% if the price confirms above the resistance zone with solid volume support. This pattern is frequently seen after corrective phases and may signal a shift in market sentiment from bearish to bullish.
Traders closely watching IMKUSDT are noticing strengthening momentum as the price approaches a key breakout area. The good trading volume adds confidence to the setup, showing that buyers may be accumulating positions early in anticipation of a bullish continuation move.
Growing investor interest in IMKUSDT reflects rising confidence in both its technical setup and future upside potential. If the breakout confirms with sustained buying pressure and strong follow-through momentum, this could mark the beginning of a fresh bullish wave.
✅ Show your support by hitting the like button and
✅ Leaving a comment below! (What is your opinion about this coin?)
Your feedback and engagement keep me inspired to share more insightful market analysis with you!
ImmutableX (IMX) Can Grow For Years, Bottom Reversal Confirmed IMXUSDT is really bullish right now. A recovery is starting to intensify after a true bear market end and bottom.
ImmutableX started its decent March 2024 after a strong bullish period. This descent was brutal and ended only recently.
The first low happened 6-February 2026 followed by a double-bottom 1-April. Needless to say, the 1-April low was the last challenge of support. We can now experience long-term growth.
The bear market starts from a major high, a new all-time high, March 2024.
The bull market starts from a major low, a new all-time low, February 2026.
The bear market lasted two years; the bull market can last several years.
There is room for the bull market to last longer compared to the bear market. The reasons I have explained many times in previous articles.
Today IMX hit the highest price since the final bottom crash, since 28-January. More than three months of bearish action have been recovered.
We can now expect long-term growth. It is already happening...
From this bottom, we grow.
Namaste.
IMX Under Pressure | Sellers Targeting Lower Levels (12H)The price structure suggests that IMX is forming a large diametric pattern, indicating a complex corrective phase rather than a simple trend. At the current stage, price action appears to be progressing within wave G, which is typically considered the final leg of this structure and carries a bearish bias.
Wave G is expected to unfold in a controlled downward move, and based on the current projection, we have identified three key downside targets, all of which are clearly marked on the chart. These levels can act as potential reaction zones where price may slow down or temporarily reverse.
As long as the defined supply zone remains intact and price fails to break above it, the bearish scenario remains valid, increasing the probability of continuation toward the projected targets. A strong rejection from this area would further confirm seller dominance.
From a risk management perspective, it is recommended to secure the position by moving to breakeven (risk-free) once the first target is reached. This allows you to stay in the trade while protecting your capital against unexpected reversals.
However, traders should remain cautious: a confirmed daily candle close above the invalidation level would invalidate this entire bearish outlook and suggest a shift in market structure. In that case, reassessment of the scenario would be necessary.
If you have a symbol you want analyzed, first hit the like button and then comment its name so I can review it for you.
Do you also think IMX is bearish?
Immutable X (IMX) Hits Bottom · New Bull Market Starts Now!The bullish wave is out of proportion with the bear market. The last bullish wave was 682% strong lasting 182 days, six months. The bear market though hit a new all-time low and lasted two years.
If you are a bear and you see a Cryptocurrency project rising non-stop for years and hitting new all-time highs, wouldn't you become skeptical at some point?
You see overbought RSI and MACD, you start to see very strong bearish divergences and other sectors of the market start to crash. Wouldn't you prepare to short?
Well, the bear market is out of proportion with the last bullish period. The oscillators went deep red with extreme oversold conditions. A large portion of the market is rising and growing strongly; I can easily predict a recovery happening next. Not only a recovery, a new bull market.
Immutable X (IMXUSDT) hit a new all-time low recently with major reversal signals starting to crop up all over the place. I can see this project rising strong, years of sustained growth.
You've been warned. You are loved and cherished.
Thank you for reading.
Namaste.
IMXUSDT 1D#IMX has broken above the descending resistance on the daily chart with strong volume. It is now facing the daily SMA50; in case of a breakout above it, the potential upside targets are:
🎯 $0.2121
🎯 $0.2612
🎯 $0.3009
🎯 $0.3406
🎯 $0.3971
🎯 $0.4690
⚠️ Always remember to use a tight stop-loss and maintain proper risk management.
IMX/USDT — Short After Failed Rally, Targeting the LowsIMXUSDT Perpetual
IMX rallied hard from 0.13 to 0.15 — a strong move driven by the broader market bounce. But the rally failed to hold. Price got rejected at 0.15 and has been selling off aggressively, now sitting at 0.1389 and breaking below the mid-range support.
A signal flagged this short. The structure tells the story: the move up was impulsive but the follow-through died at resistance. Now we're seeing lower highs forming and the sell-off candles have more conviction than the bounce candles. That's trend shift behavior.
Entry: 0.1389
Stop Loss: 0.1460 — above the recent lower high and resistance zone
TP1: 0.1310 — previous support shelf
TP2: 0.1280 — extended target at the range low
R:R: ~1:1.1 to TP1, ~1:1.5 to TP2.
Invalidation: Close above 0.1460 — buyers reclaim structure, short is dead.
Signal fired. We took it. Update coming.
ImmutableX: is it time to wake this sleeper? key levels to watchImmutableX
Who’s still watching this sleeper while the market chases shiny memes? L2 gaming narratives are heating up again according to industry sources, and today there was fresh buzz around new ecosystem launches, which usually drags attention back to IMX. Price is still buried in the lows, so every little rotation of capital into gaming coins suddenly matters a lot.
On the 4H chart we’re sitting just above local demand with a clear volume node around this 0.14 area acting as a magnet. RSI cooled off hard from overbought, but it’s still holding mid‑range instead of crashing, which tells me this looks more like a pullback than a full rug… for now. If buyers defend this shelf, I’m leaning toward a bounce into the 0.15‑0.155 supply block where we’ve got heavy past selling.
My plan: I like starter longs as close as possible to this support, targeting that 0.15+ zone while trailing stops under the recent swing low. If we lose that green support line cleanly with volume, I flip the script and expect a deeper sweep into the lower range for bargain hunters. I might be wrong, but this is one of those spots where the risk is tiny and the narrative can wake up fast. ✅
IMXUSDT — Descending Trendline: Breakout or Final Rejection?On the IMX/USDT 1D timeframe, price action clearly remains in a mid-to-long term downtrend, characterized by consistent lower highs and lower lows since the previous peak.
Currently, price is approaching a critical zone:
Testing the descending trendline resistance (yellow line)
Holding above a strong support area around 0.129 – 0.150
Forming a tight consolidation (compression) after a prolonged decline
This type of structure ხშირად precedes a major move (expansion phase).
---
📐 Pattern Formation
1. Descending Triangle / Falling Structure
Downward sloping trendline acting as dynamic resistance
Horizontal support at the bottom
Indicates ongoing selling pressure
2. Potential Accumulation Base
Sideways movement below resistance may signal accumulation
Volume (if confirmed) tends to gradually increase
3. Breakout Setup
Price is approaching the apex of the structure
A breakout is likely in the near term
---
🟢 Bullish Scenario
Bullish confirmation occurs if:
Price breaks and closes above the trendline
Breaks key resistance levels:
0.185
0.217
Next major target: 0.300
Additional confirmation:
Successful retest of the trendline as support
Increasing volume during breakout
📈 Potential Targets:
Short term: 0.185
Mid term: 0.217
Major resistance: 0.300
👉 This breakout could mark the early stage of a trend reversal.
---
🔴 Bearish Scenario
Bearish continuation if:
Price fails to break the trendline
Strong rejection from resistance
Support at 0.129 breaks down
📉 Downside Targets:
Breakdown below 0.129 opens room for further decline
Confirms continuation of the bearish structure
👉 This would validate that the downtrend is still intact.
---
⚖️ Conclusion
IMX is currently in a key decision zone.
Trendline breakout = reversal potential
Rejection + breakdown = continuation downward
Setups like this often lead to strong impulsive moves, so waiting for confirmation is crucial rather than entering prematurely.
---
📌 Key Levels
Support: 0.129 – 0.150
Resistance: 0.185 – 0.217 – 0.300
Dynamic Resistance: Descending Trendline
#IMX #IMXUSDT #CryptoAnalysis #TechnicalAnalysis #Altcoins
#CryptoTrading #BreakoutSetup #Trendline #DescendingTriangle
#BullishScenario #BearishScenario #CryptoSignals
IMXUSDT - Bull LeanIMXUSDT is printing 0.1664 spot against 0.1658 futures with futures volume at 167.36M dwarfing 42.26M on spot — a 4x imbalance generating 27.85M in futures dollar flow against only 7.03M real spot money. Spot:Fut reads Normal but the asymmetry confirms futures remain the dominant price-setting mechanism. Premium is -0.36% backwardation with yield at -395% APY on the -1.3 sigma bull side, a meaningful cost to holding longs that implies market makers are positioned short and collecting from the long side. Spread is only 6.5% Tight — price is still close to mean, which is notable given the structural damage visible in the signal board.
The signal board gives a deceptive headline. Total is 32:23 out of 112 for a Tight BULL bias at only 6.47% edge and 1.14x confidence — barely above parity. Clarity is 49%. Candle is 13:1 bullish and Engulf is 10:0, providing short-term momentum optics. But the structural signals tell a completely different story. EMA is 0:10 — every single EMA signal across all timeframes is bearish, a full structural bear alignment that contradicts the headline bias. Ichi TK is 2:5 and SS/DD is 1:8, both confirming distribution dominance. C>T is a dead neutral 7:7. The squeeze has been coiling for 32 bars and is IMMINENT with BW at 21.32% Normal, but the momentum tag reads Bear Down — the compression is loading for a bearish resolution, not a bullish one.
Volume Z-scores are the most constructive element in the panel. Spot Z is 1.65 Strong, Futures Z is 0.62 Active, and F+S Z is 0.78 Active. SpotZ 1:5 shows 1.65 against 0.79 with an accelerating composite of 0.86 and double up arrows — spot volume is building genuine momentum. Spot Momentum is Expanding Up at 204.4% Normal. Bull:Bear Z is 1.63 against -0.73 reading Bull Lean — the order flow has a real bullish tilt at the volume level that contrasts sharply with the structural bear signals. This internal divergence between volume flow and trend structure is the defining tension in this setup.
The leverage story is extraordinary. Leverage collapsed from an all-time maximum of 48.33x to just 3.95x in the span of 16 bars — a near-total deleveraging event in almost no time. Percentile sits at the 5.6th Floor, meaning speculative positioning has been completely flushed. Price is at 3.1% of its historical range between 0.1448 and 0.851, sitting at Bottom. AT Min was 1.33x recorded 839 bars ago, providing the long-run floor reference. This kind of rapid leverage collapse often precedes a structural recovery — but only when accompanied by genuine accumulation, which has not yet materialized here.
OBV Z is -1.19 with a confirmed Inflow trend — negative on the historical Z-score but actively reversing higher. The warning is OBV Divergence flagging Spread Divergence, meaning price and OBV are moving in different directions at the spread level. No whale activity and no liquidations are present. Squeeze Divergence and Market read Normal. The deleveraging is complete but the accumulation confirmation has not arrived.
The honest read: IMXUSDT is caught between two competing realities. The leverage floor, strong spot volume acceleration, and Bull Lean order flow suggest the worst of the selling is over. But EMA 0:10, SS/DD 1:8, and a squeeze coiling with Bear Down momentum describe an asset that has not yet found genuine structural support. The 16-bar leverage wipeout is dramatic enough to respect as a potential capitulation event, but OBV Spread Divergence and the full EMA bear stack demand patience. The squeeze resolution is the critical trigger — if it fires to the upside with spot volume confirming, the leverage floor and bottom price location create a compelling recovery case. If it fires down into an already-depleted market, the next support is significantly lower.
Is That Crypto Pump Real? Data Says No. Here's Why.
Stop Losing Money to Fake Volume. Find Real Moves Now.
Trade the REAL Crypto Volume. Stop Getting Faked Out.
Immutable X (IMX): dip buying opportunity? key levels to watchImmutable X
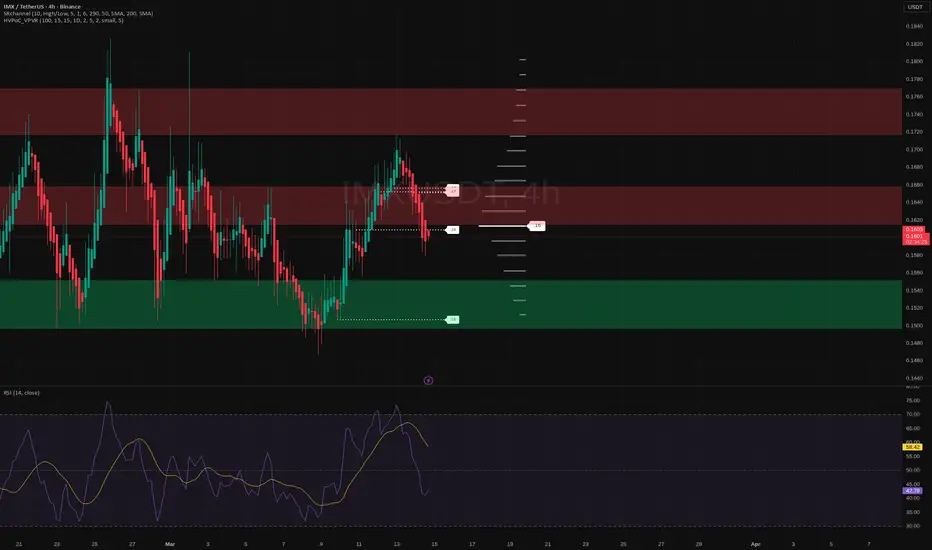
IMX is back on my radar – are the bulls about to get a discount entry? According to market chatter, interest around scalable gaming chains is heating up again, but IMX has been quietly retracing after its recent pop. Today we saw sellers step in near the 0.1620 area, right inside a fat 4H supply zone on my chart, while RSI rolled over from the mid 60s.
On the 4H chart I’m leaning short in the near term. Price rejected the upper red zone and is now sliding toward the green demand block around 0.1520 0.1480, with volume tapering on the way down – classic “drift lower into support” behavior. If gaming sentiment cools a bit more, I expect a sweep of lows into that green box before any serious bounce.
My base plan: look for buyers to show up inside 0.1520 0.1480 and then a potential rotation back toward 0.1600 0.1650. If price instead reclaims and holds above 0.1660, that kills the short idea and opens the door to a run at the higher supply around 0.1750. I might be wrong, but for now I’m patiently waiting for that dip into demand rather than chasing candles up here.
Web3 Gaming buy: $IMX "Increasing the affordability, speed, and security of transactions, Immutable X is scaling the Ethereum NFT economy with zk-Rollup technology."
They are currently a dominant web3 gaming infrastructure project especially after partnering with Polygon.
Here's a good recent interview IMX founder: podcasts.apple.com
Web3 gaming narrative is strong. I will be buying CRYPTOCAP:IMX on pullbacks, and expect there may be some resistance overhead at the weekly OB marked on the chart.
Happy Trades,
CD
IMX: accumulation alert! key levels and targets for todayIMX - still on your watchlist or did you already bury it with the other bagholds? While majors chop, gaming and L2 names stay in the spotlight according to market chatter, and IMX keeps coming up around new game launches and ecosystem updates. Price has been smashed for weeks, so any sign of accumulation on the 4H starts to look spicy.
On the 4H chart I see a tight base between roughly 0.162-0.176 sitting right on a high-volume node from the profile. RSI cooled off from overbought but is still holding above 50 - classic rest after a first impulsive bounce. As long as that lower white support zone holds, I’m leaning to the long side, expecting a push toward 0.19-0.205 as the next liquidity pocket.
My plan: look for longs closer to the bottom of the range with invalidation under 0.16, aiming first at 0.19 and then 0.22 where the next big supply zone starts. If 0.16 breaks on strong volume, I assume the bounce is fake and a slide back to 0.15-0.145 is on the table, so I step aside. I might be wrong, but right now the risk-reward from this base looks better betting on a squeeze up than trying to short into support. ✅
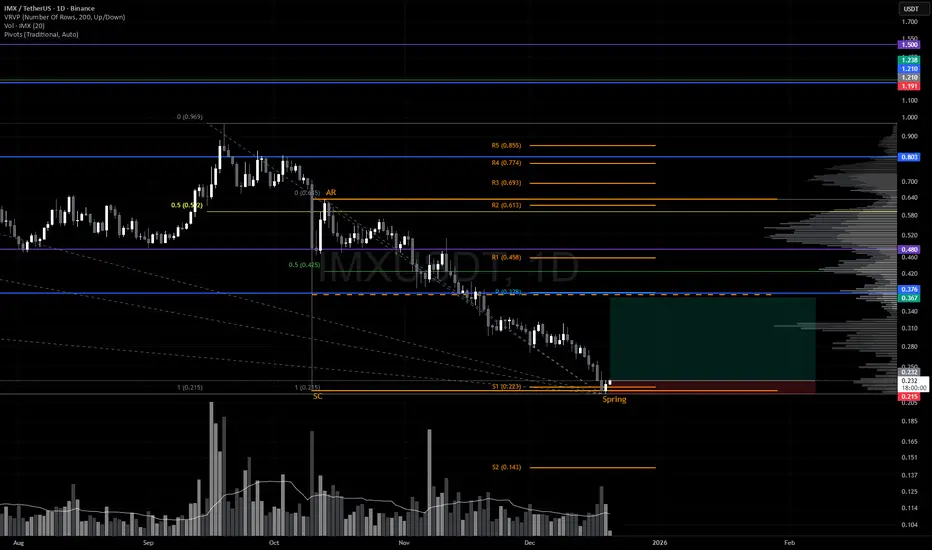
Relief rally Inbound? IMX is shaping up for a potential reversal.
After the aggressive October 10 sell‑off, price responded with a clean Automatic Rally (AR) before rolling over into a controlled pullback. This latest dip appears to be sweeping the October 10 lows, and the December 19 bullish engulfing candle is the first meaningful sign of demand stepping back in.
Crucially, price closed back inside the prior range, which keeps the structure constructive. While heavier volume on the reversal would’ve added confidence, the low‑volume nature of the sweep actually supports a spring narrative — supply has been drying up for weeks, and there’s been no evidence of aggressive selling pressure. That’s exactly what you want to see heading into a potential Wyckoff spring.
Trade Scenario
Initial TP would be just below the range EQ which lines up with the yearly pivot and 50% of the range retracement. From here, if the price can close, hold and form higher lows above this level, would strongly suggest that a bottom is in. The next meaningful upside target sits around $0.58, where prior resistance and structural alignment converge.
Market Context
A surprising number of alts are printing similar spring‑like structures right now:
• Washed‑out lows
• Diminishing volume
• Reclaims back into range
• Early signs of demand returning
IMX After a 90% Dump — This Level Matters Most 📌 CRYPTOCAP:IMX has seen a massive dump from ~$3.5 to ~$0.2 since March 2024 📉
📌Price has been rejected 3 times from the descending trendline, showing strong selling pressure from higher levels ❌
📌Currently, price is consolidating near a strong green support zone . This zone has held price multiple times before ✅
📌For price to move up:
✔️ Support zone must hold strongly
✔️ A clean breakout above the trendline is needed
📌If both conditions are met, trend reversal can start 🚀
$imxfor decades nothing happens and then in week decade happens !!
thats how i feel with dominance nearing 57% level once we loose that IF we do then everything gets fully sent
this one has been holding .20 zone has 4 major levels to flip before it goes ape shall update ltf if anyone fancies watching for a dip before weekly close
bitty above $100 for yealry or below ? tbc