#IMXUSDT Oversold RSI Signals a Potential Bullish Reversal#IMX
IMX is currently trading within a descending price channel on the daily timeframe, following a pattern similar to a previous market structure. The price is now approaching a major support zone above the $0.0800 level.
At the same time, the Relative Strength Index (RSI) has dropped to 28, indicating oversold conditions and potentially signaling that the price may be approaching a possible rebound.
For the bullish scenario to materialize, we need to see strong buying momentum accompanied
immutable X/USD Tether Spot
No trades
No trades
In-depth trading ideas
Immutable X (IMX) Bottom & 2027 TargetsMarch 2024, that's the last bit of any bullish action on this project, a long-time ago. Since September 2023, no bullish impulse present on the chart—more than three years.
Present terms, IMXUSDT has been trading within the bear-market bottom pattern for almost nine months. From this bottom we grow.
The same ending diagonal bullish reversal pattern from 2023 has been repeated in 2026, now we know exactly what to expect. A major rise and bullish wave.
In 2023, the ending diagonal started in Ma
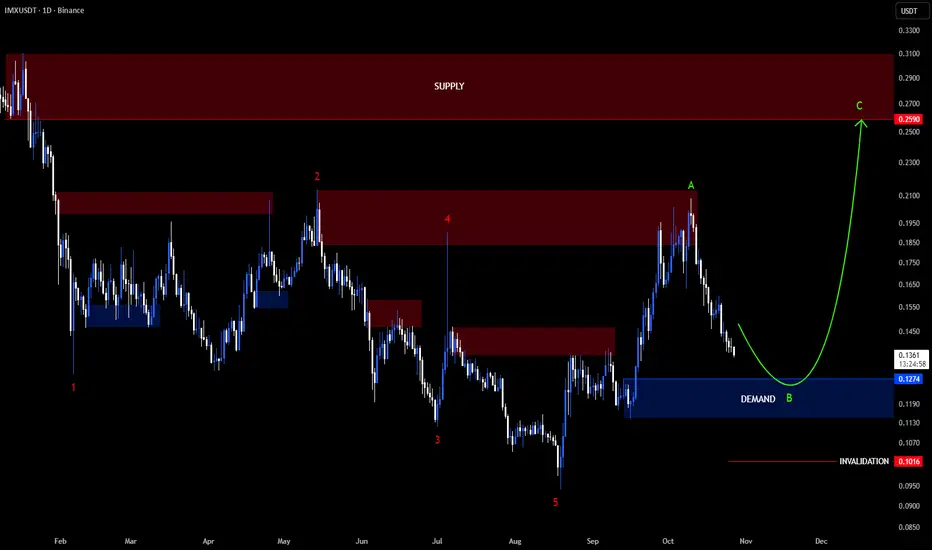
IMX analysis 1DIMX appears to have completed a five-wave bearish correction and is now developing an ABC bullish structure.
the price is now declining towards the $0.1274 demand area, where wave B could be completed.
For the target of wave C, we will use the supply area at $0.2590.
This analysis is invalidated if the price falls below $0.1016.
IMX - Recovery or Bull Trap?Based on the IMX/USDT chart on the 4D timeframe, the price is still moving within a Descending Channel that has formed since the peak around $2.25. This pattern indicates that the primary trend remains bearish, characterized by a series of *lower highs* and *lower lows*.
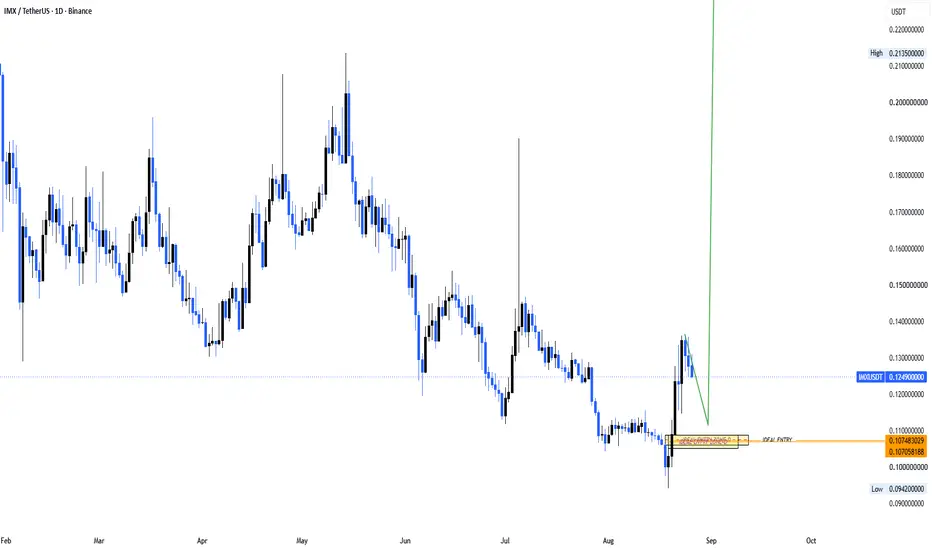
📈 However, after reaching the lower area of the channel and recording a low around $0.0942, the price has started to recover significantly toward the $0.1867 area.
This recovery opens the possibility of further upside. However
IMX/USDT H2: Testing the upper boundary of the range🎯 TP1: $0.137162 (+3.28%) │ TP2: $0.141524 (+6.57%)
🛑 SL: $0.120750 (-9.07%) │ R/R: 1 : 0.72
⚠️ Stop is wider than TP2 target (R/R < 1) — the closer target is hit more often, but adjust position size according to the stop loss
FUNDAMENTAL BACKGROUND
IMX is moving in line with the broader crypto market recovery following recent BTC and ETH gains. The lack of project news shifts focus to technical factors and altcoin correlation. The Fear & Greed Index at 41 confirms moderately positive sentiment
IMX/USDT H2: Upward impulse amid general growth🎯 TP1: $0.129664 (+5.33%) │ TP2: $0.134587 (+9.33%)
🛑 SL: $0.112657 (-8.48%) │ R/R: 1 : 1.1
⚠️ SL is placed beyond the nearest candle tails to reduce the risk of accidental triggering
FUNDAMENTAL BACKGROUND
IMX is moving in line with the general altcoin season, fueled by the growth of Bitcoin and Ethereum. The lack of its own catalysts is offset by strong risk appetite in the crypto market. The macro backdrop remains favorable: a weakening dollar and soft expectations for the Federal Reserve's
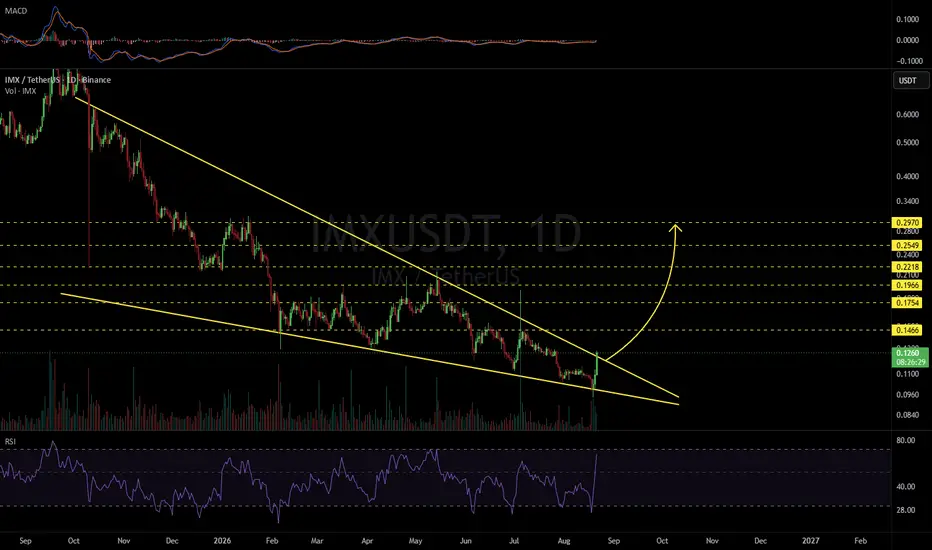
IMXUSDT 1D#IMX is trading within a falling wedge pattern on the daily timeframe and is on the verge of breaking out above it. Keep a close eye on the price action. In case of a confirmed breakout, the potential upside targets are:
🎯 $0.1466
🎯 $0.1754
🎯 $0.1966
🎯 $0.2218
🎯 $0.2549
🎯 $0.2970
⚠️ Always use a tight stop-loss and apply proper risk management.
IMX/USDT H1: On a bounce given the current oversold condition🎯 TP1: $0.098300 (+2.18%) │ TP2: $0.102400 (+6.44%)
🛑 SL: $0.090564 (-5.86%) │ R/R: 1 : 1.1
⚠️ SL is placed beyond the nearest candle tails to reduce the risk of accidental triggering
FUNDAMENTAL BACKGROUND
The asset is moving in line with the broader crypto market without its own catalysts. Bitcoin remains under pressure from ETF outflows, creating a negative backdrop for altcoins. The Fear & Greed Index in the 38–41 range confirms investor caution. No significant macro releases are expected i
IMXUSDT Forming Bullish MomentumIMXUSDT is forming a clear bullish momentum pattern, a classic bullish wave signal that often indicates a drop. The price has been consolidating within a narrowing range, suggesting that selling pressure is weakening while buyers are beginning to regain control. With consistent volume confirming accumulation at lower levels, the setup hints at a potential bullish breakout soon. The projected move could lead to an impressive gain of around 20% to 30% once the price breaks above the wedge resistan
IMX: local squeeze with $0.15 destinationThe Macro Picture 🗺️
IMX unwound its May $0.21 highs through a steady descent that bottomed at $0.115 in early July. Since then the structure has shifted from trend to range — price is now rotating inside a $0.115–0.15 band, a volatility playground where the lows keep getting defended and the rallies faded back toward the middle. Price sits in the lower half near $0.128 with RSI balanced around 47. With the floor established and momentum neutral, buying into the lower portion of the range rathe
IMX 4H – Channel Breakdown Recovering Into ResistanceIMX on the 4H timeframe is currently trading around 0.1788 after breaking below the lower boundary of a descending channel near 0.1120–0.1145 in late June and recovering sharply, with price now pressing into the 0.1300–0.1310 horizontal resistance zone that defined the lower range of the prior channel structure.
The chart shows a descending channel from the May high near 0.1800, with the upper trendline connecting successive lower highs from late May through the mid-June high near 0.1540 and co
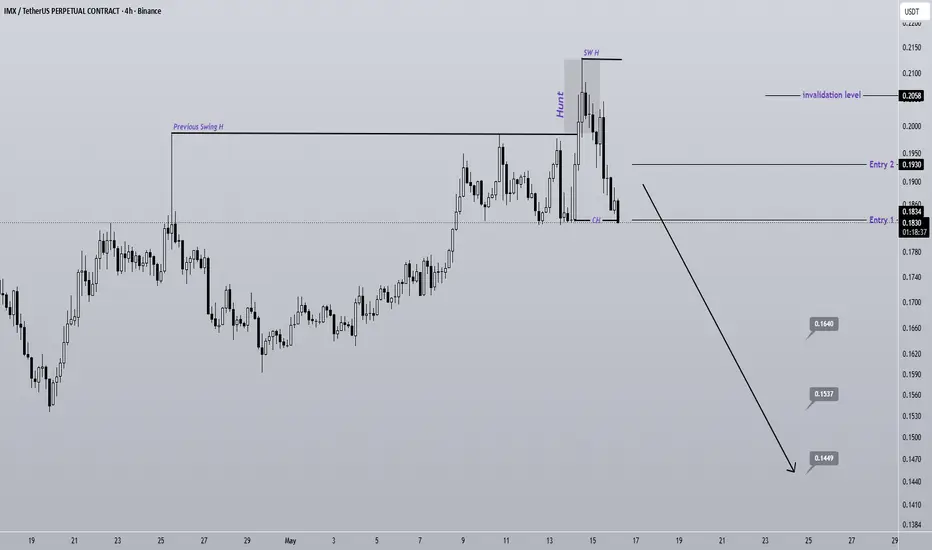
IMX Sweeps the Lows Bearish Move Incoming?One of our setups has formed on IMX. The previous swing low was hunted, followed by a reversal and the formation of a bearish CH.
Price has lost its bullish momentum. A large amount of stops and liquidity has been collected, and the price is expected to drop toward the marked targets.
We have two entry points, and the position should be entered using DCA.
Take partial profits at the first target, then move your stop to breakeven.
A daily candle close above the invalidation level will invalid
IMKUSDT Forming Bullish MomentumIMKUSDT is forming a clear bullish momentum pattern, a classic bullish continuation signal that often suggests a potential breakout could be approaching in the near term. The price has been consolidating within a tightening range, indicating that selling pressure is gradually weakening while buyers continue to regain strength around important support levels. This type of structure commonly reflects accumulation before a stronger bullish expansion begins.
The projected breakout from this bullish
ImmutableX (IMX) Can Grow For Years, Bottom Reversal Confirmed IMXUSDT is really bullish right now. A recovery is starting to intensify after a true bear market end and bottom.
ImmutableX started its decent March 2024 after a strong bullish period. This descent was brutal and ended only recently.
The first low happened 6-February 2026 followed by a double-bottom 1-April. Needless to say, the 1-April low was the last challenge of support. We can now experience long-term growth.
The bear market starts from a major high, a new all-time high, March 2024.
The
IMX Under Pressure | Sellers Targeting Lower Levels (12H)The price structure suggests that IMX is forming a large diametric pattern, indicating a complex corrective phase rather than a simple trend. At the current stage, price action appears to be progressing within wave G, which is typically considered the final leg of this structure and carries a bearish bias.
Wave G is expected to unfold in a controlled downward move, and based on the current projection, we have identified three key downside targets, all of which are clearly marked on the chart. T
Immutable X (IMX) Hits Bottom · New Bull Market Starts Now!The bullish wave is out of proportion with the bear market. The last bullish wave was 682% strong lasting 182 days, six months. The bear market though hit a new all-time low and lasted two years.
If you are a bear and you see a Cryptocurrency project rising non-stop for years and hitting new all-time highs, wouldn't you become skeptical at some point?
You see overbought RSI and MACD, you start to see very strong bearish divergences and other sectors of the market start to crash. Wouldn't you p
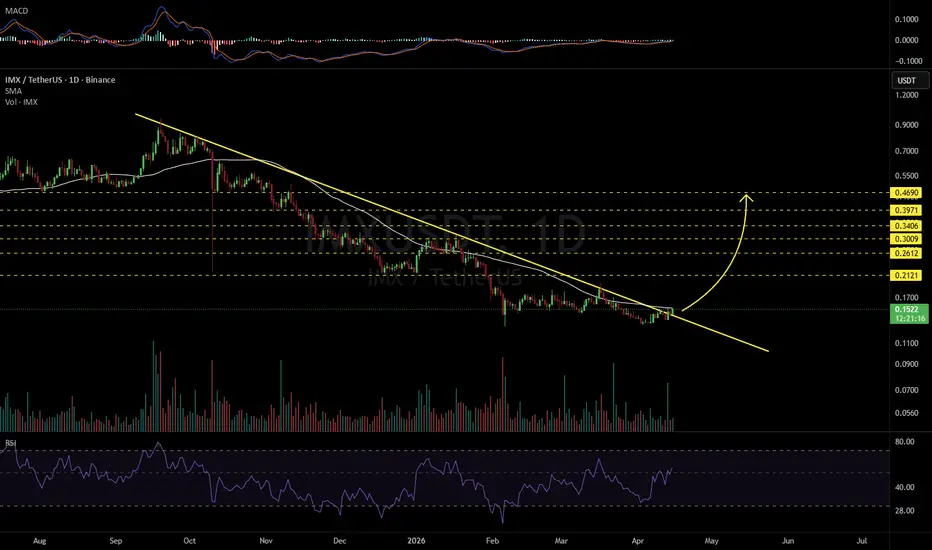
IMXUSDT 1D#IMX has broken above the descending resistance on the daily chart with strong volume. It is now facing the daily SMA50; in case of a breakout above it, the potential upside targets are:
🎯 $0.2121
🎯 $0.2612
🎯 $0.3009
🎯 $0.3406
🎯 $0.3971
🎯 $0.4690
⚠️ Always remember to use a tight stop-loss and maintain proper risk management.
IMX/USDT — Short After Failed Rally, Targeting the LowsIMXUSDT Perpetual
IMX rallied hard from 0.13 to 0.15 — a strong move driven by the broader market bounce. But the rally failed to hold. Price got rejected at 0.15 and has been selling off aggressively, now sitting at 0.1389 and breaking below the mid-range support.
A signal flagged this short. The structure tells the story: the move up was impulsive but the follow-through died at resistance. Now we're seeing lower highs forming and the sell-off candles have more conviction than the bounce can
ImmutableX: is it time to wake this sleeper? key levels to watchImmutableX
Who’s still watching this sleeper while the market chases shiny memes? L2 gaming narratives are heating up again according to industry sources, and today there was fresh buzz around new ecosystem launches, which usually drags attention back to IMX. Price is still buried in the lows, so every little rotation of capital into gaming coins suddenly matters a lot.
On the 4H chart we’re sitting just above local demand with a clear volume node around this 0.14 area acting as a magnet. RSI
IMXUSDT — Descending Trendline: Breakout or Final Rejection?On the IMX/USDT 1D timeframe, price action clearly remains in a mid-to-long term downtrend, characterized by consistent lower highs and lower lows since the previous peak.
Currently, price is approaching a critical zone:
Testing the descending trendline resistance (yellow line)
Holding above a strong support area around 0.129 – 0.150
Forming a tight consolidation (compression) after a prolonged decline
This type of structure ხშირად precedes a major move (expansion phase).
---
📐 Pattern
IMXUSDT - Bull LeanIMXUSDT is printing 0.1664 spot against 0.1658 futures with futures volume at 167.36M dwarfing 42.26M on spot — a 4x imbalance generating 27.85M in futures dollar flow against only 7.03M real spot money. Spot:Fut reads Normal but the asymmetry confirms futures remain the dominant price-setting mechanism. Premium is -0.36% backwardation with yield at -395% APY on the -1.3 sigma bull side, a meaningful cost to holding longs that implies market makers are positioned short and collecting from the lo