#INJUSDT — Holding the Last Fortres, Recovery or Final Break#INJ
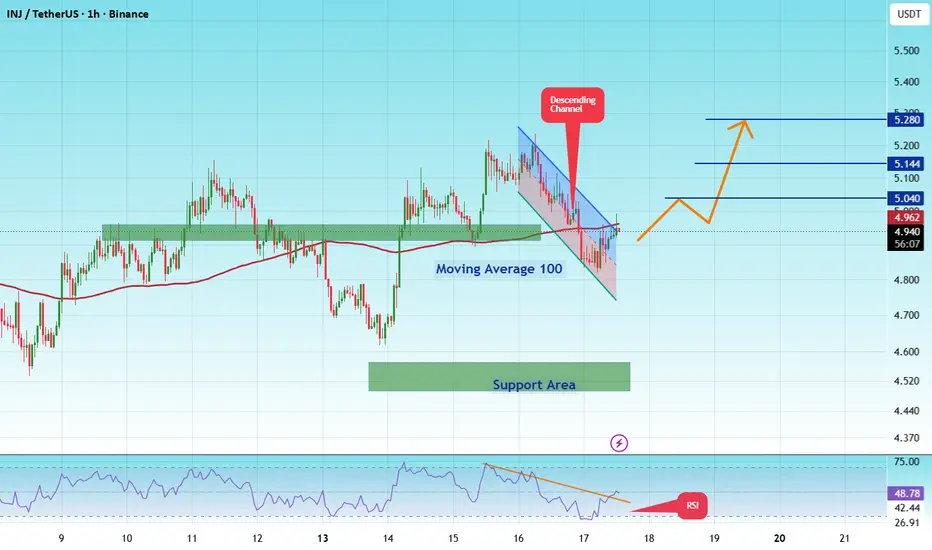
The price is moving within a descending channel on the 1-hour timeframe and has reached the lower boundary. It is now poised for a bounce and is expected to retest this boundary.
The Relative Strength Index (RSI) indicates a downward trend, which is likely to continue given the overbought conditions.
There is a key support zone in green at 4.66, and the price has bounced off this zone several times, making it a strong support level.
The price is trending towards the 100-period moving average, which we are approaching. This trend supports an upward move.
Entry Price: 4.92
First Target: 5.02
Second Target: 5.14
Third Target: 5.28
Stop Loss: At the resistance zone in green
Remember this simple rule: Money Management.
Any questions? Please leave a comment.
Thank you.
In-depth trading ideas
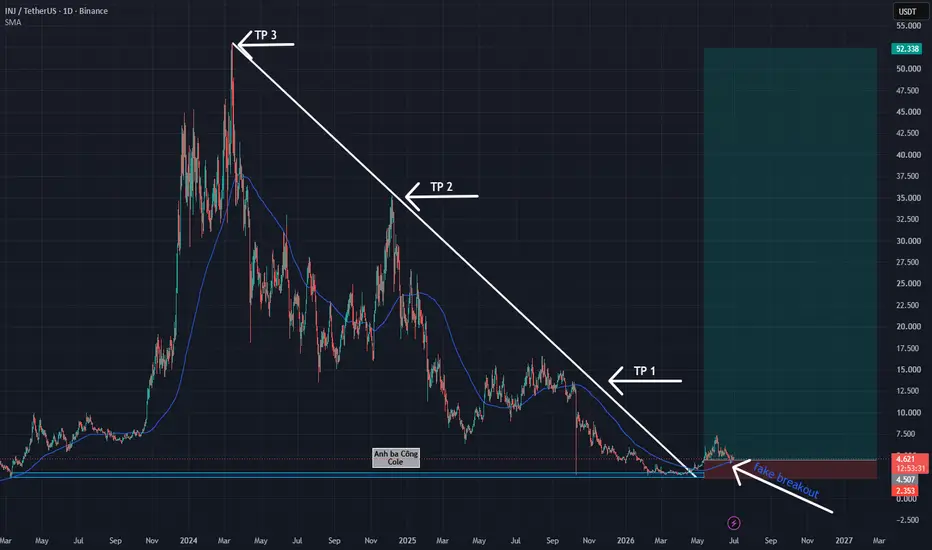
INJ: Technical Structure Holds Key Support Floor INJ: Technical Structure Holds Key Support Floor – Smart Capital Allocation Strategy Amid Quiet Volume
Injective (INJ) is holding its long-term recovery framework remarkably well following a successful liquidity sweep. Looking at the visual data on the daily chart , the recent price dip beneath the lower support baseline was swiftly validated as a fake breakout (fakebreak). Buying interest immediately stepped in to absorb supply, allowing the price action to quickly reclaim and hug the upper side of the dynamic MA100 trendline resistance. This price behavior indicates that buyers maintain a structural upper hand.
Although core technical indicators consistently point toward a continued upside scenario, the broader market context has yet to enter a genuinely hype-driven state. The temporary absence of aggressive volume keeps short-term price momentum relatively subdued. Consequently, the current price cluster does not mark the single best entry window to rush into leveraged short-term positions.
Under these market conditions, we can map out two optimal capital allocation approaches. The premier safe strategy is to build direct asset ownership (Spot) around current prices, protecting capital while avoiding ongoing holding fees during prolonged accumulation. For leverage traders (Long), the smartest approach is to remain patient on the sidelines, waiting for a decisive breakout candle to print a fresh peak to confirm institutional momentum before entering.
Disclaimer: This is not financial advice, DYOR.
INJ/BTC showing signs of breakoutSeveral fractals combining indicate a breakout for Injective against BTC.
1 - Impulse move breaking PA out of downtrend.
2 - PA holding EMA21(W) as support.
3 - MACD on verge of breaching '0', indicating that price action will be in a bullish zone.
4 - Shows a possible wave 2 Elliot wave count being completed, with a Wave 3 EW starting (the most bullish of waves).
INJ: local squeeze with $6.383 destinationThe Macro Picture 🗺️
INJ unwound from the $7.344 macro ceiling and has spent July rebuilding, reclaiming ground to $5.165 off the $4.159 local low. Price is coiling back in the middle of the range with higher lows behind it — a base rebuilding, not a breakdown.
The Setup ⚙️
The Range Floor 🟢
$4.159 (Local Low) is the demand shelf the recovery is built on. It has held through July, and it's the base this range pivots off.
The Decision Point 🔴
$5.916 (Local High) is the gate. A daily close above it flips the local structure bullish and opens the path to the $6.383 measured-move target.
The Roadmap 🛣️
Hold above $4.159 → break $5.916 → run toward $6.383. Invalidation is a clean daily close below $4.159 — that breaks the range.
This is a GRID Range Play: a defined band to rotate, buying the lower half and scaling out into the breakout.
More setups in profile.
#INJ #Injective #crypto #trading #TA #3Commas #GRID
INJ USDT SHORT SIGNAL#125. INJ.USDT – Trade Setup (SHORT)
📈 Position Type: SHORT
🕒 Timeframe: 1H
📊 Market: Futures
💰 Entry Zone:
4.930
🛑 Stop-Loss:
5.166
🎯 Take-Profit Targets:
• TP1: 4.805
• TP2: 4.652
• TP3: 4.485
• TP4: 4.331
⚙️ Leverage:
5*10
▫️ After TP1, move SL to Entry + 0.2%.
▪️ Exit Plan:
• 40% at TP1
• 20% at TP2
• 20% at TP3
20%. at. TP4
📌 Risk Management:
Risk only 1–2% of your capital per trade.
⚠️ Always check and confirm the setup on your chart before entering the trade.
#INJUSDT — Holding the Last Fortres, Recovery or Final Break#INJ
The price is moving within a descending channel on the 1-hour timeframe and has reached the lower boundary. It is now poised for a bounce and is expected to retest this boundary.
The Relative Strength Index (RSI) indicates a downward trend, which is likely to continue due to overbought conditions.
A key support zone (in green) has been identified at 4.47. The price has bounced off this zone several times, making it a strong support level.
The price is trending towards the 100-period moving average, which we are approaching. This trend supports an upward move.
Entry Price: 4.90
First Target: 5.04
Second Target: 5.14
Third Target: 5.28
You can close at the second target or wait for the third target to be reached. The choice is yours.
Stop Loss: At the resistance zone (in green).
Remember this simple rule: Money Management.
Any questions? Please leave a comment.
Thank you.
day trade INJ Technology Overview
Injective (INJ) is a Layer 1 blockchain built with the Cosmos SDK, designed specifically for decentralized finance (DeFi). It enables high-speed, low-cost trading, supports smart contracts, cross-chain interoperability (IBC), and provides infrastructure for decentralized exchanges and advanced financial applications.
Technical Analysis
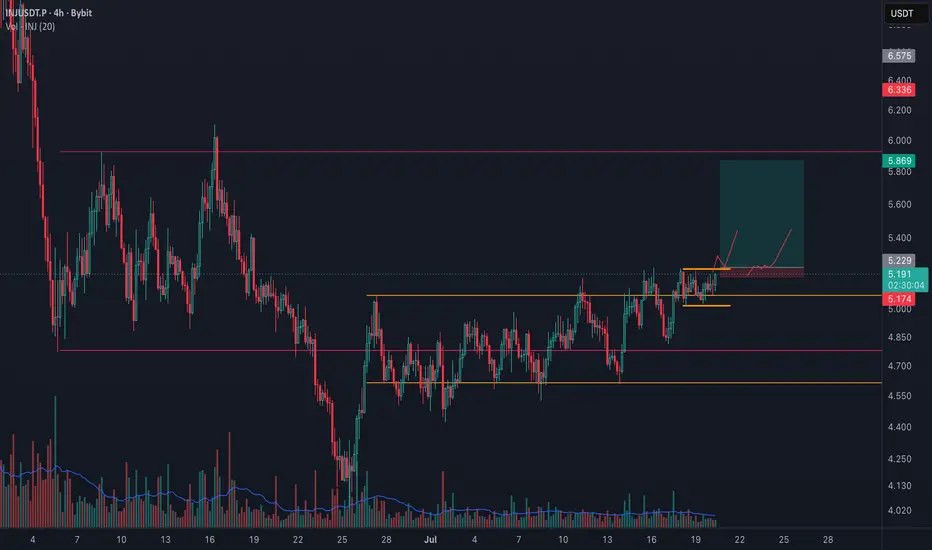
On the 1-hour chart, the price is currently developing within the upper (premium) area of the larger trading range. We'll only consider a long position if the price holds the level marked by the red lines, breaks out of the smaller range, and confirms the breakout. Until those conditions are met, there is no trade.
Ideally, we want to see this setup align with strength in both Bitcoin and Ethereum, as positive market correlation increases the probability of success. However, even if the broader market weakens and INJ still follows this scenario, extra caution is required to ensure the move is not simply a liquidity sweep or a false breakout before entering.
Since the larger structure (highlighted in pink) is currently in Wyckoff Phase B—the "deception" phase—there is a possibility that price may not reach the full target. For that reason, it's important to manage the trade according to your predefined risk unit and move your stop-loss to protect the position as soon as the market structure allows.
Disclaimer:
This analysis is for educational and informational purposes only and should not be considered financial or investment advice. Always conduct your own research and manage your risk before making any trading decisions.
Wishing everyone a successful trade!
– Yours, The Chief
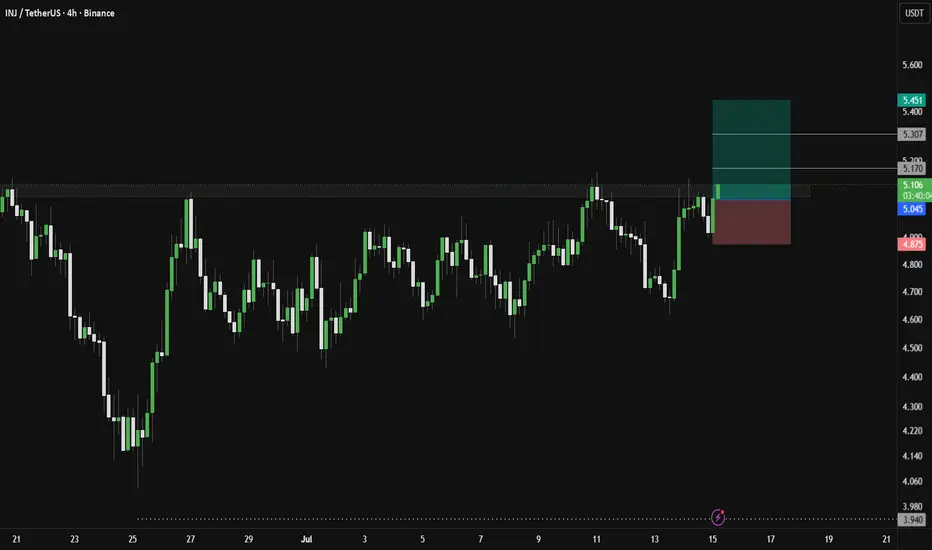
Injusdt Long SetupLooking for a relief bounce after a strong bearish move. Price is currently testing a key support area, and a reaction from buyers could push it toward the next resistance. The setup remains valid as long as support holds; otherwise, a breakdown would invalidate the bullish outlook.
INJ USDT LONG SIGNAL#105 INJ/USDT – Trade Setup (LONG)
📈 Position Type: LONG
🕒 Timeframe: 1H
📊 Market: Futures
💰 Entry Zone:
5.207
🛑 Stop-Loss:
5
🎯 Take-Profit Targets:
• TP1: 5.298
• TP2: 5.420
• TP3: 5.560
• TP4: 5.700
⚙️ Leverage:
5 *10
▫️ After TP1, move SL to Entry + 0.2%.
▪️ Exit Plan:
• 40% at TP1
• 20% at TP2
• 20% at TP3
20% at. TP4
📌 Risk Management:
Risk only 1–2% of your capital per trade.
⚠️ Always check and confirm the setup on your chart before entering the trade.
INJ USDT SHORT SIGNAL#81. INJ/USDT – Trade Setup (SHORT)
📈 Position Type: SHORT
🕒 Timeframe: 1H
📊 Market: Futures
💰 Entry Zone:
5.090
5.185
🛑 Stop-Loss:
5.290
🎯 Take-Profit Targets:
• TP1: 4.970
• TP2: 4.828
• TP3: 4.663
• TP4: 4.434
⚙️ Leverage:
5 *10
▫️ After TP1, move SL to Entry + 0.2%.
▪️ Exit Plan:
• 40% at TP1
• 20% at TP2
• 20% at TP3
.20% at TP4
📌 Risk Management:
Risk only 1–2% of your capital per trade.
⚠️ Always check and confirm the setup on your chart before entering the trade.
INJ Ready for the Next Move?INJ has experienced a solid comeback and is currently testing a crucial resistance level.
A breakout and sustained move above this level would potentially open the gates for additional gains, whereas a failure would likely trigger a short term correction.
Be patient for confirmation.
DYOR, NFA
INJ: Establishing a Solid Bullish FoundationINJ: Establishing a Solid Bullish Foundation – Patiently Waiting for Candle Confirmation to Trigger Long Setup
INJ is flashing highly positive technical indicators on the higher timeframe, opening up a promising long-term trading window for the bulls. Following its successful breakout from a prolonged macro downtrend and a powerful bounce off the solid $2.5 - $3
support base, the asset's structural dynamic has logged a major turning point. The fact that the price action has established a robust baseline and maintained its ground firmly above the $4
psychological round number serves as clear evidence that dip-buying demand is controlling the game.
Observing the visual daily data on chart , we can clearly identify a structural retest of the dynamic MA100 moving average line. Despite a brief spike below this barrier creating a fake breakout designed to shake out weak hands, strong buying volume immediately stepped in to hold the price above this moving support. The current structure reflects highly stable intrinsic strength, confirming that a primary macro uptrend is fully underway.
However, since the broader cryptocurrency market sentiment and volume synchronization have not yet returned to an active state, executing entries prematurely exposes capital to temporary stagnation. The wisest strategy at this juncture is to remain patient on the sidelines, waiting for an additional confirmation signal via a decisive bullish candle setup directly above this dynamic support before triggering any buy (Long) orders.
Disclaimer: This is not financial advice, DYOR.
INJ USDT SHORT SIGNAL#59. INJ/USDT – Trade Setup (SHORT)
📈 Position Type: SHORT
🕒 Timeframe: 1 H
📊 Market: Futures
💰 Entry Zone:
4.797
4.922
🛑 Stop-Loss:
4.980
🎯 Take-Profit Targets:
• TP1: 4.696
• TP2: 4.630
• TP3: 4.549
• TP4: 4.471
TP5: 4.391
TP6:
⚙️ Leverage:
5- 10
⚠️ After reaching TP1, move Stop-Loss to Entry Price.
📌 Risk Management:
Risk only 1–2% of your capital per trade.
Always confirm the setup on your chart before entry
#INJUSDT — Holding the Last Fortres, Recovery or Final Break#INJ
The price is moving within a descending channel on the 1-hour timeframe and has reached the lower boundary. It is now poised for a bounce and is expected to retest this boundary.
The Relative Strength Index (RSI) indicates a downward trend, which is likely to continue given the overbought conditions.
There is a key support zone (in green) at 4.34, and the price has bounced off this zone several times, making it a strong support level.
The price is trending towards the 100-period moving average, which we are approaching. This trend supports an upward move.
Entry Price: 4.73
First Target: 4.84
Second Target: 4.99
Third Target: 5.16
Stop Loss: At the resistance zone (in green)
Remember this simple rule: Money Management.
Any questions? Please leave a comment.
Thank you.
INJ USDT SHORT SIGNALINJ/USDT – Trade Setup (SHORT)
📈 Position Type: SHORT
🕒 Timeframe: 1 H
📊 Market: Futures
💰 Entry Zone:
4.863
🛑 Stop-Loss:
4.990
🎯 Take-Profit Targets:
• TP1: 4.759
• TP2: 4.670
• TP3: 4.578
• TP4: 4.454
TP5: 4.175
TP6: 3.916
⚙️ Leverage:
5-10
⚠️ After reaching TP1, move Stop-Loss to Entry Price.
📌 Risk Management:
Risk only 1–2% of your capital per trade.
Always confirm the setup on your chart before entry
$INJUSD Is Testing a Key Resistance ZoneCRYPTOCAP:INJ Is Testing a Key Resistance Zone
INJ has been respecting a rising trendline while making higher lows. Buyers are still defending the trend, but the price is now sitting below a strong resistance that has rejected it several times before.
For me, the important level is 4.95 - 5.00. A strong 4H candle close above this area, followed by a successful retest, would be a good sign that buyers are taking control again.
If that confirmation happens, the next levels I will watch are 5.20 first, then 5.42. As always, I prefer waiting for confirmation instead of chasing the price.
❌ This bullish idea becomes invalid if the trendline breaks with strong selling pressure and the price closes below the 4.53 support.
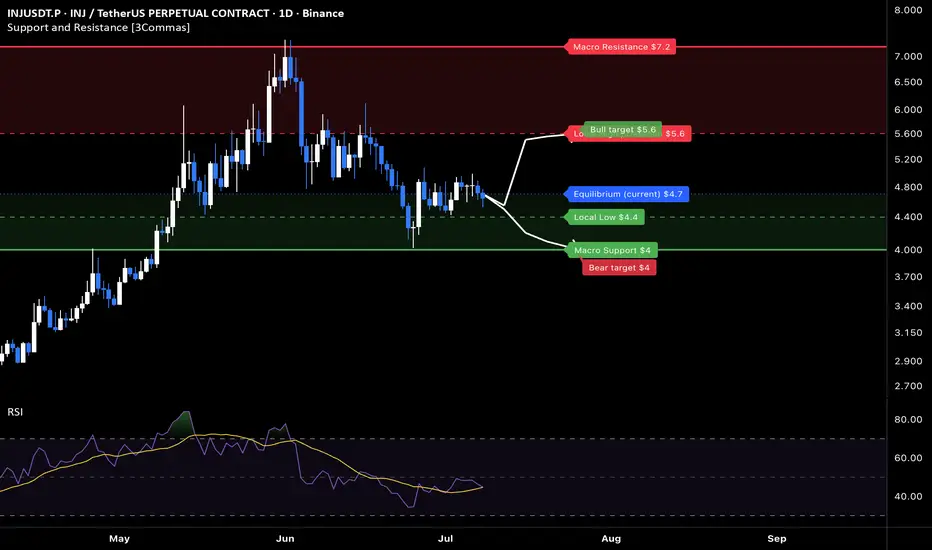
INJ: range coil toward the $5.6 capThe Macro Picture 🗺️
INJ ran from a $2.90 base to a $7.2 macro peak before the trend cooled and price corrected back toward $4. Rather than break down further, it has settled into a horizontal range between the $4.4 local floor and the $5.6 local cap, coiling right at the $4.7 equilibrium. RSI sits around neutral, confirming the market has shifted from trend to balance. After a run and a controlled pullback, this kind of mid-range compression above a defended floor is where the next directional move builds — until one edge breaks, rotation between the boundaries is the base case.
The Setup ⚙️
The Floor: The $4.4 local low stacks above the $4 macro support (solid green) to form a high-confluence demand shelf. Buyers have defended this zone through the correction, and it's the structural line that keeps the range intact.
The Ceiling: The $5.6 local decision (red dashed) caps every bounce — the breakdown shelf that flipped to resistance. A decisive daily close above it would break the range and put the $7.2 macro top back in view.
The Range Play: The $4.4–$4.7 band creates a structural playground for grid-based accumulation — mechanical entries stacked across the range while price coils, no directional call required until the break confirms.
The Roadmap: Primary target sits at $5.6 — the green roadmap points toward a rotation to the range ceiling as buyers hold the floor. Invalidation: a sustained 1D close below $4 would break the base and reopen the downtrend toward fresh lows.
More setups in profile.
INJUSDT: Dynamic Floor Wick Rejection ConfirmedINJUSDT: Dynamic Floor Wick Rejection Confirmed – Triggering Strategic Long Entries Following Strong Capital Inflows 2026
INJ is carving out a highly impressive recovery structure on its macro timeframe, officially unlocking a trend-following buy (Long) entry with an exceptional win probability in 2026. Historical price action proves that this asset possesses a rigid macro support floor, which previously triggered a decisive vertical expansion leg of over 2x immediately upon testing the underlying horizontal baseline. Actual immediate market tracking indicates that after successfully breaking above the major descending trendline, price candles are executing a healthy technical correction to cement a fresh value accumulation buffer.
Observing the daily visual chart , there are solid professional elements backing our upward growth bias. Immediate price action recently engineered a rapid downward spike beneath the dynamic 100-period moving average (MA100) line but instantly printed a sharp technical wick rejection, finalizing a classic fake breakout footprint. From a professional analysis standpoint, this specific liquidity sweep and immediate reversal serve as solid evidence that selling momentum is completely exhausted, validating that buyers have secured a highly sustainable trend foundation.
This structural confluence transforms the current zone into an ideal launchpad for strategic trend-following positions. Traders can confidently initiate Long positions within this immediate buffer zone, maximizing actual capital efficiency with an exceptionally tight strategic stop-loss placed right below the dynamic MA100 ceiling while aiming for the clear overhead targets above.
this is not investment advice, DYOR
INJ/USDT Bearish Flag Breakdown INJ/USDT Bearish Flag Breakdown
INJ remains under strong bearish pressure after completing a bearish flag pattern, a classic continuation setup that often signals another leg lower.
The recent recovery failed to reclaim the broken structure, suggesting sellers are still in control.
Price is now approaching a key support zone around $4.12, which could provide a temporary reaction.
However, if this level fails to hold, the broader bearish trend is likely to resume with the next major demand zone coming into focus.
🎯 Bearish Targets:
$4.12
$3.50
You can find more details on the chart.
Thank you and good luck! 🍀
⚠️PS: Do your own analysis and use your own strategy to join the trade.
❤️ If this analysis helps your trading day, please support it with a like or comment ❤️