In-depth trading ideas
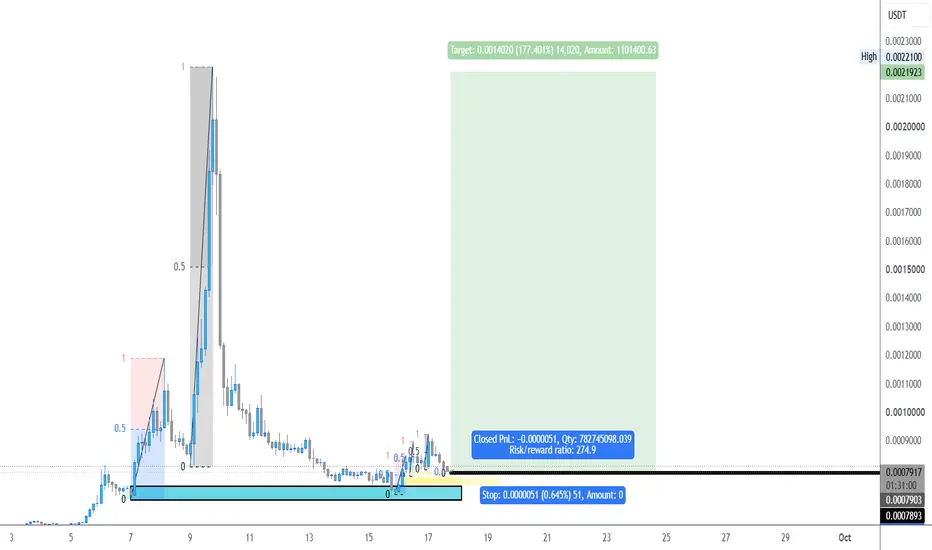
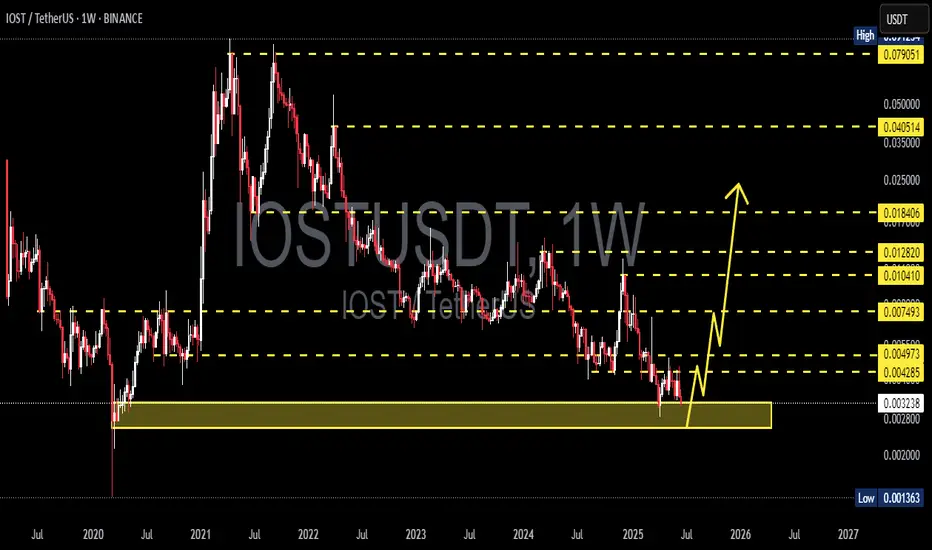
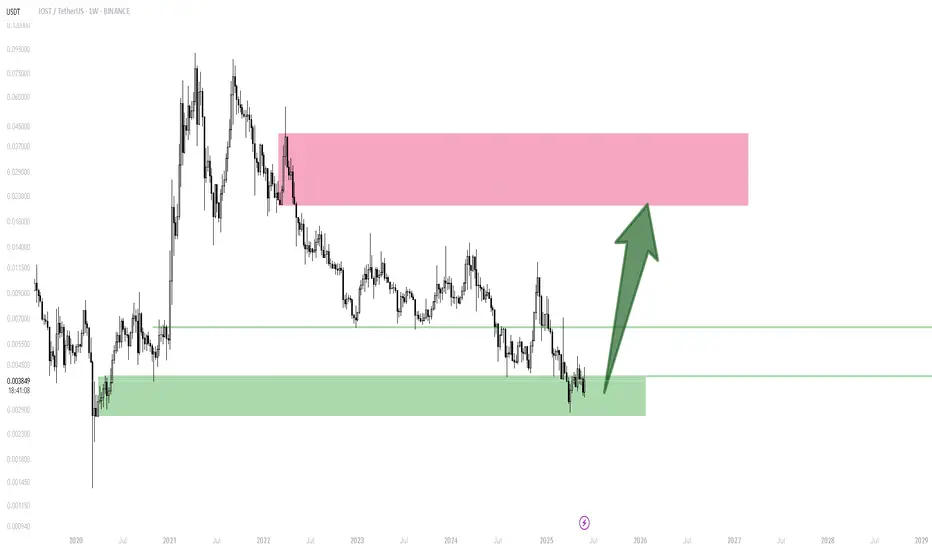
$IOST Accumulation Zone: Could This Setup Still Deliver a 20X Re#IOST Has Suffered A Brutal Multi-Year Bear Market Since Its April 2021 ATH, Falling -99.43% From The Highs.
After Years Of Continuous Selling, Price Finally Started Showing Strength, Finding A Potential Bottom In August And Exploding +374% In Just 4 Weeks.
But Vertical Pumps Come With High Risk.
#IOST Has Now Corrected Nearly -60% From The Recent Pump High $0.002448, And I Am Watching For A Possible Return Into The $0.00080–$0.00057 Accumulation Zone.
Technical Structure:
✅ ATH: $0.09125, Dr
IOSTUSDT - Trade Analysis (M15 Entry)Higher TF Context: H1 and H4 Alligator both bullish, lines fanning up with price trading above all three. No bearish divergence on either H1 or H4, momentum is clean and uncontested.
M15 Story: Price bounced sharply from the Sep 9 lows (0.00088), printed a strong bullish impulse with heavy volume (2.5B on the breakout candle). Alligator on M15 fully fanned upward. RSI at 80/71, overbought but momentum-backed. Price has just broken above the key resistance at 0.0014236 and is pushing into the gr
IOSTUSDT Forming Bullish MomentumIOSTUSDT is forming a clear bullish momentum pattern, a classic bullish reversal signal that often indicates an upcoming breakout. The price has been consolidating within a narrowing range, suggesting that selling pressure is weakening while buyers are beginning to regain control. With consistent volume confirming accumulation at lower levels, the setup hints at a potential bullish breakout soon. The projected move could lead to an impressive gain of around 40% to 50% once the price breaks above
IOST Exhaustion Phase Complete — How to Manage the TransitionTrends do not die with a sudden crash; they die when sellers simply stop showing up .
When you see a descending wedge or a tightly compressed declining channel at the bottom of a macro downtrend, it is rarely a sign of further collapse.
Instead, it signals seller exhaustion.
On the 4H chart, CRYPTOCAP:IOST IOST has perfectly demonstrated this transition from markdown, to accumulation, and now, to the early stages of a markup phase.
The Structural Breakdown
After breaking out of the long-te
IOST - Major Resistance, Reversal or Rejection?📊 Technical Analysis — IOST/USDT
⏳ Time Frame: 4D
📍 Exchange: Binance
📌 Pattern: Descending Trendline
🎯 Key Resistance / Targets: $0.00100 → $0.00120 → $0.00163 → $0.00185 → $0.00250
---
🔻 Descending Trendline Structure
IOST remains within a long-term bearish structure, characterized by a Descending Trendline connecting a series of lower highs since late 2024.
📉 As long as price remains below the trendline, bearish pressure remains dominant.
However, price has recently rebounded from the $0
IOSTUSDT Forming Falling WedgeIOSTUSDT is forming a clear falling wedge pattern, a classic bullish reversal signal that often indicates an upcoming breakout. The price has been consolidating within a narrowing range, suggesting that selling pressure is weakening while buyers are beginning to regain control. With consistent volume confirming accumulation at lower levels, the setup hints at a potential bullish breakout soon. The projected move could lead to an impressive gain of around 90% to 100% once the price breaks above t
IOTXUSDT Sell/Short Signal (15M)Considering that the sell orders of the 4-hour order block have been absorbed, we can expect an internal pullback on lower timeframes.
The entry zone and targets are marked on the chart.
After the first target is reached, secure partial profits and then move the stop loss to breakeven
Do not enter the position without capital management and stop setting
Comment if you have any questions
thank you
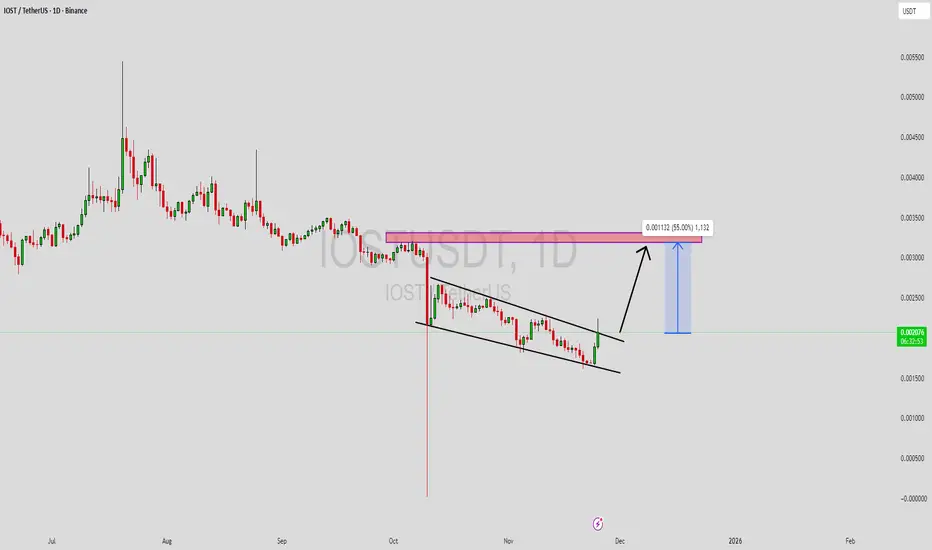
IOSTUSDT UPDATE#IOST
UPDATE
IOST Technical Setup
Pattern: Falling Wedge Pattern
Current Price: $0.00205
Target Price: $0.00368
Target % Gain: 80.65%
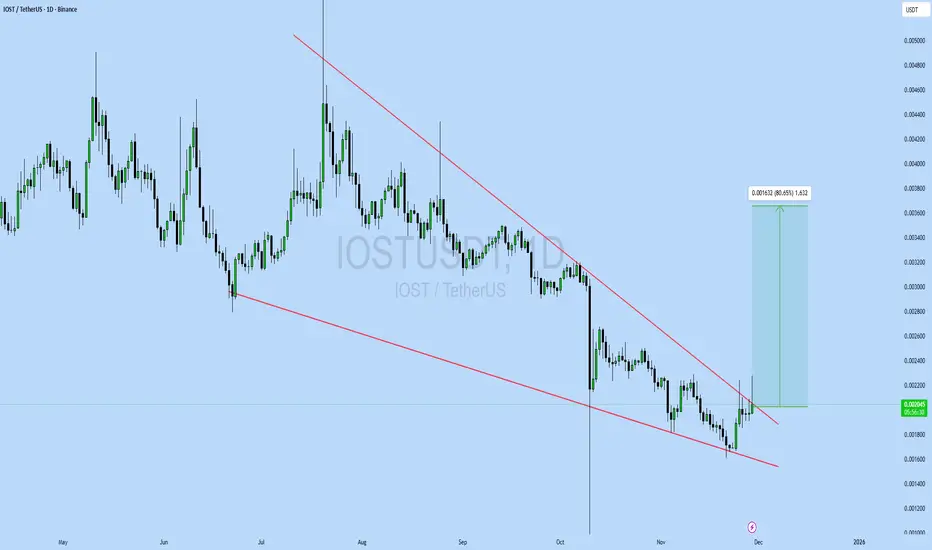
Technical Analysis: IOST is breaking out of a falling wedge pattern on the 1D chart, indicating strong bullish reversal potential. Price has pushed above the descending resistance trendline after prolonged compression, confirming the breakout structure. The measured move from the wedge projects toward the highlighted upside target zone, aligning with previous
ORCAUSDT Forming Falling WedgeORCAUSDT is forming a clear falling wedge pattern, a classic bullish reversal signal that often indicates an upcoming breakout. The price has been consolidating within a narrowing range, suggesting that selling pressure is weakening while buyers are beginning to regain control. With consistent volume confirming accumulation at lower levels, the setup hints at a potential bullish breakout soon. The projected move could lead to an impressive gain of around 90% to 100% once the price breaks above t
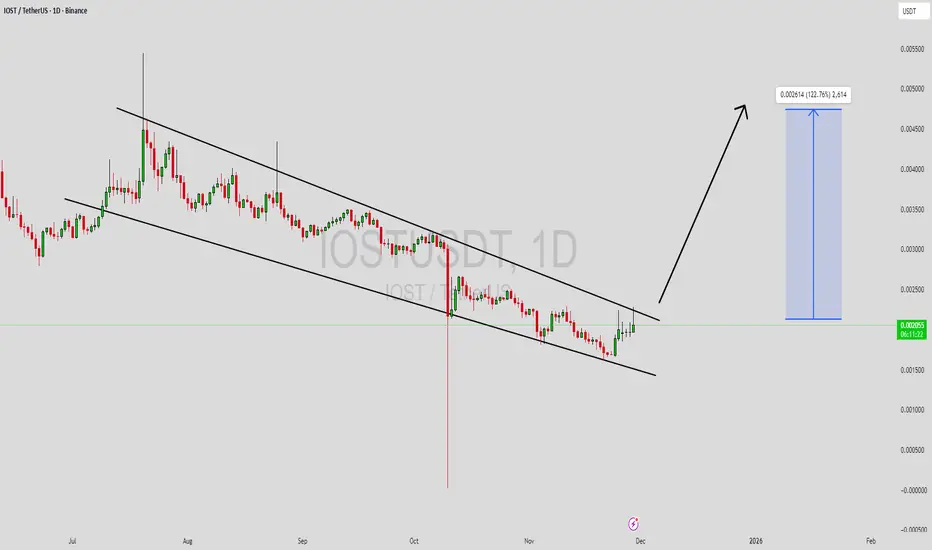
IOSTUSDT Forming Falling WedgeIOSTUSDT is forming a clear falling wedge pattern, a classic bullish reversal signal that often indicates an upcoming breakout. The price has been consolidating within a narrowing range, suggesting that selling pressure is weakening while buyers are beginning to regain control. With consistent volume confirming accumulation at lower levels, the setup hints at a potential bullish breakout soon. The projected move could lead to an impressive gain of around 90% to 100% once the price breaks above t
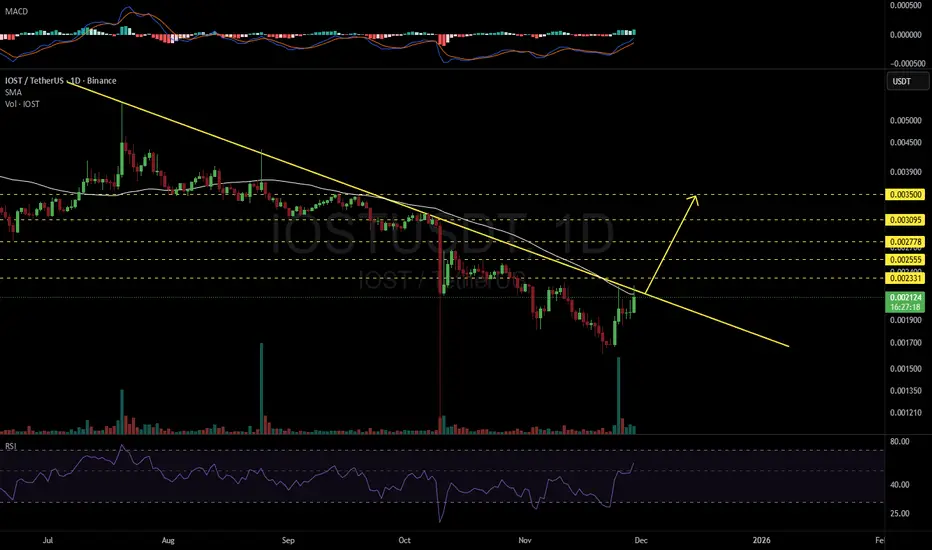
IOSTUSDT 1D#IOST is on the verge of breaking above the descending resistance and the SMA50 on the daily chart. RSI and MACD indicate the possibility of further bullish momentum. Keep an eye on it. If a breakout confirms, the potential upside targets are:
🎯 $0.002331
🎯 $0.002555
🎯 $0.002778
🎯 $0.003095
🎯 $0.003500
⚠️ Always remember to use a tight stop-loss and maintain proper risk management.
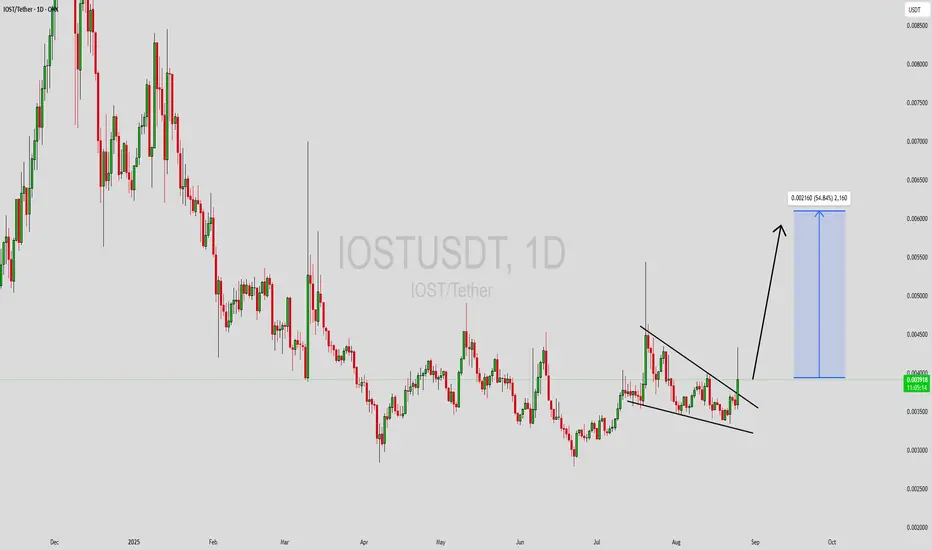
IOSTUSDT Forming Falling WedgeIOSTUSDT is forming a clear falling wedge pattern, a classic bullish reversal signal that often indicates an upcoming breakout. The price has been consolidating within a narrowing range, suggesting that selling pressure is weakening while buyers are beginning to regain control. With consistent volume confirming accumulation at lower levels, the setup hints at a potential bullish breakout soon. The projected move could lead to an impressive gain of around 40% to 50% once the price breaks above th
IOSTUSDT — At a Major Crossroad: Accumulation or Breakdown?🔎 Overview
IOST is currently trading inside a multi-year demand zone (0.0024–0.0037) which has repeatedly acted as a strong support since 2019. Each touch of this area has been met with buying interest, leaving long rejection wicks and suggesting hidden accumulation.
However, the broader market structure remains bearish, with a clear series of lower highs since 2021. This puts the market at a critical juncture:
➡️ Will this demand zone once again serve as a base for accumulation and trigger a
IOSTUSDT Forming Descending TriangleIOSTUSDT is currently trading within a descending triangle pattern, a setup that often signals a potential breakout move when accompanied by strong trading volume. The price action has been consolidating near a crucial support zone, while sellers are gradually losing momentum, creating an opportunity for buyers to step in. With increasing volume and renewed interest, this setup is catching the eye of many traders who are watching for a decisive breakout confirmation.
The current technical struc
IOSTUSDT - Mid Term AnalysisThe coin is good, but everything is bad unless you buy it at the right price.
I like IOST, but I won’t touch it unless it comes to a price that makes sense for me. If it drops to my levels, I will look for:
✅ Footprint absorption
✅ CDV support
✅ Structure reclaim for confirmation
If these align, I will consider a long with clear risk management. If not, I will wait.
No rush, no fear of missing out. The right price or no trade.
📌I keep my charts clean and simple because I believe clarity lea
IOSTUSDT 1D#IOST has broken above the falling wedge pattern on the chart, and the price is moving above the daily SMA100 and the Ichimoku Cloud — a strong bullish sign. Consider buying some #IOST here and near the support level at $0.003633.
Our targets for this setup are:
🎯 $0.004573
🎯 $0.004992
🎯 $0.005590
🎯 $0.006352
⚠️ Always use a tight stop-loss and practice proper risk management.