IOTAUSDT longInstructions:
Entry point: yellow
Stop loss: red
Take profit: green
👉Leverage x 5-10-20 for crypto
👉Leverage x 20-50-100 for commodities, stocks, indices, and forex
👉Margin 1-5% max.
Always practice risk and money management.
Invest a maximum of 5% on any trade or across all your trades.
Invest only what you can afford to lose, as no one is in control of the market.
👉Our analyses are primarily based on:
breakouts: two trend lines (ascending and descending) and a line indicating a horizontal breakout.
chart patterns: shoulders and head, triangle parttern, elliott impulse, etc etc.
We don't always have the time to track them at all times or to represent them visibly, given the numerous signals, the number of channels to manage, and especially because of the often rapid pace of market movements.
indicators: We associate at least two indicators with this technique.
👉Depending on the circumstances, we use specific indicators, often setting 3 or more take profit levels.
👉Indeed, there are good days in trading and also bad days. No one can promise to win every trade, and like all traders worldwide, we also experience stop-loss orders. However, we win more than we lose and remain positive.
👉You can close the position before or after the take profit orders indicated by the green lines if you are personally satisfied; the same applies to stop loss orders.
👉We must stay positive, clear-headed, and humble.
we cannot provide all instructions or all trades here on this channel.
Good luck to us all, and may God guide us. Amen.
In-depth trading ideas
IOTA at macro floor: base recovery toward $0.0449The Macro Picture 🗺️
IOTA unwound the entire move from the $0.07180 macro ceiling down to the $0.03407 floor and has stopped falling right on it. RSI is washed out near 38 and the selling has flattened — exhaustion, not continuation.
The Setup ⚙️
The Accumulation Zone 🟢
$0.03407–0.03550 is where the selling has dried up. The macro floor has held, and this is the demand shelf a recovery would build from.
The Decision Point 🔴
$0.06450 (Local High) is the bigger structural gate. Before it, the $0.04491 measured-move target is the first objective — reclaiming it proves buyers are stepping back in.
The Roadmap 🛣️
Hold the $0.03407 floor → recover toward $0.04491 → then work toward $0.06450. Invalidation is a clean daily close below $0.03407 — that voids the accumulation thesis.
This is a textbook DCA Accumulation Zone setup: scale in across the $0.03407–0.03550 band and let the base do the work.
More setups in profile.
#IOTA #crypto #trading #TA #3Commas #DCA
#IOTAUSDT on the Brink of a Massive Surge in the Next Bull Ru#IOTA
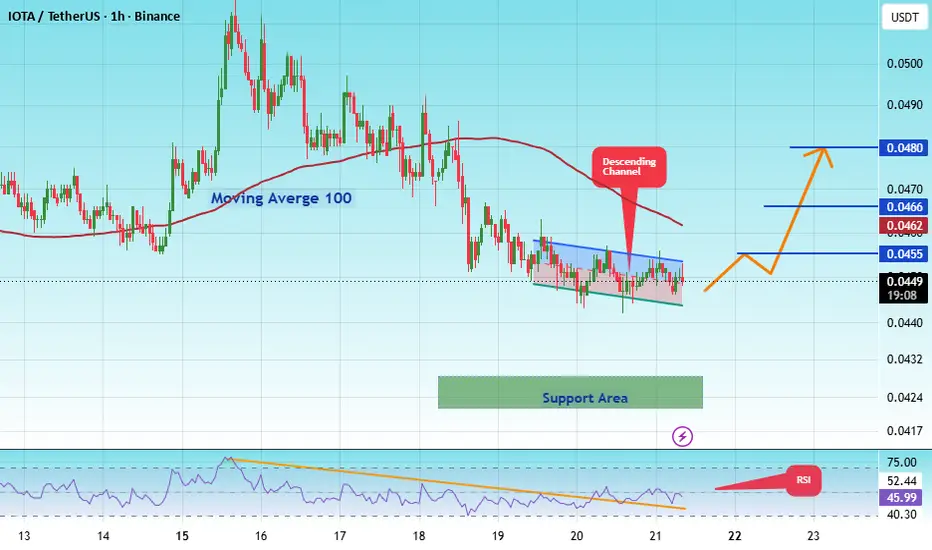
The price is moving within a descending channel on the 1-hour timeframe and has reached the lower boundary. It is now poised for a bounce and is expected to retest this boundary.
The Relative Strength Index (RSI) indicates a downward trend, which is likely to continue given the overbought conditions.
There is a key support zone in green at 0.0422. The price has bounced off this zone several times, making it a strong support level.
The price is trending towards the 100-period moving average, which we are approaching. This trend supports an upward move.
Entry Price: 0.0449
Target 1: 0.0455
Target 2: 0.0466
Target 3: 0.0480
Stop Loss: At the resistance zone in green
Remember this simple rule: Money management.
Any questions? Please leave a comment.
Thank you.
#IOTAUSDT on the Brink of a Massive Surge in the Next Bull Ru#IOTA
The price is moving within a descending channel on the 1-hour timeframe and has reached the lower boundary. It is now poised for a bounce and is expected to retest this boundary.
The Relative Strength Index (RSI) indicates a downward trend, which is likely to continue given the overbought conditions.
There is a key support zone in green at 0.0372. The price has bounced off this zone several times, making it a strong support level.
The price is trending towards the 100-period moving average, which we are approaching. This trend supports an upward move.
Entry Price: 0.0451
Target 1: 0.0464
Target 2: 0.0489
Target 3: 0.0515
Stop Loss: At the resistance zone in green
Remember this simple rule: Money management.
Any questions? Please leave a comment.
Thank you.
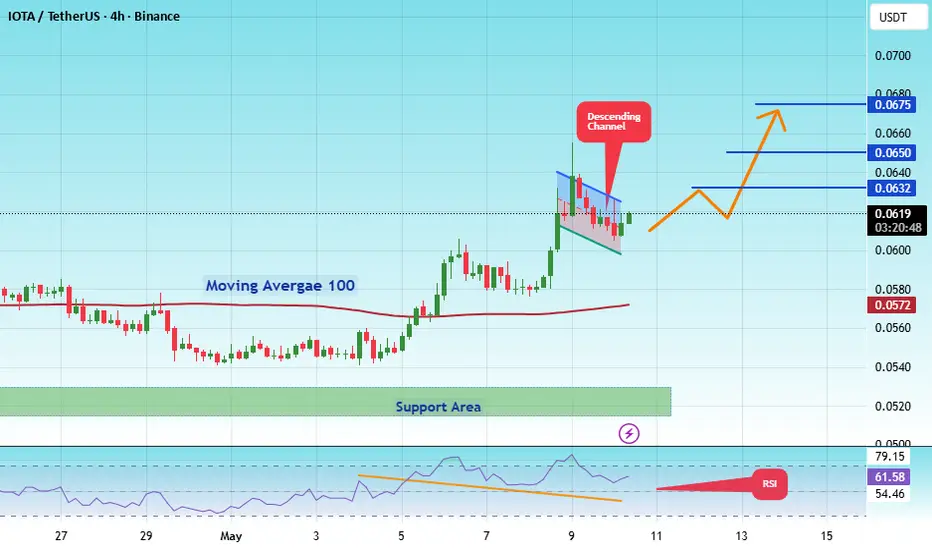
#IOTAUSDT on the Brink of a Massive Surge in the Next Bull Ru#IOTA
The price is moving within a descending channel on the 1-hour timeframe and has reached the lower boundary. It is now poised for a bounce and is expected to retest this boundary.
The Relative Strength Index (RSI) indicates a downward trend, which is likely to continue given the overbought conditions.
There is a key support zone in green at 0.0517. The price has bounced off this zone several times, making it a strong support level.
The price is trending towards the 100-period moving average, which we are approaching. This trend supports an upward move.
Entry Price: 0.0618
First Target: 0.0632
Second Target: 0.0650
Third Target: 0.0675
You can stop at the first and second targets and close below them, or continue towards the third target. Stop Loss: At the resistance zone in green.
Remember this simple rule: Money Management.
Any questions? Please leave a comment.
Thank you.
IOTA/USDIf price comes down to the demand zone (the red zone) and does not break below it, then breaks the RSI trendline and confirms its divergence, and after that the price trendline is broken — that would be a good setup to enter a buy position. However, if the red zone is violated (broken to the downside), the probability of a drop increases significantly. I have marked the expected targets with red lines
Iotausdt shortInstructions:
Entry point: yellow
Stop loss: red
Take profit: green
👉Leverage x 5-10-20 for crypto
👉Leverage x 20-50-100 for commodities, stocks, indices, and forex
👉Margin 1-5% max.
Always practice risk and money management.
Invest a maximum of 5% on any trade or across all your trades.
Invest only what you can afford to lose, as no one is in control of the market.
👉Our analyses are primarily based on:
breakouts: two trend lines (ascending and descending) and a line indicating a horizontal breakout.
chart patterns: shoulders and head, triangle parttern, elliott impulse, etc etc.
We don't always have the time to track them at all times or to represent them visibly, given the numerous signals, the number of channels to manage, and especially because of the often rapid pace of market movements.
indicators: We associate at least two indicators with this technique.
👉Depending on the circumstances, we use specific indicators, often setting 3 or more take profit levels.
👉Indeed, there are good days in trading and also bad days. No one can promise to win every trade, and like all traders worldwide, we also experience stop-loss orders. However, we win more than we lose and remain positive.
👉You can close the position before or after the take profit orders indicated by the green lines if you are personally satisfied; the same applies to stop loss orders.
👉We must stay positive, clear-headed, and humble.
we cannot provide all instructions or all trades here on this channel.
Good luck to us all, and may God guide us. Amen.
IOTA/USDT – Descending Trendline: Breakout or Fakeout?On the 2D timeframe, IOTA/USDT remains within a long-term downtrend structure, highlighted by the major Descending Trendline (yellow line) that has been suppressing price action since late 2024.
However, after months of decline, the price is now approaching this trendline once again and showing signs of accumulation near the bottom zone around $0.05–$0.07. This creates a potential opportunity for a trend reversal if the key resistance can be successfully broken.
📈 From a technical perspective, the current area represents a critical decision zone that could determine whether IOTA begins a recovery phase or continues its bearish trend.
---
🔍 Pattern Formation: Descending Trendline
📉 Pattern Characteristics
🔸 The descending trendline has acted as dynamic resistance for several months.
🔸 Previous bullish attempts were consistently rejected by this trendline.
🔸 Price is now retesting the same resistance area after forming a series of higher lows near the bottom.
💡 This type of structure often becomes the foundation for a trend reversal if a breakout occurs with strong volume confirmation.
---
🟢 Bullish Scenario
The bullish outlook becomes increasingly valid if price can:
✅ Break and close decisively above the Descending Trendline.
✅ Successfully retest the trendline and turn it into support.
✅ Break through the following horizontal resistance levels:
🎯 Target 1: $0.0805
🎯 Target 2: $0.0905
🎯 Target 3: $0.1135
🎯 Target 4: $0.1490
🚀 If buying momentum continues to strengthen, the $0.1490 level could become a highly attractive mid-term target, as it represents a major historical resistance zone.
🔥 Breakouts from long-term trendlines often generate stronger moves than ordinary breakouts because short positions begin to get squeezed while investors regain confidence and re-enter the market.
---
🔴 Bearish Scenario
The bearish structure remains intact as long as price stays below the Descending Trendline.
⚠️ Another rejection from the trendline could trigger renewed selling pressure.
⚠️ A failed breakout may create a new lower high structure.
⚠️ If lower support zones fail to hold, price could revisit:
📍 Major Support: $0.0515
📉 A breakdown below this level would confirm that the long-term bearish trend remains dominant, potentially opening the door for new lows.
---
📌 Key Levels to Watch
🚧 Resistance Levels
🔹 $0.0805
🔹 $0.0905
🔹 $0.1135
🔹 $0.1490
🛡️ Support Levels
🔸 $0.0685
🔸 $0.0580
🔸 $0.0515
---
💡 Conclusion
📍 IOTA is currently trading at one of its most important technical zones in recent months. After a prolonged downtrend, price is now approaching the Descending Trendline that has acted as the primary barrier to upside movement.
🚀 A confirmed breakout could open the path toward $0.0805, $0.0905, $0.1135, and potentially $0.1490, signaling the beginning of a larger trend reversal.
⚠️ However, until the trendline resistance is decisively broken, the long-term bearish structure should still be respected.
🎯 Traders should wait for a clear breakout or rejection confirmation before making trading decisions, as this area will likely determine IOTA’s next major directional move.
#IOTA #IOTAUSDT #Crypto #Cryptocurrency #Altcoin #TechnicalAnalysis #TradingView #ChartAnalysis #PriceAction #Breakout #TrendlineBreakout #DescendingTrendline #BullishSetup #BearishScenario #SupportAndResistance #CryptoTrading #SwingTrading #Binance #Altcoins #MarketAnalysis
IOTAUSDT Forming Bullish MomentumIOTAUSDT is forming a clear bullish momentum pattern, a classic bullish wave signal that often indicates an upcoming breakout. The price has been consolidating within a narrowing range, suggesting that selling pressure is weakening while buyers are beginning to regain control. With consistent volume confirming accumulation at lower levels, the setup hints at a potential bullish breakout soon. The projected move could lead to an impressive gain of around 50% to 60% once the price breaks above the wedge resistance.
This bullish momentum pattern is typically seen at the end of downtrends or corrective phases, and it represents a potential shift in market sentiment from bearish to bullish. Traders closely watching IOTAUSDT are noting the strengthening momentum as it nears a breakout zone. The good trading volume adds confidence to this pattern, showing that market participants are positioning early in anticipation of a reversal.
Investors’ growing interest in IOTAUSDT reflects rising confidence in the project’s long-term fundamentals and current technical strength. If the breakout confirms with sustained volume, this could mark the start of a fresh bullish leg. Traders might find this a valuable setup for medium-term gains, especially as the wedge pattern completes and buying momentum accelerates.
✅ Show your support by hitting the like button
✅ Leaving a comment below! (What is your opinion about this coin?)
Your feedback and engagement keep me inspired to share more insightful market analysis with you!
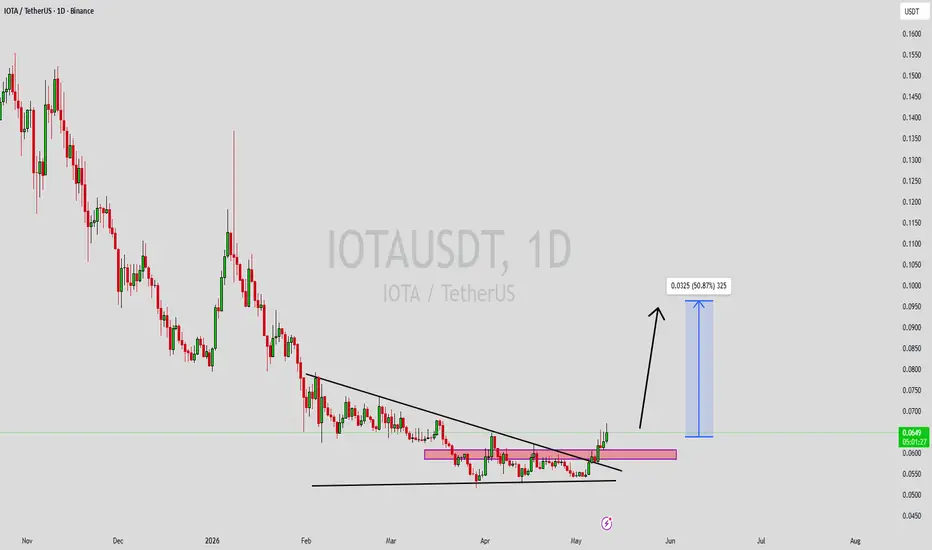
IOTAUSDT 1D#IOTA is moving inside a descending triangle on the daily chart. It has already broken above the daily SMA100 and the Ichimoku cloud with strong volume, which is a very positive sign. In case of a breakout above the triangle resistance, the potential upside targets are:
🎯 $0.0694
🎯 $0.0744
🎯 $0.0794
🎯 $0.0864
🎯 $0.0954
⚠️ Always use a tight stop-loss and maintain proper risk management.
iotausdt shortInstructions:
Entry point: yellow
Stop loss: red
Take profit: green
👉Leverage x 5-10-20 for crypto
👉Leverage x 20-50-100 for commodities, stocks, indices, and forex
👉Margin 1-5% max.
Always practice risk and money management.
Invest a maximum of 5% on any trade or across all your trades.
Invest only what you can afford to lose, as no one is in control of the market.
👉Our analyses are primarily based on:
breakouts: two trend lines (ascending and descending) and a line indicating a horizontal breakout.
chart patterns: shoulders and head, triangle parttern, elliott impulse, etc etc.
We don't always have the time to track them at all times or to represent them visibly, given the numerous signals, the number of channels to manage, and especially because of the often rapid pace of market movements.
indicators: We associate at least two indicators with this technique.
👉Depending on the circumstances, we use specific indicators, often setting 3 or more take profit levels.
👉Indeed, there are good days in trading and also bad days. No one can promise to win every trade, and like all traders worldwide, we also experience stop-loss orders. However, we win more than we lose and remain positive.
👉You can close the position before or after the take profit orders indicated by the green lines if you are personally satisfied; the same applies to stop loss orders.
👉We must stay positive, clear-headed, and humble.
we cannot provide all instructions or all trades here on this channel.
Good luck to us all, and may God guide us. Amen.
iotausdt shortInstructions:
Entry point: yellow
Stop loss: red
Take profit: green
👉Leverage x 5-10-20 for crypto
👉Leverage x 20-50-100 for commodities, stocks, indices, and forex
👉Margin 1-5% max.
Always practice risk and money management.
Invest a maximum of 5% on any trade or across all your trades.
Invest only what you can afford to lose, as no one is in control of the market.
👉Our analyses are primarily based on:
breakouts: two trend lines (ascending and descending) and a line indicating a horizontal breakout.
chart patterns: shoulders and head, triangle parttern, elliott impulse, etc etc.
We don't always have the time to track them at all times or to represent them visibly, given the numerous signals, the number of channels to manage, and especially because of the often rapid pace of market movements.
indicators: We associate at least two indicators with this technique.
👉Depending on the circumstances, we use specific indicators, often setting 3 or more take profit levels.
👉Indeed, there are good days in trading and also bad days. No one can promise to win every trade, and like all traders worldwide, we also experience stop-loss orders. However, we win more than we lose and remain positive.
👉You can close the position before or after the take profit orders indicated by the green lines if you are personally satisfied; the same applies to stop loss orders.
👉We must stay positive, clear-headed, and humble.
we cannot provide all instructions or all trades here on this channel.
Good luck to us all, and may God guide us. Amen.
IOTAUSDT Forming Bullish MomentumIOTAUSDT is forming a clear bullish momentum pattern, a classic bullish wave signal that often indicates an upcoming breakout. The price has been consolidating within a narrowing range, suggesting that selling pressure is weakening while buyers are beginning to regain control. With consistent volume confirming accumulation at lower levels, the setup hints at a potential bullish breakout soon. The projected move could lead to an impressive gain of around 40% to 50% once the price breaks above the wedge resistance.
This bullish momentum pattern is typically seen at the end of downtrends or corrective phases, and it represents a potential shift in market sentiment from bearish to bullish. Traders closely watching IOTAUSDT are noting the strengthening momentum as it nears a breakout zone. The strong trading volume adds confidence to this pattern, showing that market participants may already be positioning early in anticipation of a reversal.
Investors’ growing interest in IOTAUSDT reflects rising confidence in the project’s long-term fundamentals and current technical strength. If the breakout confirms with sustained volume, this could mark the start of a fresh bullish leg. Traders might find this a valuable setup for medium-term gains, especially as the momentum pattern completes and buying pressure accelerates.
✅ Show your support by hitting the like button and
✅ Leaving a comment below! (What is your opinion about this coin?)
Your feedback and engagement keep me inspired to share more insightful market analysis with you!
#IOTAUSDT on the Brink of a Massive Surge in the Next Bull Ru#IOTA
The price is moving within a descending channel on the hourly timeframe. It has reached the lower boundary and is trending towards a bounce. A retest of this boundary is expected.
The Relative Strength Index (RSI) indicates a downward trend, and this trend is likely to continue due to the overbought condition.
A key support zone has been identified in green at 0.0510. The price has bounced off this zone several times, making it a strong support level.
The price is trending towards the 100-period moving average, which we are approaching. This trend supports an upward move.
Entry Price: 0.0540
First Target: 0.0550
Second Target: 0.0561
Third Target: 0.0575
You can close at the second target or wait for the third target to be reached. The choice is yours.
Stop Loss: At the resistance zone in green.
Remember this simple rule: Money Management.
Any questions? Please leave a comment.
Thank you.
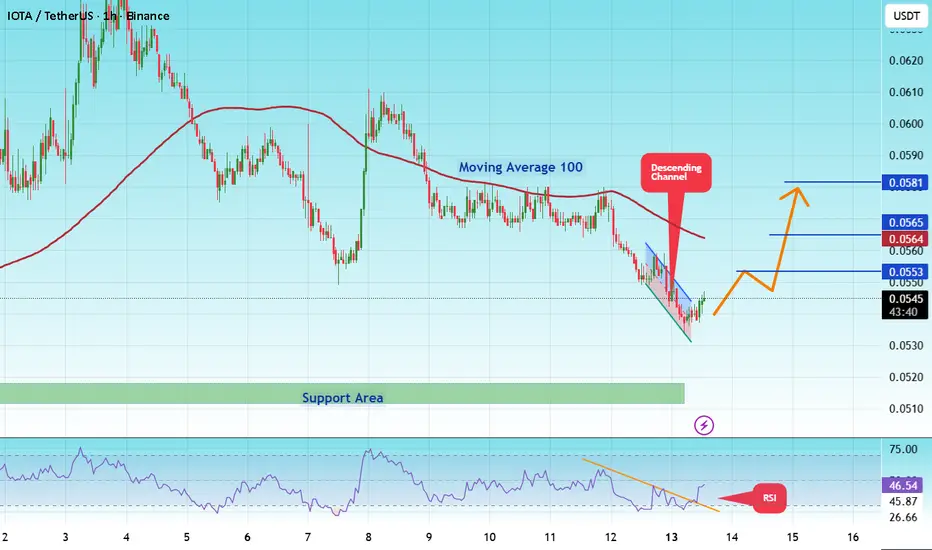
#IOTAUSDT on the Brink of a Massive Surge in the Next Bull Ru#IOTA
The price is moving within a descending channel on the hourly timeframe. It has reached the lower boundary and is trending towards a bounce. A retest of this boundary is expected.
The Relative Strength Index (RSI) indicates a downward trend, and this trend is likely to continue due to the overbought condition.
A key support zone has been identified in green at 0.0511, and the price has bounced off this zone several times, making it a strong support level.
The price is trending towards the 100-period moving average, which we are approaching. This trend supports an upward move.
Entry Price: 0.0540
First Target: 0.0553
Second Target: 0.0565
Third Target: 0.0581
You can close at the second target or wait for the third target to be reached. The choice is yours.
Stop Loss: At the resistance zone in green.
Remember this simple rule: Money Management.
Any questions? Please leave a comment.
Thank you.
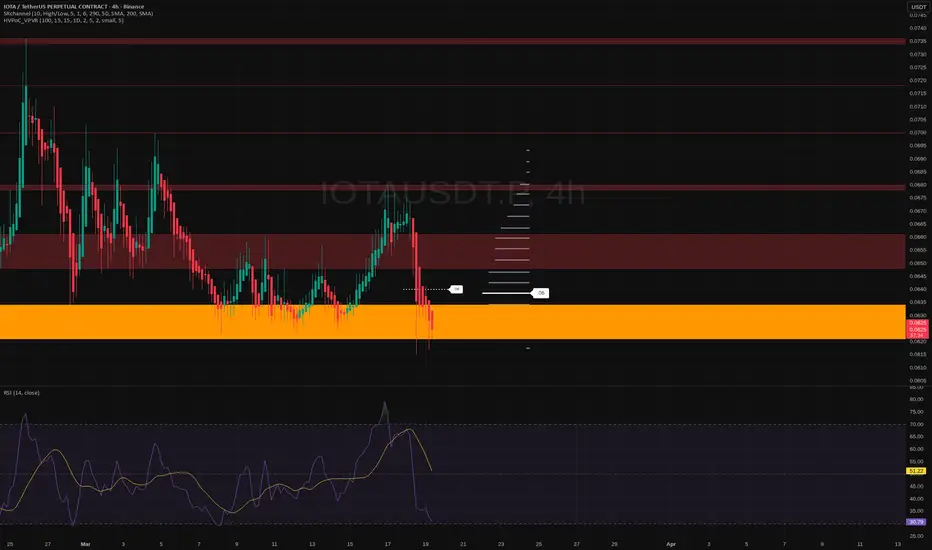
IOTA: bounce or bleed? exploring key levels for todayIOTA
Catching this dip or letting it bleed out? According to industry sources, sentiment on smaller alts turned cautious after recent macro jitters and Bitcoin’s dominance push, and IOTA got dragged right back into its old demand zone. Today we saw a flush straight into that big orange support area, while news around ecosystem development stays quiet and the market is clearly in “prove it” mode.
On the 4H chart, price is sitting on a major historical demand block around 0.062 with RSI buried near oversold, which screams “potential bounce” to me. I’m leaning bullish from this zone, looking for a mean reversion back into the 0.066 - 0.070 red supply band if buyers show up with real volume. I might be wrong, but this kind of vertical drop into support is often where smart money quietly reloads.
My plan: watch for a 4H candle that rejects the orange zone and closes back above roughly 0.063 with rising volume ✅. That opens the door for a swing toward 0.067 first, then maybe 0.07+. If bulls fail and we get a clean 4H close below the orange block, I flip the script and expect continuation lower, so I’d cut longs and wait for the next level down instead of trying to be a hero.
#IOTA/USDT on the Brink of a Massive Surge in the Next Bull Ru#IOTA
The price is moving within a descending channel on the hourly timeframe. It has reached the lower boundary and is heading towards a breakout, with a retest of the upper boundary expected.
The Relative Strength Index (RSI) is showing a downward trend, approaching the lower boundary, and an upward bounce is anticipated.
There is a key support zone in green at 0.0660. The price has bounced from this level several times and is expected to bounce again.
The RSI is showing a trend towards consolidation above the 100-period moving average, which we are approaching, supporting the upward move.
Entry Price: 0.0677
Target 1: 0.0707
Target 2: 0.0745
Target 3: 0.0790
Stop Loss: Below the green support zone.
Remember this simple thing: Money management.
For any questions, please leave a comment.
Thank you.
IOTA: accumulation phase or breakdown? key levels to watchIOTA. Still alive or just a museum exhibit in your watchlist? Recently the market’s been buzzing again about IOTA’s push into smart contracts and real‑world assets, but price is still camping at the lows, so risk/reward is getting interesting. While majors chop around, this kind of sleepy corner is often where the next rotation starts.
On the 4H chart, price is sitting in a fat demand zone around 0.066–0.068 with multiple wicks showing buyers defending. RSI is curling up from oversold and making a higher low, while the volume profile shows a low‑volume pocket up toward 0.07–0.072, so I’m leaning toward an upside squeeze from here. I might be wrong, but this looks more like accumulation than a breakdown.
My base case: continuation above the local range to 0.07–0.072, and if momentum holds, a test of the next red supply near 0.078. I’m interested in longs inside the green zone with tight risk below 0.066 and will start scaling out into those upside levels ✅. If we get a clean 4H close under support, the idea is dead for me and I’ll step aside, watching 0.062 as the next potential magnet.
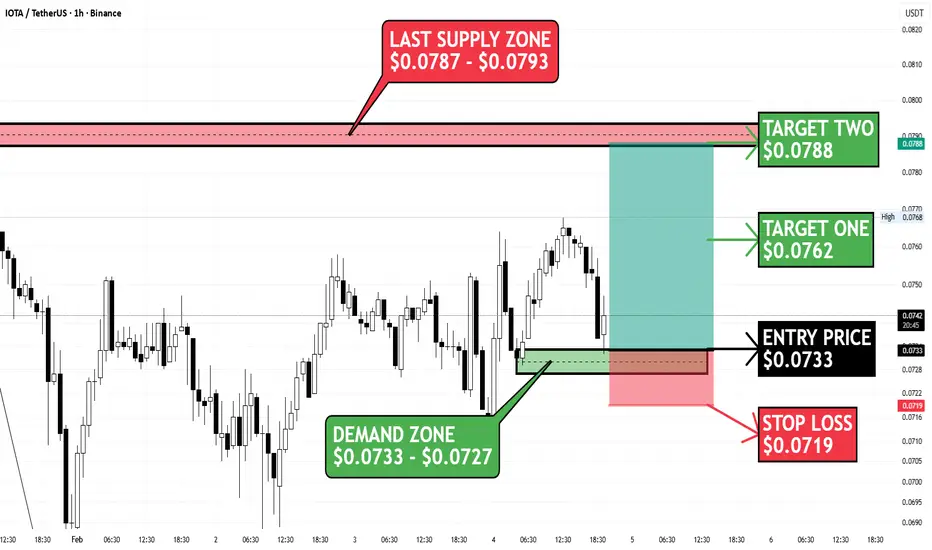
$IOTA/USDT (1H) Price Analysis – Bullish Setup from Demand ZoneBINANCE:IOTAUSDT is currently displaying a bullish continuation setup on the 1H timeframe, with price reacting from a clearly defined demand zone between $0.0733 and $0.0727. This zone has acted as a strong support area, signaling active buyer interest and increasing the probability of a short-term upside move.
Recent exchange liquidation data strengthens this setup, showing that over 90% of liquidations were long positions. This indicates a long-side liquidity flush, where weak hands were forced out near support. Such events often precede price reversals or continuation rallies, provided the demand zone holds.
The entry price is $0.0733, with price currently holding above the demand zone, reinforcing the bullish bias. On the upside, Target One is $0.0762, followed by Target Two at $0.0788, which aligns with the previous supply zone ($0.0787–$0.0793)—the last major area of selling pressure and a logical profit-taking zone.
A stop loss at $0.0719 is placed below the demand zone to invalidate the setup if support fails. As long as price remains above this zone, the market structure favors higher highs, bullish momentum, and a favorable risk-to-reward profile.
⚠️ Entry Condition (LONG Setup)
Wait for price to tap the DEMAND ZONE ($0.0733–$0.0727) and confirm with:
Strong bullish candle close from the zone
Clear rejection wicks showing buyer absorption
Lower-timeframe bullish structure shift (HH / HL)
Volume expansion or momentum confirmation (optional but ideal)
👉 Enter only after confirmation to avoid fake bounces and capitalize on post-liquidation momentum.
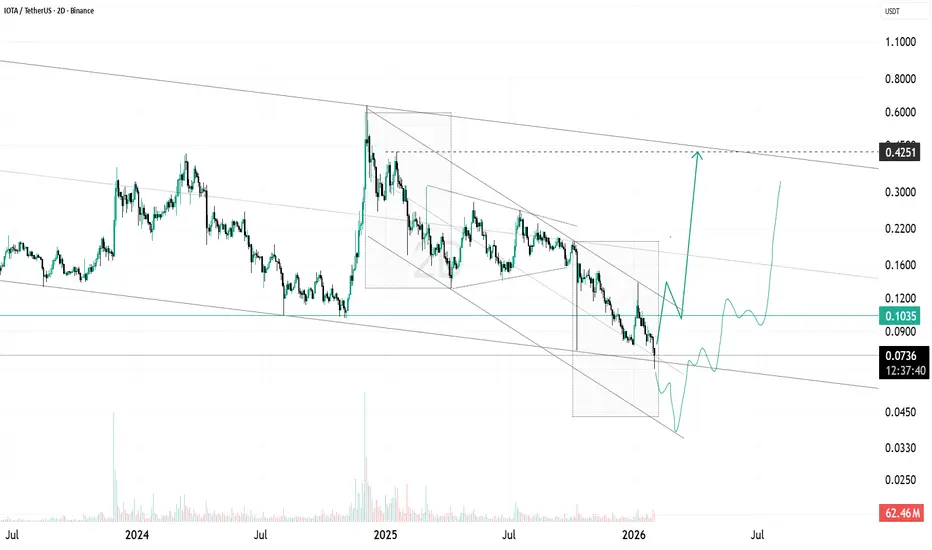
IOTA Testing Long Term Descending SupportIOTA is currently trading at a critical long term support zone after a prolonged decline within a descending structure. Price is holding near the lower boundary of the channel, an area that has previously acted as strong demand.
The recent selloff appears to be slowing down, and price is attempting to stabilize near this support region. If buyers continue to defend this level, a relief move toward the mid range of the structure is possible, followed by a potential retest of the upper descending resistance.
However, failure to hold this zone could open the door for a deeper downside move before any meaningful recovery. This area is important for trend continuation or reversal, making it a key region to monitor closely.
This setup favors patience, as confirmation is needed before expecting a sustained move.
IOTAUSDT Forming Falling WedgeIOTAUSDT is forming a clear falling wedge pattern, a classic bullish reversal signal that often indicates an upcoming breakout. The price has been consolidating within a narrowing range after recent weakness, suggesting that selling pressure is fading while buyers are starting to step in more actively. With steady volume supporting this phase—often a sign of accumulation happening quietly at these lower levels—the setup points toward a potential bullish breakout in the near term. If the price breaks decisively above the upper wedge resistance, we could see a strong move, potentially delivering gains in the range of 140% to 150% from the breakout point.
This falling wedge pattern commonly appears at the end of downtrends or during corrective pullbacks, and it's a solid indicator that market sentiment could be shifting from bearish to bullish. Traders keeping an eye on PORTOUSDT are seeing similar strengthening momentum as it approaches a key breakout zone. The solid trading volume here builds extra confidence in the setup, showing that participants are getting positioned ahead of a possible reversal.
The increasing attention on PORTOUSDT stems from growing optimism about its project fundamentals combined with this promising technical structure. A confirmed breakout with continued volume support could signal the beginning of a new bullish phase. This presents a solid opportunity for medium-term gains, particularly as the wedge pattern wraps up and buying pressure builds momentum.
✅ Show your support by hitting the like button and
✅ Leaving a comment below! (What is your opinion about this Coin)
Your feedback and engagement keep me inspired to share more insightful market analysis with you!
Is #IOTA Ready For a Major Bullish Wave or Will it Fall Further?Yello, Paradiser! Are you ready for what could be a brutal shakeout for bears or a golden entry for bulls on #IOTAUSDT? This falling wedge might not stay quiet for long. Let’s break down the #IOTA Setup:
💎#IOTAUSD is currently trading around $0.084 on the 4H timeframe and has just broken out of a textbook falling wedge pattern. This pattern typically signals a bullish reversal, but only when confirmed by proper retest and strength.
💎We’ve already seen a breakout followed by a retest of the descending resistance, which is a key early sign that momentum might be shifting. Adding to that, the 50 EMA is now attempting to turn into support, and if it holds, it significantly increases the probability of a strong bullish follow-through.
💎The demand zone between $0.080 and $0.084 is now acting as the make-or-break level for bulls. Holding above this zone keeps the bullish setup alive. If price continues to build structure above this area, we could see acceleration toward the first major resistance at $0.100, followed by a strong resistance near $0.120, where we expect sellers to become more aggressive.
💎However, as always, risk management comes first. The bullish thesis is invalidated if price breaks below the key support at $0.0717, where the structure would be compromised, and a bearish continuation toward lower liquidity zones could begin.
Trade smart, Paradisers. This setup will reward only the disciplined.
MyCryptoParadise
iFeel the success🌴