IOTX / IOTXUSDTI'm BACK....
GOOD LUCK >>>
• Warning •
Any deal I share does not mean that I am forcing you to enter into it, you enter in with your full risk, because I'll not gain any profits with you in the end.
The risk management of the position must comply with the stop loss.
(I am not sharing financial or investment advice, you should do your own research for your money.)
In-depth trading ideas
27-03-26 IOTXOn the daily timeframe, prices are falling following a strong rejection of fresh supply. Currently, prices are in the middle of the range. However, given the lack of strong rejection from demand, this indicates that buyers have not yet taken control of the market. Following the trend is the most logical option.
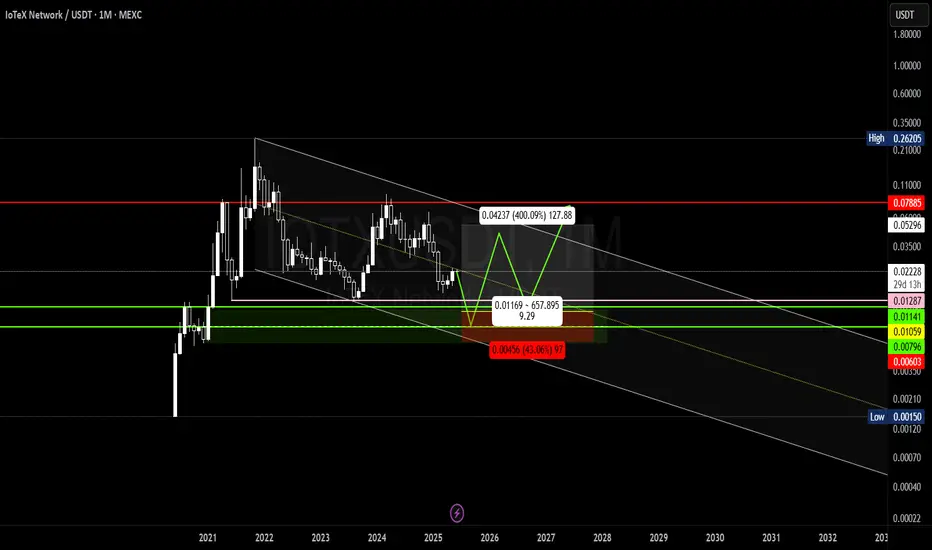
IOTX at Critical Demand – Breakout or Final Flush?Yello Paradisers, are we about to witness a powerful reversal from this demand zone, or is one final shakeout coming before the real move begins?
💎#IOTXUSDT is trading inside a well-defined descending channel, printing consistent lower highs and lower lows. This confirms a corrective structure, not a bullish trend. However, price has now reached a strong demand zone around $0.0040– $0.0042, and we are seeing an initial reaction from this area.
💎Momentum is shifting. The MACD shows early signs of bullish divergence, signaling weakening selling pressure. Still, there is no confirmed bullish crossover yet. Acting before confirmation is where most traders get trapped.
💎The key trigger is a clean breakout above the descending channel resistance. If price breaks out and successfully retests that level as support, structure shifts bullish. In that case, the next major resistance sits at $0.0104–$0.0108, where strong supply previously entered.
💎Invalidation remains below $0.0025. A breakdown there would cancel the bullish scenario and open the door for further downside.
Strive for consistency, not quick profits. Treat the market as a businessman, not as a gambler.
MyCryptoParadise
iFeel the success🌴
IOTX Buy/Long Signal (4H)Price is currently trading around two key levels, and in addition to the CH, we also have a bullish iBOS on the chart.
The overall structure supports buy/long positions, so we are looking for long entries around the support zones.
We have two entry points and positions should be built using a DCA approach.
The targets have been clearly marked on the chart.
If you would like us to analyze a coin or altcoin for you, first like this post, then comment the name of your altcoin below.
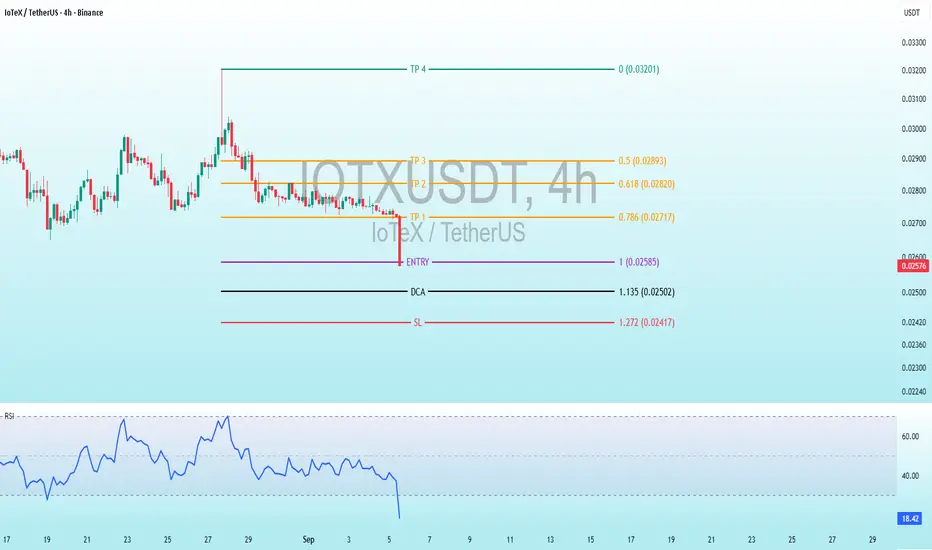
Unlock Profit Potential: $IOTX Trading Signal with Clear TargetsBINANCE:IOTXUSDT
Unlock Profit Potential: SEED_DONKEYDAN_MARKET_CAP:IOTX Trading Signal with Clear Targets!
Detailed Description of the Signal:
Entry (ENTRY): Price level: 1 0.02580 0.02570 USDT
This is the point where a trader is recommended to enter a long position.
Take Profit Levels (TP):
TP1: 0.786 (0.02717 USDT)
TP2: 0.618 (0.02820 USDT)
TP3: 0.5 (0.02893 USDT)
TP4: 0 (0.03201 USDT)
These levels represent potential profit targets, with TP4 being the highest target, indicating a full position exit or maximum profit point.
Dollar-Cost Averaging (DCA):
Price level: 1.135 (0.02502 USDT)
This suggests an additional entry point to average the cost if the price moves against the initial entry.
Stop Loss (SL):
Price level: 1.272 (0.02417 USDT)
This is the level where the trade should be closed to limit losses if the price moves unfavorably.
Chart Analysis:
The chart shows a recent sharp upward movement in price, followed by a consolidation phase. The signal appears to be based on a potential continuation or reversal pattern.
Horizontal lines on the chart mark the key levels (ENTRY, TP1-TP4, DCA, SL), with the ENTRY level aligning near a recent support or breakout point.
The RSI at the bottom indicates momentum, with the index recently dropping from overbought territory (above 70) to around 19.44, suggesting a potential oversold condition that might support a bullish reversal.
IOTX / USDT : Breaking out from symmetrical triangleIOTX/USDT has broken out from the symmetrical triangle. The key now is confirmation — a retest of the breakout zone may occur before continuation. If this level holds, price could rally toward the $0.0315 – $0.033 zone (+13–15%).
Trade Setup:
Entry: On successful retest hold / bullish confirmation candle above $0.030
Targets: $0.0315 – $0.033
Stop-Loss: Below $0.028 (breakout zone invalidation)
Best strategy: Wait for retest confirmation to avoid getting trapped in a false breakout.
IOTXUSDT🚀 IoTeX (IOTX): A Hidden Gem for Short-Term Gains & Long-Term Growth?
Looking for a crypto project with real-world utility and strong upside potential? IoTeX (IOTX)—a decentralized platform powering the Internet of Things (IoT)—might be worth your attention.
Why IoTeX?
✔ Innovation Meets IoT: Combines blockchain + IoT for secure, privacy-focused machine-to-machine (M2M) ecosystems.
✔ Partnerships & Adoption: Backed by industry giants (like Samsung) and used in real-world applications (smart devices, DePIN).
✔ Price Potential: Volatility offers short-term trading opportunities, while long-term growth aligns with IoT’s explosive expansion (projected $2.4T market by 2029).
📌 Short-Term: Watch for bullish trends amid crypto market rebounds and project updates.
📌 Long-Term: HODL potential as IoT adoption grows and IoTeX cements its niche.
IOTX Presses Against Channel Resistance on Daily Chart💥 SEED_DONKEYDAN_MARKET_CAP:IOTX is back on breakout radar as price tests the upper boundary of its ascending channel on the daily timeframe 📈
The structure has held cleanly so far, and price action is now tightening just beneath resistance 🔍. If buyers push through this level, we could see an explosive move to the upside 🚀
However, a rejection here might trigger a short-term pullback toward mid-channel support ⏬
👀 Critical moment unfolding — break or bounce?
Let’s see who takes control from here.
Not financial advice.
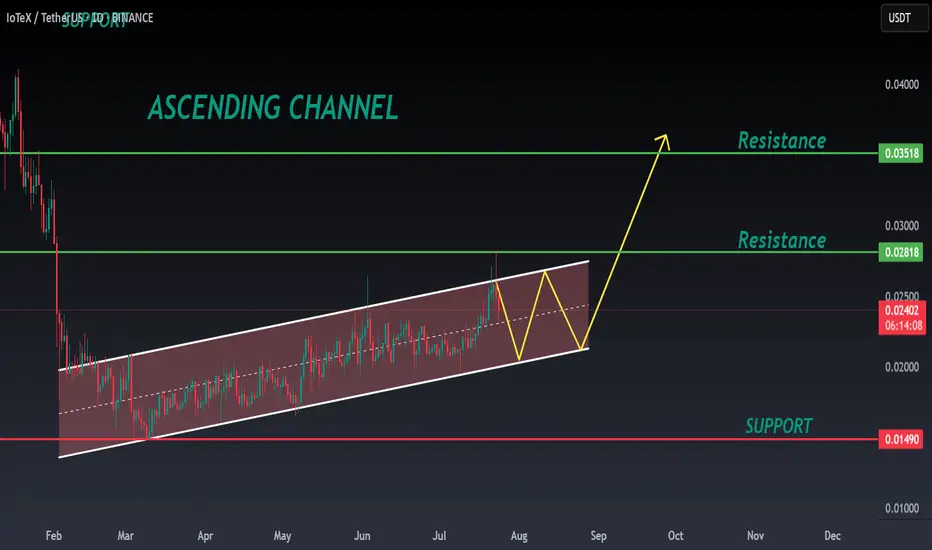
IOTX ANALYSIS🔆#IOTX Analysis : Channel Following ⛔️⛔️
As we can see that #IOTX is following ascending channel on daily time frame. We can see a bullish formation here. And if it trade with good volume then we can see a proper bullish move in #IOTX 📈📈
🔖 Current Price: $0.02400
⏳ Target Price: $0.03500
⁉️ What to do?
- Keep your eyes on the chart, observe trading volume and stay accustom to market moves.🚀💸
🏷Remember, the crypto market is dynamic in nature and changes rapidly, so always use stop loss and take proper knowledge before investments.
#IOTX #Cryptocurrency #ChartPattern #DYOR
IOTXUSDT Forming Poetntial ReversalIOTXUSDT has recently shown strong signs of a potential reversal after revisiting its long-term demand zone, marked in pink on the weekly chart. This historical support region has consistently acted as a springboard for major bullish moves in the past, and the current price action indicates a similar accumulation pattern forming again. With the recent bullish momentum and a clear bounce from this critical zone, IOTXUSDT is now poised for a possible 90% to 100% gain in the coming weeks.
The volume structure remains healthy, with increased buyer activity as the price pushes higher. A clear break above the consolidation range confirms growing investor confidence, backed by rising interest in IoTeX’s real-world use cases and expanding ecosystem. The coin is now attempting to reclaim key resistance levels, which could open the path toward the $0.04–$0.045 region—aligned with a 147% move from current levels, as illustrated on the chart.
IOTXUSDT is gaining momentum among mid-cap altcoins, driven by both technical strength and renewed interest in blockchain solutions focused on IoT (Internet of Things). The project’s consistent development progress and real-world integrations make it an attractive hold for long-term investors, while short-term traders may benefit from this emerging trend breakout setup.
Keep a close eye on continuation patterns and volume surges, which may offer strong entry opportunities. This setup reflects classic technical dynamics that align with previous successful cycles in IOTX, and could be one of the more rewarding medium-term holds of this altcoin season.
✅ Show your support by hitting the like button and
✅ Leaving a comment below! (What is You opinion about this Coin)
Your feedback and engagement keep me inspired to share more insightful market analysis with you!
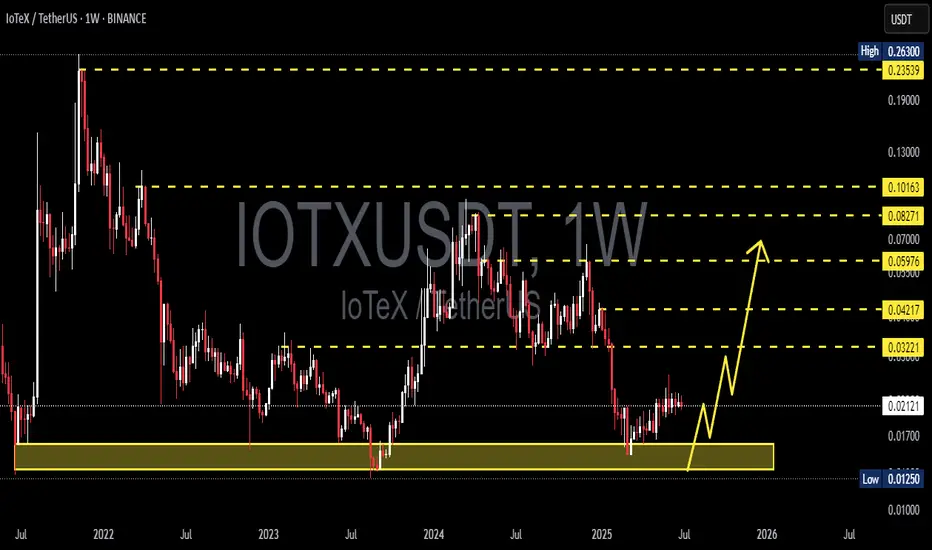
IOTX/USDT Weekly – Massive Bullish Setup Forming at Historical🔍 Technical Analysis Breakdown:
The IOTX/USDT pair is currently consolidating inside a strong historical accumulation zone between $0.0125 and $0.0172, which has served as a critical support area multiple times since 2021. This zone is marked by long-term investor interest, making it a potential launchpad for a major trend reversal.
What makes this zone particularly significant is that it aligns with a potential Double Bottom formation on the weekly timeframe — a classic bullish reversal pattern indicating that sellers are exhausted, and buyers are regaining control.
The projected price path on the chart shows a possible multi-leg breakout scenario, with higher highs forming in a wave structure that hints at a medium-to-long-term bullish trend.
✅ Bullish Scenario – Path of Least Resistance:
If the price successfully holds above the key demand zone and breaks above the first resistance level at $0.03221, the next upside targets to watch are:
1. 🟡 $0.04217 – Weekly resistance from a prior consolidation phase.
2. 🟡 $0.05976 – A psychological resistance and former breakdown zone.
3. 🟡 $0.08271 – $0.10163 – Strong supply zones from the 2022 bearish structure.
4. 🟢 $0.23539 (Final Target) – All-time high region, could be tested in a full bull cycle.
This bullish structure suggests a potential +800% upside from current levels if macro and market sentiment align in favor.
❌ Bearish Scenario – Caution if Support Breaks:
If IOTX loses the key support zone (closes weekly below $0.0125), then:
The market could re-enter a bearish accumulation, risking a move toward new all-time lows.
Momentum would shift back in favor of sellers, invalidating the double bottom structure.
Traders should then wait for signs of re-accumulation or divergence before re-entering.
📉 Volume & Momentum Insight:
Volume remains low but stable, signaling that smart money may be accumulating quietly.
If breakout occurs with a volume spike, this will act as strong confirmation for bullish continuation.
🧠 Conclusion:
IOTX is showing early signs of a major bullish reversal from a well-respected accumulation base. With multiple targets layered above and a clean invalidation zone below, this setup offers high reward-to-risk potential. Watch for a confirmed breakout above $0.032 to validate the beginning of a strong uptrend.
#IOTX #IOTXUSDT #CryptoBreakout #AltcoinAnalysis #TechnicalAnalysis #CryptoSetup #BullishCrypto #IoTeX #CryptoTrading #AccumulationZone
IoTeX 4 Months Bottom Consolidation, Time To GrowThis is one of the best types of chart setups, very low risk and a high potential for reward. Let me explain.
IOTXUSDT hit bottom mid-March, after this bottom, it has been consolidating bullish for more than three months. If we take the drop produced in early February as the start of the consolidation phase, we are talking about more than four months sideways, this is huge. Four months sideways simply means a very long and strong consolidation phase. The longer the consolidation phase the stronger the bullish wave that follows, and bullish is what is coming next.
Notice the higher highs and higher lows. Shy, small; slow and steady growth, but still higher since March. This reveals the broader bias and market trend. IoTeX is set to grow and it will produce a very strong bullish wave. It is only weeks away. Consolidation can only go for so long and it has been already more than four months.
This is an easy pair, an easy trade. Buy and hold.
Namaste.
IOTX/USDTKey Level Zone: 0.02010 - 0.02130
HMT v8.1 detected. The setup looks promising, supported by a previous upward/downward trend with increasing volume and momentum, presenting an excellent reward-to-risk opportunity.
HMT (High Momentum Trending):
HMT is based on trend, momentum, volume, and market structure across multiple timeframes. It highlights setups with strong potential for upward movement and higher rewards.
Whenever I spot a signal for my own trading, I’ll share it. Please note that conducting a comprehensive analysis on a single timeframe chart can be quite challenging and sometimes confusing. I appreciate your understanding of the effort involved.
Important Note :
Role of Key Levels:
- These zones are critical for analyzing price trends. If the key level zone holds, the price may continue trending in the expected direction. However, momentum may increase or decrease based on subsequent patterns.
- Breakouts: If the key level zone breaks, it signals a stop-out. For reversal traders, this presents an opportunity to consider switching direction, as the price often retests these zones, which may act as strong support-turned-resistance (or vice versa).
My Trading Rules
Risk Management
- Maximum risk per trade: 2.5%.
- Leverage: 5x.
Exit Strategy
Profit-Taking:
- Sell at least 70% on the 3rd wave up (LTF Wave 5).
- Typically, sell 50% during a high-volume spike.
- Adjust stop-loss to breakeven once the trade achieves a 1.5:1 reward-to-risk ratio.
- If the market shows signs of losing momentum or divergence, ill will exit at breakeven.
The market is highly dynamic and constantly changing. HMT signals and target profit (TP) levels are based on the current price and movement, but market conditions can shift instantly, so it is crucial to remain adaptable and follow the market's movement.
If you find this signal/analysis meaningful, kindly like and share it.
Thank you for your support~
Sharing this with love!
HMT v2.0:
- Major update to the Momentum indicator
- Reduced false signals from inaccurate momentum detection
- New screener with improved accuracy and fewer signals
HMT v3.0:
- Added liquidity factor to enhance trend continuation
- Improved potential for momentum-based plays
- Increased winning probability by reducing entries during peaks
HMT v3.1:
- Enhanced entry confirmation for improved reward-to-risk ratios
HMT v4.0:
- Incorporated buying and selling pressure in lower timeframes to enhance the probability of trending moves while optimizing entry timing and scaling
HMT v4.1:
- Enhanced take-profit (TP) target by incorporating market structure analysis
HMT v5 :
Date: 23/01/2025
- Refined wave analysis for trending conditions
- Incorporated lower timeframe (LTF) momentum to strengthen trend reliability
- Re-aligned and re-balanced entry conditions for improved accuracy
HMT v6 :
Date : 15/02/2025
- Integrated strong accumulation activity into in-depth wave analysis
HMT v7 :
Date : 20/03/2025
- Refined wave analysis along with accumulation and market sentiment
HMT v8 :
Date : 16/04/2025
- Fully restructured strategy logic
HMT v8.1 :
Date : 18/04/2025
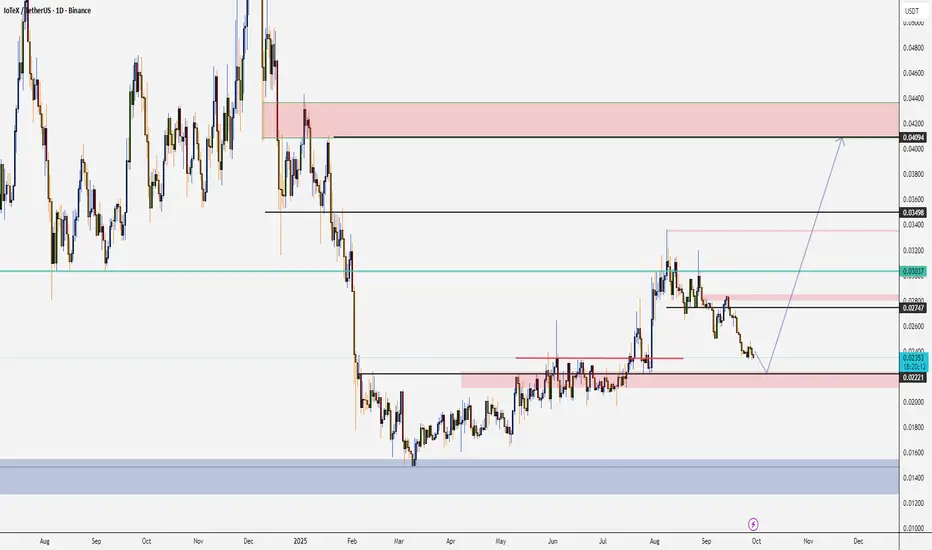
IOTX buy/long setup (1D)An important trigger line has been broken, and the price has been moving sideways for a while.
There is also a bullish CH on the chart.
It is expected that the price will make a pullback to the support zone and then move toward the supply zones higher on the chart. We are looking for buy positions at the entry points.
A daily candle closing below the invalidation level will invalidate this analysis.
For risk management, please don't forget stop loss and capital management
When we reach the first target, save some profit and then change the stop to entry
Comment if you have any questions
Thank You
IOTX Is Still Bullish (12H)The important trigger line has been broken, and the price has recently formed the main bullish CH (Change of Character).
If the demand zone holds, the price may move toward the flip line.
A daily candle closing below the invalidation level would invalidate this analysis.
Do not enter the position without capital management and stop setting
Comment if you have any questions
thank you
Is it going to happen? IOTX/USDT Potential upword movment ?While IOTX is currently exhibiting bearish indicators, such as trading below significant moving averages and a bearish MACD crossover, the RSI suggests it is not yet in oversold territory. The increased volume during price dips may indicate accumulating interest at lower levels, potentially providing a foundation for future price stabilization or upward movement.