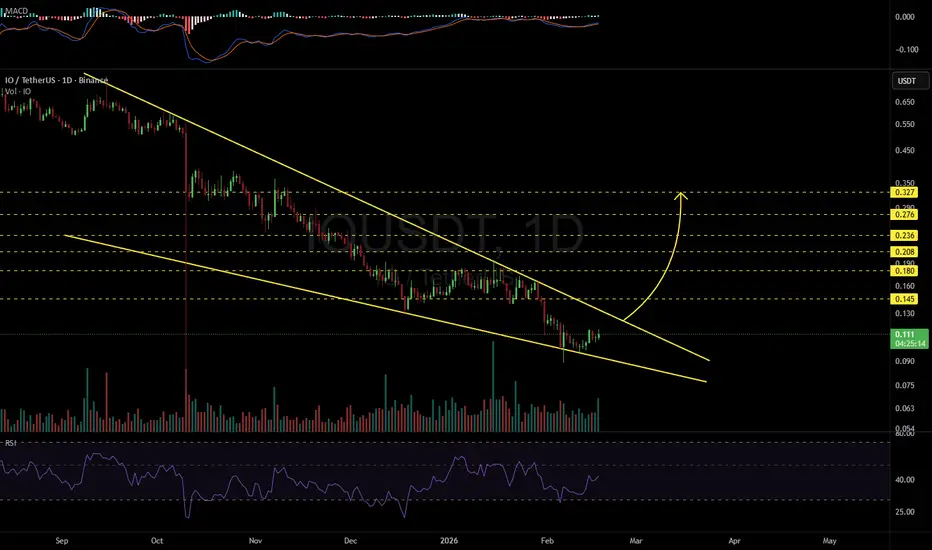
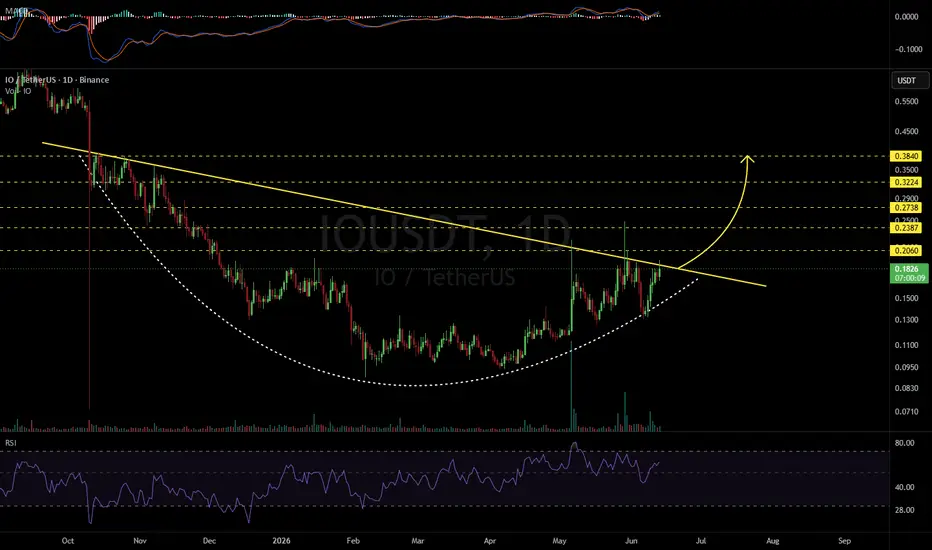
IOUSDT 1D#IO is on the verge of breaking out above the descending resistance on the daily chart.
In case of a confirmed breakout, the following upside targets could come into play:
🎯 $0.2060
🎯 $0.2387
🎯 $0.2738
🎯 $0.3224
🎯 $0.3840
⚠️ Always remember to use a tight stop-loss and maintain proper risk management.
In-depth trading ideas
IOUSDT Forming Bullish MomentumIOUSDT is forming a clear bullish momentum pattern, a classic bullish wave signal that often indicates an upcoming breakout. The price has been consolidating within a narrowing range, suggesting that selling pressure is weakening while buyers are beginning to regain control. With consistent volume confirming accumulation at lower levels, the setup hints at a potential bullish breakout soon. The projected move could lead to an impressive gain of around 80% to 90% once the price breaks above the key resistance zone.
This bullish momentum pattern is typically seen at the end of downtrends or corrective phases, and it represents a potential shift in market sentiment from bearish to bullish. Traders closely watching IOUSDT are noting the strengthening momentum as it approaches a critical breakout area. The healthy trading volume adds confidence to this setup, showing that market participants may be positioning early in anticipation of a larger upward move.
Investors’ growing interest in IOUSDT reflects increasing confidence in the project's long-term potential and current technical strength. If the breakout confirms with sustained volume, this could mark the beginning of a fresh bullish trend. Traders may find this an attractive setup for medium-term gains, especially as the pattern nears completion and buying pressure continues to build.
✅ Show your support by hitting the like button!
✅ Leave a comment below: What is your opinion about IOUSDT?
Your feedback and engagement keep me inspired to share more insightful market analysis with you!
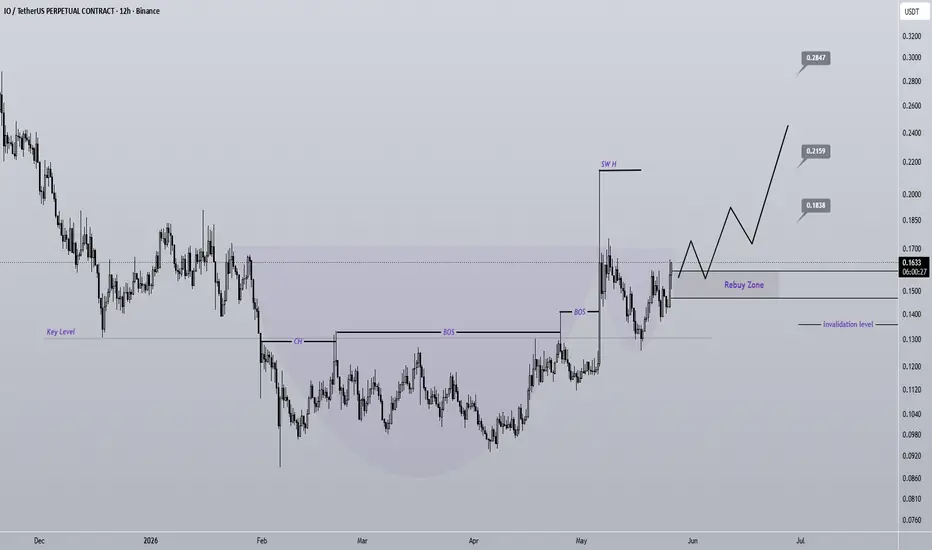
IO is one of the Most bullish AI Related Assets !IO structure remains strongly bullish with powerful CH and BOS confirmations across higher timeframes.
IO is currently trading around a key level, while candle momentum remains extremely bullish, showing strong buyer control and dominance over the market.
A bullish Cup and Handle pattern is also visible on the chart, which is considered one of the strongest classic continuation patterns.
Targets are marked on the chart.
Consider entering the position using DCA within the rebuy zone.
A daily candle close below the invalidation level will invalidate this bullish outlook.
If you would like us to analyze a coin or altcoin for you, first like this post, then comment the name of your altcoin below.
What is your opinion about IO?
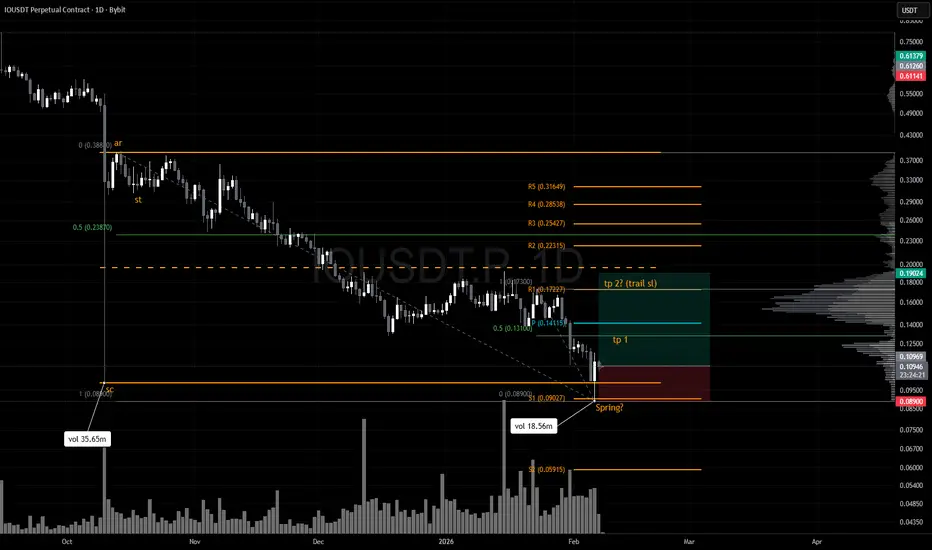
Spring in play? The crypto market just went through another heavy liquidation event, with BTC flushing down to 59k. As expected, altcoins took the brunt of the move with many breaking structural lows and sentiment capitulating.
Even so, a number of alts are now showing tradeable relief‑rally structures. These aren’t guarantees nothing ever is, but the setups are technically clean, with clear invalidation levels and logical upside targets if the market stabilises.
The key thing to keep in mind:
If BTC continues lower (which is still very possible), many of these setups will likely get invalidated and push into their yearly S2 pivots or deeper support zones. Until then, the structure on several alts supports the idea of short‑term relief before the next major decision point.
I’ll be using this same template across multiple charts so the logic stays consistent.
Price swept the October 10th lows and printed a low‑volume spring relative to the selling climax. It has since closed back inside the range and is currently holding above the new yearly S1 support (at least for now).
Targets & Management
TPs
- First target sits just below the yearly pivot
- If price reaches that level, trail the stop toward the range EQ
Depending on BTC’s strength, the stop can continue to trail, but one step at a time
Risk
As always, risk management is everything. These setups are valid only while structure holds, and BTC remains the dominant variable.
IOUSDT 8H#IO is trading within a descending channel on the 8-hour timeframe and is currently testing the channel resistance along with the SMA21. If price breaks above both levels, the potential upside targets are:
🎯 $0.167
🎯 $0.190
🎯 $0.209
🎯 $0.228
🎯 $0.254
⚠️ Always apply tight stop-losses and adhere to strict risk management.
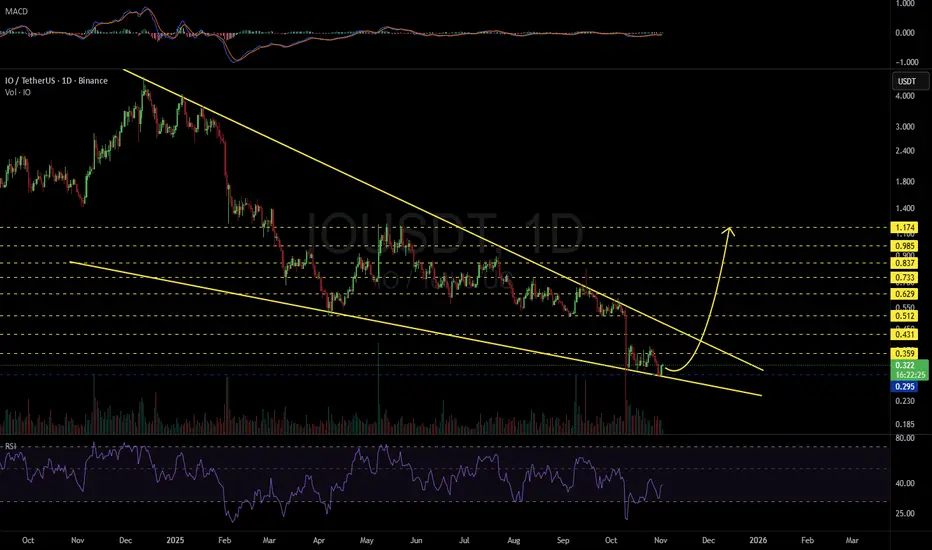
IOUSDT 1D#IO is currently trading within a falling wedge pattern on the daily chart, near the wedge support. For the bullish scenario to remain valid, the price must hold above this level. The short-term target is:
🎯 $0.359
In case of a breakout above the wedge resistance, the potential upside targets are:
🎯 $0.431
🎯 $0.512
🎯 $0.629
🎯 $0.733
🎯 $0.837
🎯 $0.985
🎯 $1.174
⚠️ Always remember to use a tight stop-loss and maintain proper risk management.
IO: Potential 500% Upside After Hitting Binance Listing PriceWe’ve touched the Binance listing price during the squeeze — usually, that’s followed by a strong upward move. Based on the trend of higher highs, there’s a solid chance to gain around 500%. The project itself is technologically interesting and backed by reputable investors.
The first take-profit target is set at $1.5, after which we’ll reassess the situation. BINANCE:IOUSDT
IO/USDT — Accumulation or Major Reversal Incoming?🔎 Current Situation
Timeframe: Daily (1D)
Main Trend: Prolonged downtrend since late 2024 (yellow trendline).
Key Zone: Price is consolidating inside the 0.50 – 0.62 accumulation box, which has acted as strong demand multiple times.
Breakout Attempt: Price briefly broke above the trendline and spiked to 0.84, but quickly rejected → potential bull trap.
---
🧩 Pattern Observations
1. Accumulation Zone (Yellow Box)
Multiple retests confirm this as a critical demand area.
Buyers and sellers are locked in a strong battle here.
2. Descending Triangle / Falling Wedge
Structure resembles a descending triangle (bearish bias if breakdown below 0.50).
Alternatively, it can be read as a falling wedge (bullish if breakout is confirmed).
3. False Breakout (Bull Trap?)
The spike to 0.84 followed by rejection hints at a possible liquidity grab.
Confirmation is needed to validate whether this is a reversal signal or just a trap.
---
🚀 Bullish Scenario
Confirmation Needed:
A daily close above 0.843 with strong volume.
Retest of the downtrend line as new support.
Bullish Targets:
TP1: 1.171
TP2: 1.450
TP3: 2.223
Extended targets: 2.801 – 4.215 if momentum strengthens.
📌 If confirmed, this would signal that 0.50–0.62 was the accumulation bottom before a major reversal.
---
🐻 Bearish Scenario
Confirmation Needed:
A daily close below 0.50 to validate the descending triangle breakdown.
Bearish Targets:
First support: 0.43
Next level: 0.36
📌 Failure to hold the 0.50–0.62 zone could trigger further downside continuation.
---
🎯 Trading Plan
Bullish Traders (Conservative): Wait for a close > 0.843 + retest → enter with staged targets.
Bullish Traders (Aggressive): Start accumulating inside 0.52–0.60 with a tight SL below 0.50.
Bearish Traders: Look for a strong rejection at 0.84 to short → target back to 0.50, or lower if breakdown occurs.
⚖️ Risk Management: This is a decision point. Use strict stop-loss management as this level can either trigger a major reversal or confirm bearish continuation.
---
📌 Notes
Volume is the key factor to separate a valid breakout from a bull trap.
This zone represents a make-or-break point for the medium-term trend.
---
IO/USDT (1D) — Price is consolidating in the 0.50–0.62 accumulation zone, a critical level that could decide the next big move.
Bullish if daily close > 0.843 → targets: 1.171 / 1.450 / 2.223.
Bearish if breakdown < 0.50 → targets: 0.43 / 0.36.
This is a major decision point. Watch for confirmation, beware of bull traps, and always use SL.
---
#IO #IOUSDT #CryptoAnalysis #Altcoin #TechnicalAnalysis #Breakout #SupportResistance #CryptoTrading #BullTrap
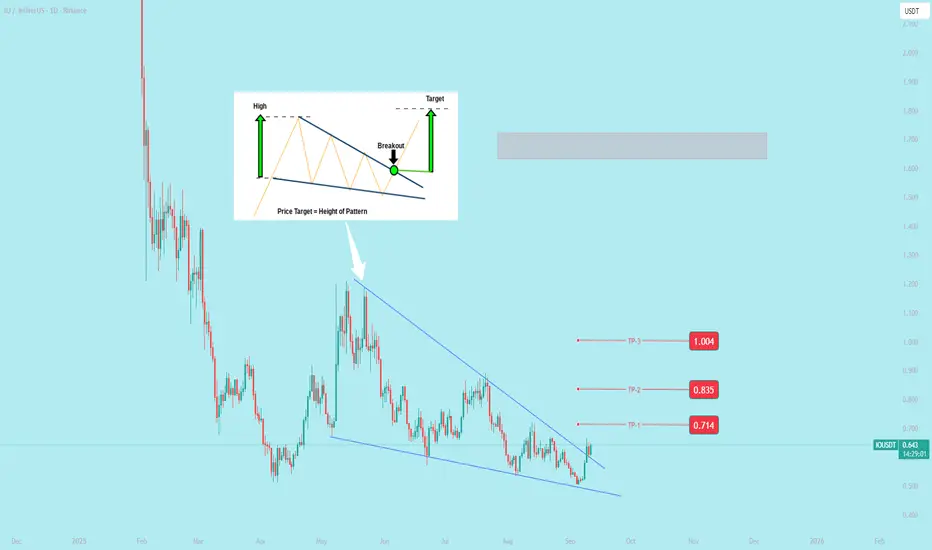
IOUSDT Forming Falling WedgeIOUSDT is displaying a classic falling wedge pattern, a bullish technical formation that often signals the end of a downtrend and the start of a strong upward move. The price action has been consolidating within narrowing ranges, showing reduced selling pressure and paving the way for a potential breakout. With volume holding steady, the conditions are aligning for a powerful bullish move once the breakout is confirmed.
The expected gain of 90% to 100%+ highlights the strength of this setup. Falling wedge breakouts are known for delivering sharp upward momentum, as buyers step in aggressively to capitalize on the reversal opportunity. Once price clears key resistance levels, a strong rally could unfold, attracting both short-term traders and long-term investors.
Investor interest in IOUSDT is also increasing, which adds further confidence to the potential upside. Market sentiment around this project has been improving, and traders are positioning themselves for what could be a significant breakout run. Watching the price closely near wedge resistance and monitoring volume surges will be key for timing entries effectively.
✅ Show your support by hitting the like button and
✅ Leaving a comment below! (What is You opinion about this Coin)
Your feedback and engagement keep me inspired to share more insightful market analysis with you!
IOUSDT Forming Falling WedgeIOUSDT is forming a classic falling wedge pattern, a bullish reversal signal that often precedes a strong upward breakout. After an extended period of consolidation within narrowing trendlines, the pair is now showing signs of strength with improving momentum. Historically, falling wedge breakouts lead to significant gains, and with current market structure, an upside move of 90% to 100%+ looks achievable.
The trading volume has remained healthy, confirming sustained interest in this setup. Strong volume during consolidation generally indicates accumulation, which adds weight to the bullish outlook. Once a confirmed breakout occurs, the momentum could trigger rapid price expansion toward higher resistance zones, aligning with the projected gains.
Investor attention around IOUSDT continues to grow, with increased buying interest suggesting confidence in the long-term potential of this project. This aligns well with the technical structure, creating an ideal scenario for traders who focus on high-reward chart patterns.
If the wedge breakout unfolds as expected, IOUSDT could deliver a sharp rally in the coming sessions, providing one of the most attractive setups currently in the market.
✅ Show your support by hitting the like button and
✅ Leaving a comment below! (What is You opinion about this Coin)
Your feedback and engagement keep me inspired to share more insightful market analysis with you!
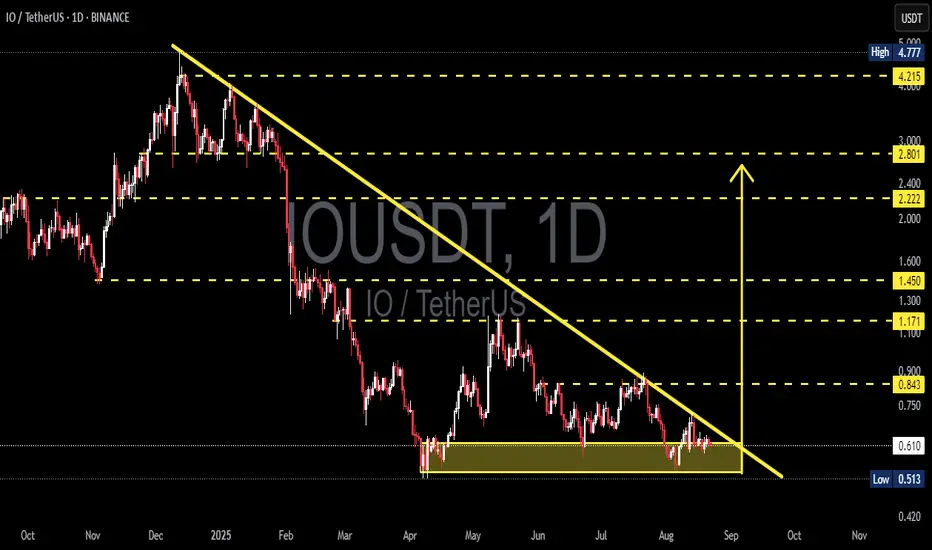
IOUSDT — Descending Triangle at Key Demand Zone!✨ Overview
The IOUSDT chart on the daily timeframe is showing a critical consolidation phase after a prolonged downtrend. Price is currently sitting inside the major demand zone 0.53–0.65, forming a descending triangle pattern — a classic setup that often leads to a decisive breakout move.
The falling trendline (yellow) is pressing down a series of lower highs, while the horizontal support around 0.60 remains intact. This reflects a supply vs demand compression: once this battle ends, the market usually delivers a strong directional move.
---
📈 Bullish Scenario (Breakout Potential)
1. Trendline Breakout
A daily close above the descending trendline would be the first signal that sellers are losing control.
Stronger confirmation comes with a successful reclaim of 0.843 (nearest horizontal resistance).
2. Bullish Targets
If a breakout occurs, price could aim for the following resistances step by step:
0.843 → breakout validation.
1.171 → psychological resistance.
1.450 → prior supply zone.
2.222 – 2.801 → expansion zone.
4.215 → major resistance & mid-term target.
3. Why Buyers May Be Confident
The 0.53–0.65 demand zone has held firmly since April 2025.
Bearish momentum is weakening, as sellers have failed to print significantly lower lows.
---
📉 Bearish Scenario (Breakdown Continuation)
1. Support Breakdown
A daily close below 0.513 would confirm a breakdown from the descending triangle.
The projected measured move points towards 0.37–0.40 as the next major target.
2. Retest Setup
After a breakdown, price may retest the 0.53–0.60 zone as new resistance before continuing lower.
Aggressive traders could look for short opportunities here.
3. Bearish Risk Factor
If a false breakdown occurs and price quickly recovers above 0.53–0.60, sellers may get trapped, potentially triggering a short squeeze rally.
---
🔑 Key Technical Takeaways
Descending Triangle → Typically bearish continuation, but an upside breakout can flip it into a strong bullish reversal signal.
Demand Zone 0.53–0.65 → The make-or-break area for buyers to defend.
Downtrend Line → As long as it remains unbroken, mid-term structure still favors sellers.
---
🎯 Conclusion
IOUSDT is now at a make-or-break junction:
Bullish case: breakout above trendline + reclaim of 0.843 could fuel momentum towards 1.171 and even 2.222.
Bearish case: daily close below 0.513 may unlock further downside into the 0.37 area.
Patience is key — waiting for a confirmed breakout or breakdown will provide clarity for the next strong move.
#IOUSDT #IO #CryptoAnalysis #DescendingTriangle #BreakoutSetup #BearishOrBullish #SupportResistance #PriceAction #TrendlineBreakout #CryptoTrading #TechnicalAnalysis
IOUSDT 1D#IO is moving inside a falling wedge pattern on the daily chart. Consider buying some #IO at the current price and near the support zone. In case of a breakout above the wedge resistance, the potential targets are:
🎯 $0.801
🎯 $0.884
🎯 $0.966
🎯 $1.083
🎯 $1.232
⚠️ As always, use a tight stop-loss and apply proper risk management.
IOUSDT Trade opportunityIOUSDT is trading within a robust descending channel, currently forming a potential bearish continuation pattern.
If the price breaks below the $1.482 level, it could lead to a new low. However, if this support holds, there could be a surprise reversal towards the key trendline shown on the chart.
Close attention is needed as this scenario unfolds. The chart provides detailed guidance.
Share your thoughts on this analysis.
IOUSDT Reversal SignalBINANCE:IOUSDT has broken out of a falling wedge on the 4H chart, signaling a potential trend reversal.
The price is trading above both the 50 EMA and 100 EMA, indicating growing bullish momentum.
A successful retest of the breakout zone could lead to a sharp move toward the $0.85–$1.10 level.
Resistance 1: $0.88
Resistance 2: $1.10
Stop Loss: $0.655
Io trade planIO/USDT Long Trade Setup | Daily Timeframe
📉 Structure: ABC Correction Completed
🚀 Elliott Wave Count: Wave 1 and 2 completed — potential Wave 3 breakout incoming
🔹 Entry Zone: 0.750 – 0.770 USDT
🔻 Stop-Loss: 0.666 USDT (below 78.6% Fib retracement)
🎯 Target 1 (Wave 3): 2.782 USDT (1.618 extension of Wave 1)
🎯 Target 2 (Wave 5): 14.865 USDT (1.618 extension from Wave 3
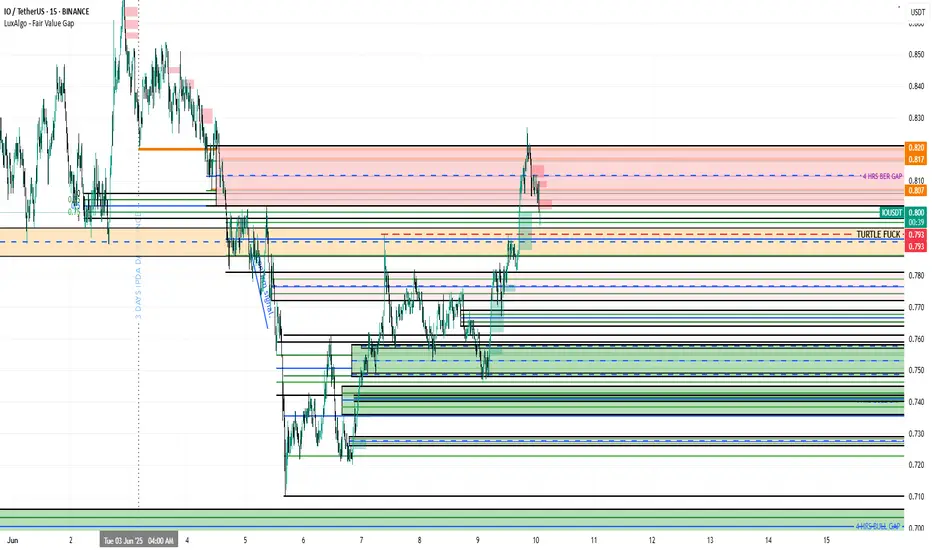
Trader Abdullah Masood Yu.TuIO/USDT pair on a 15-minute chart, and it looks like you're using LuxAlgo Fair Value Gaps, key levels/zones, and a lot of structural plotting to identify trade opportunities.
Observations:
Current Price: ~0.799 USDT
Just Rejected: From a significant 4H bearish fair value gap (FVG) zone around 0.807–0.820
Support Zones Below: Several green zones and liquidity blocks are stacked between 0.74–0.78
Key Resistance: Around 0.810–0.820
Label “TURTLE FK”** around 0.792 suggests a prior liquidity or manipulation area (possibly a sweep zone)
What You Can Do Now:
🔴 Bearish Case (Short Bias):
If you believe the rejection from the 4H FVG holds:
Short Entry Around 0.799–0.807 (if price pulls back again)
Stop-Loss: Just above the FVG zone (e.g., 0.821)
Target 1: ~0.792 (“TURTLE” zone — potential liquidity sweep)
Target 2: ~0.774
Final Target: Deeper green liquidity area around 0.750–0.740
You could also look for a break in structure on lower timeframes for added confirmation.
🟢 Bullish Case (Long Bias):
If you think the retracement is temporary and price will reclaim the FVG:
Long Entry: Only if price reclaims above 0.807 with strong volume
Stop-Loss: Below 0.793
Target 1: 0.817 (top of the FVG)
Target 2: 0.830 (clean breakout)
Neutral Plan (If You’re Unsure):
Wait for price to decisively break above 0.807 or fall below 0.789
Consider setting alerts at:
📈 > 0.807 (bullish breakout confirmation)
📉 < 0.789 (bearish breakdown into lower liquidity zones)
IOUSDT 1D#IO is sitting right on the neckline of a completed Inverse Head & Shoulders pattern and is on the verge of breaking out above the Descending Broadening Wedge on the daily chart.
A breakout from this confluence zone could trigger a strong bullish rally.
In case of a breakout, the targets are:
🎯 $1.401
🎯 $1.934
🎯 $2.366
🎯 $2.797
⚠️ Use a tight stop-loss.
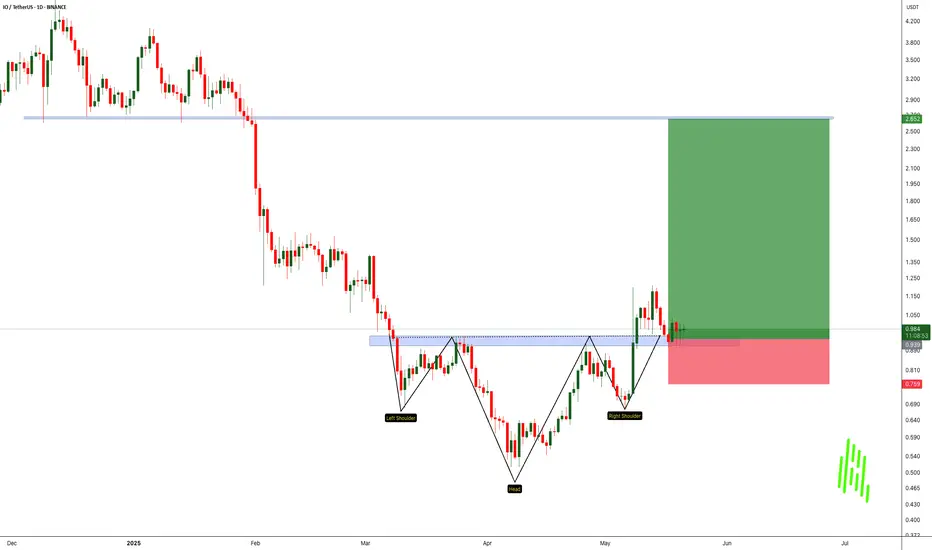
IOUSDT: Inverse Head & Shoulders Breakout – The Reversal is RealBINANCE:IOUSDT has just completed a textbook Inverse Head and Shoulders pattern, one of the most reliable reversal setups in technical analysis. After a prolonged downtrend that left the asset oversold and undervalued, the market has begun to shift. We’ve now seen a clean breakout above the neckline and a healthy retracement back to it. A classic confirmation signal that often precedes strong bullish moves.
This shift is further supported by the emergence of higher highs and higher lows on the smaller timeframes, suggesting that bullish momentum is building. With the downtrend now exhausted, BINANCE:IOUSDT looks poised to begin a new uptrend that could offer solid upside potential for early entrants.
As always, risk management is key. While the pattern setup is strong, it’s crucial to place stop losses just below the right shoulder or neckline to protect against unexpected volatility. The market doesn’t offer guarantees, but this setup offers high-probability conditions worth paying attention to.
BINANCE:IOUSDT Currently trading at $0.98
Buy level : Above $0.95
Stop loss : Below $0.76
Target : $2.65
Max leverage 3x
Always keep stop loss
Follow Our Tradingview Account for More Technical Analysis Updates, | Like, Share and Comment Your thoughts