JASMY: Sideways Consolidation Below Key ResistanceJASMY: Sideways Consolidation Below Key Resistance – Bearish Structure Retains Full Dominance
JASMY has been maintaining a relatively subdued sideways consolidation pattern over the past 10 days without flashing any clear breakout signals. The price action remains tightly compressed directly benea
Don't Chase JASMYUSD Yet – Here's What I'm Waiting For🚨 Don't Chase JASMY Yet – Here's What I'm Waiting For
CRYPTOCAP:JASMY is now approaching a key resistance area, and this isn't where I'm want to open fresh longs. If sellers react from this level, a pullback into the 0.004290 –0.004090 demand zone would be a healthy retracement, not a bearish bre
JASMY Rebounds from Demand Zone | Bullish ContinuationJASMY is showing signs of renewed bullish momentum after completing a healthy pullback into a well-defined demand zone. The highlighted green area has acted as a strong support level throughout recent price action, attracting buyers each time price revisited it. The latest reaction from this zone su
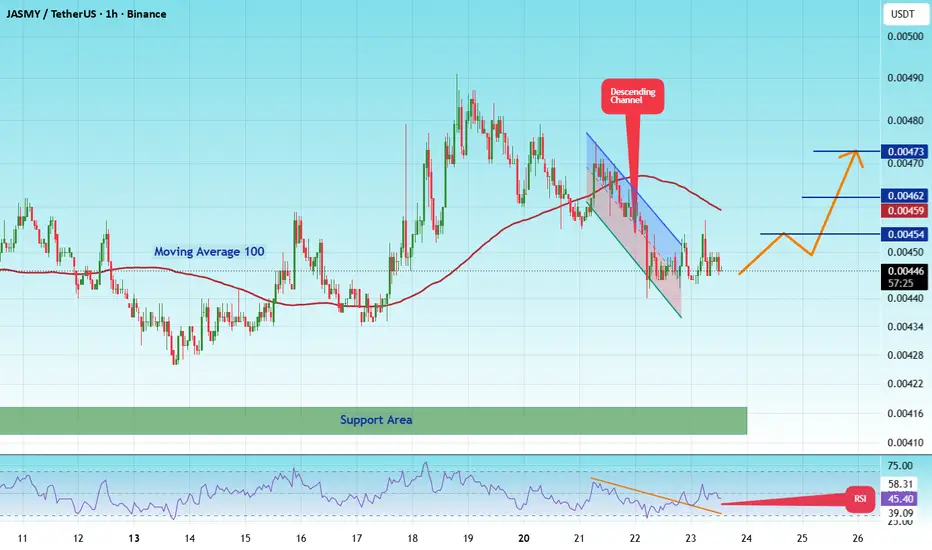
#JASMYUSDT GOOD TIME TO BUY JASMY I MARK THE TARGETS#JASMY
The price is moving within a descending channel on the 1-hour timeframe and has reached the lower boundary. It is now poised for a bounce and is expected to retest this boundary.
The Relative Strength Index (RSI) indicates a downward trend, which is likely to continue given the overbought c
JASMY: Bearish Structure ReinforcedJASMY: Bearish Structure Reinforced – Trend-Following Opportunity to Enter Short Positions
JASMY is moving highly accurately in line with the primary bearish projection established in our previous analysis. All key technical parameters across the market are currently aligned in favor of a downward
#JASMYUSDT GOOD TIME TO BUY JASMY I MARK THE TARGETS#JASMY
The price is moving within a descending channel on the 1-hour timeframe and has reached the lower boundary. It is now poised for a bounce and is expected to retest this boundary.
The Relative Strength Index (RSI) indicates a downward trend, which is likely to continue given the overbought c
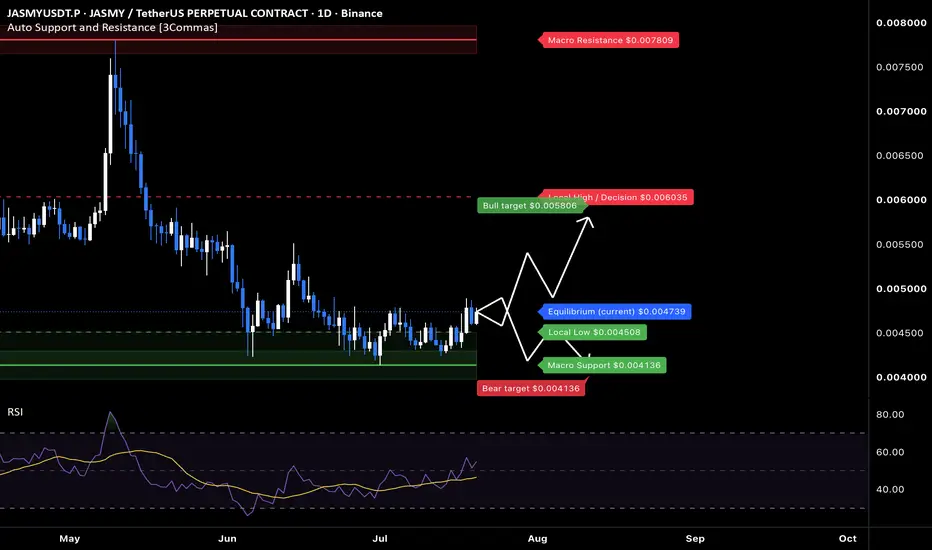
JASMY: local squeeze with $0.0058 destinationThe Macro Picture 🗺️
After the May spike to $0.007809 faded, JASMY built a base in the lower range and is now grinding higher off it, with price at $0.004743 and RSI reclaiming 50. Momentum is starting to rotate back toward the buyers.
The Setup ⚙️
The Range Floor 🟢
$0.004136 (Macro Support) is t
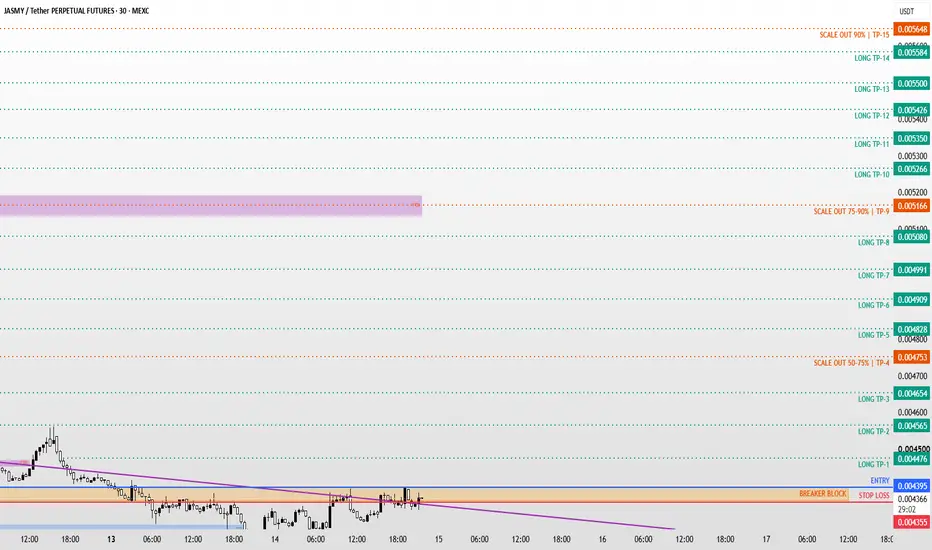
JASMY / JASMYUSDT Long Setup | Breaker Block ReclaimMARKET ANALYSIS
JASMY is currently reacting from a key technical area highlighted on the chart.
As long as the protected support zone remains intact, the bullish market structure remains valid and higher liquidity targets may continue to attract price action.
A breakdown below the invalidation
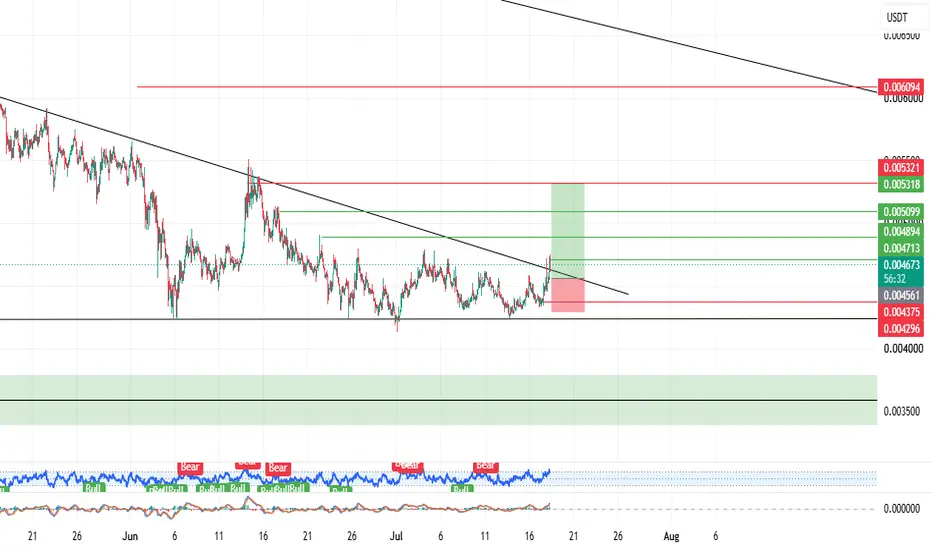
JASMY USDT LONG SIGNAL#84. Jasmy/USDT – Trade Setup (LONG)
📈 Position Type: LONG
🕒 Timeframe: 1H
📊 Market: Futures
💰 Entry Zone:
0.0045688
0.004375
🛑 Stop-Loss:
0.004290
🎯 Take-Profit Targets:
• TP1: 0.004713
• TP2: 0.004894
• TP3: 0.005099
• TP4: 0.005319
⚙️ Leverage:
5 *3
▫️ After TP1, move SL to E
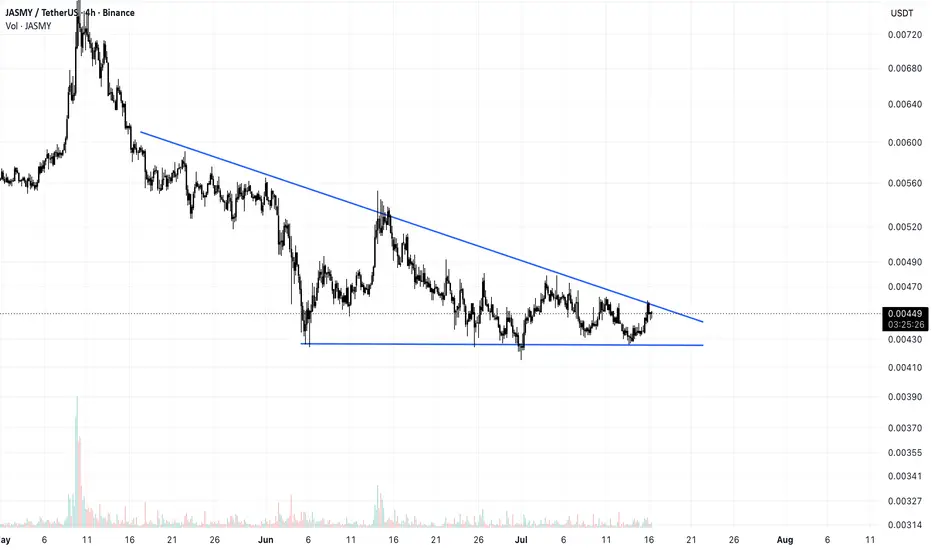
JASMY/USDT (4h) Testing Resistance Inside a Descending TriangleJASMY/USDT is consolidating inside a descending triangle on the 4H chart. Price recently bounced from horizontal support and is now testing the descending resistance line.
A confirmed breakout above resistance could open the way for bullish continuation. Rejection from the trendline may send price
See all ideas
Summarizing what the indicators are suggesting.
Oscillators
Neutral
SellBuy
Strong sellStrong buy
Strong sellSellNeutralBuyStrong buy
Oscillators
Neutral
SellBuy
Strong sellStrong buy
Strong sellSellNeutralBuyStrong buy
Summary
Neutral
SellBuy
Strong sellStrong buy
Strong sellSellNeutralBuyStrong buy
Summary
Neutral
SellBuy
Strong sellStrong buy
Strong sellSellNeutralBuyStrong buy
Summary
Neutral
SellBuy
Strong sellStrong buy
Strong sellSellNeutralBuyStrong buy
Moving Averages
Neutral
SellBuy
Strong sellStrong buy
Strong sellSellNeutralBuyStrong buy
Moving Averages
Neutral
SellBuy
Strong sellStrong buy
Strong sellSellNeutralBuyStrong buy
Displays a symbol's price movements over previous years to identify recurring trends.