JASMY Chart Today $JASMY Prediction October 2026JASMYUSDT is flashing a classic bearish Head and Shoulders pattern on the 2-hour chart, with price now testing and breaking below the rising trendline support.
Key Technical Setup (as of October 6, 2026):
Left Shoulder, Head, and Right Shoulder clearly marked
Rising blue trendline acting as dynamic support is being rejected
Neckline zone around the 0.0054–0.0055 area
Measured move target points toward the 0.00490–0.00480 zone (−7% to −8% from current levels)
The pattern is completing after a s
In-depth trading ideas
JASMY: Breakout from 2025 Downtrend Leads to Ascending WedgeTechnical Analysis Overview (Daily Chart):
CRYPTOCAP:JASMY has achieved a major technical milestone on the daily timeframe by breaking out above the primary Descending Trendline From 2025 (cyan line). Following this macro trend shift, price action has transitioned into an Ascending Wedge Formation (purple lines), creating a well-defined consolidation phase.
Key Technical Observations:
Successful Macro Breakout: The long-standing 2025 descending resistance line has been breached, inva
$JASMY is about to Breakout from below, Selling HereJASMY is currently retesting the support of the trendline, holding it strong, meanwhile the market is losing bullish momentum at this area, which will result to a possible break-out from here.
As you can see, PEOPLE and JASMY share the same patterns for the moment, PEOPLE already broken from below of the trendline, expecting for CRYPTOCAP:JASMY to do the same.
Once I see a break-out from below 0.005168, I am going to post a short with an invalidation key level.
$JASMY 2026: Is JasmyCoin Ready for a 26x Breakout?CRYPTOCAP:JASMY Price Prediction 2026: Is JasmyCoin Ready for a 26x Breakout?
Our #JASMY Accumulation Zone $0.0044–$0.0032 filled ✅
Price is now 83% up from our entry zone.
JASMY weekly chart is flashing a major bullish reversal after a -98% crash and 630 days of downtrend.
✅ Falling channel support held
✅ Same setup as the +1,900% rally
Key level: Bullish flip above $0.00783
Macro Targets: $0.0078 → $0.020 → $0.050 → $0.15
Stop Loss: $0.00273 (weekly close)
TA Only. Not Financial Advice.
JASMY Breakout Setup: The Bigger Downtrend May Be Ready to BreakThe bigger downtrend is still the main obstacle, but JASMY is showing signs that this structure could be broken soon.
I’m watching for a breakout, followed by a pullback and confirmation before taking the trade.
The chart may look a little crowded, but these lines are useful for analysis and confirmation. They help us see where the current structure starts, where the breakout needs to happen, and where the next target levels are located.
After the previous downward move, JASMY went through a
JASMY: The bottom is near. Now the whole game is for $0.00783JASMY/USDT on the weekly chart has entered a more interesting phase. After a prolonged decline, price broke out of the descending structure and has already completed the key retest. The market should now be assessed not from the perspective of whether a bottom has formed, but from whether JASMY can develop the recovery that has begun.
The chart shows a clear sequence: breakout, retest, attempt to continue. Price is holding around $0.005, and the broken structure no longer looks like the rigi
#Jasmy broke out of multi year downtrend what can we expect?JASMY has finally broken above a long-term descending trendline that has been controlling price for more than a year.
The key level now is the breakout/retest zone.
Bullish scenario: If JASMY holds above the broken trendline and successfully confirms the retest, this could signal a larger trend reversal and open the door toward the next major resistance areas.
The chart currently shows a potential path toward the 0.0090 area, which would represent a significant move from the current level.
I
JASMY / JASMYUSDT Long Setup | Breaker Block ReclaimMARKET ANALYSIS
JASMY is currently reacting from a key technical area highlighted on the chart.
As long as the protected support zone remains intact, the bullish market structure remains valid and higher liquidity targets may continue to attract price action.
A breakdown below the invalidation level would weaken the current bullish scenario and require a reassessment of market conditions.
📍 Entry, Stop Loss and Take Profit levels are marked directly on the chart.
━━━━━━━━━━━━━━
⚠️ DISC
#JASMY Weekly Apex Setup – Massive 300%+ Reversal Potential!JASMY — Massive Falling Wedge / Descending Triangle Breakout on Weekly Chart! 🚀📈
CRYPTOCAP:JASMY (JasmyCoin/USDT) has squeezed right into the apex of a massive multi-year pattern on the 1W timeframe! Price is sitting right at absolute macro support, setting up an exceptional risk-to-reward opportunity.
Whether you read this structure as a Falling Wedge or a Descending Triangle bouncing off the $0.0038–$0.0042 horizontal demand zone, the trigger remains identical: a weekly close breaking ab
JASMY Technical Analysis: Approaching a Critical Breakout ZoneJASMY is showing signs of recovery after bouncing from recent lows, with buyers pushing price toward key resistance. However, the broader trend remains bearish as price continues trading beneath a descending trendline.
Price is approaching a critical decision point near the $0.0044 to $0.0046 resistance zone, where the descending trendline and a major volume profile level converge. A confirmed breakout could signal a shift in momentum and open the door for higher resistance levels.
Failure to b
JASMY at a Critical Turning Point — Breakout or Breakdown?💵 Coin: CRYPTOCAP:JASMY
⌛ Time Frame: 1W (Weekly)
📍 Current Price: around $0.00391
🟨 Major Support Zone: $0.0039 – $0.0029
📐 Pattern: Descending Triangle / Compression Pattern
📉 Trend: Still in a medium- to long-term downtrend
JASMY is currently in a very interesting technical area because the price has experienced long-term bearish pressure and has continued to form a series of Lower Highs (LH).
The chart shows a descending trendline that has been pressing price downward from around $0.0591
JASMY ForecastBINANCE:JASMYUSDT Trade Rationale:
The logic behind this trade is based on the higher-timeframe bearish trend. The bearish impulses remain strong, while the bullish corrective moves are relatively slow and weak.
On the lower timeframe, we can also see a strong bearish move followed by a slow bullish correction, which increases the probability of another bearish leg.
A clear negative HD (Hidden Divergence) is also supporting the bearish scenario.
⚠️ Note: This is a Limit Order setup and theref
JASMY / JASMYUSDT Bullish Setup | Futures Trade IdeaMARKET ANALYSIS
JASMY is currently reacting from a key technical area highlighted on the chart.
As long as the protected support zone remains intact, the bullish market structure remains valid and higher liquidity targets may continue to attract price action.
A breakdown below the invalidation level would weaken the current bullish scenario and require a reassessment of market conditions.
📍 Entry, Stop Loss and Take Profit levels are marked directly on the chart.
━━━━━━━━━━━━━━
⚠️ DISC
JASMY AT A CRITICAL TURNING POINT — Major Breakout or Breakdown?📊 Technical Analysis — CRYPTOCAP:JASMY / USDT
⏳ Time Frame: 1 Week (1W)
📐 Pattern: Long-Term Descending Triangle
🟨 Key Support Zone: $0.00420 – $0.00320
🔻 Major Descending Resistance: From approximately $0.05913
---
📐 PATTERN STRUCTURE
CRYPTOCAP:JASMY is currently trading inside a long-term descending triangle structure on the weekly timeframe.
🔻 The descending yellow trendline has acted as dynamic resistance since the major high around $0.05913, creating a sequence of lower highs and ma
JASMY/USDT H1: Testing the upper boundary of the range🎯 TP1: $0.004059 (+0.85%) │ TP2: $0.004033 (+1.48%)
🛑 SL: $0.004149 (-1.35%) │ R/R: 1 : 1.1
⚠️ SL is placed beyond the nearest candle wicks to reduce the risk of accidental triggering.
FUNDAMENTAL BACKGROUND
The asset is moving without its own catalysts — no fresh news on the JASMY project has been recorded over the past week, remaining dependent on technical factors.
TECHNICAL PICTURE
The price of $0.004094 is testing the upper boundary of the last 100 candles' range ($0.003900–$0.004134). AD
JASMY: Sustained Consolidation Beneath $0.00425 Support FloorJASMY: Sustained Consolidation Beneath $0.00425 Support Floor – Strategic Short Positioning Along Macro Downtrend
JASMY continues to reinforce its primary downward trend structure after cleanly breaking below the crucial $0.00425 support baseline and maintaining a tight consolidation range beneath this floor for over a week. This prolonged suppression confirms that buy-side support has been thoroughly depleted, displaying a total absence of bullish absorption required to trigger a technical tr
JASMY: Decisive Breakdown of $0.0042 SupportJASMY: Decisive Breakdown of $0.0042 Support – Second Short Execution Window with Superior RR
JASMY has officially triggered its next downward expansion wave in strict alignment with our prior technical outlook, solidifying its primary macro downtrend structure. Although the price action over the past 20 days progressed gradually—delivering a modest 1R yield as prices consolidated directly above the $0.0042 support baseline—yesterday's session marked a pivotal technical breakdown as bears deci
JASMY: Sideways Consolidation Below Key ResistanceJASMY: Sideways Consolidation Below Key Resistance – Bearish Structure Retains Full Dominance
JASMY has been maintaining a relatively subdued sideways consolidation pattern over the past 10 days without flashing any clear breakout signals. The price action remains tightly compressed directly beneath the $0.005 psychological round number resistance floor, while sitting completely underneath the dynamic MA100 trendline barrier. The temporary absence of institutional volume keeps technical recove
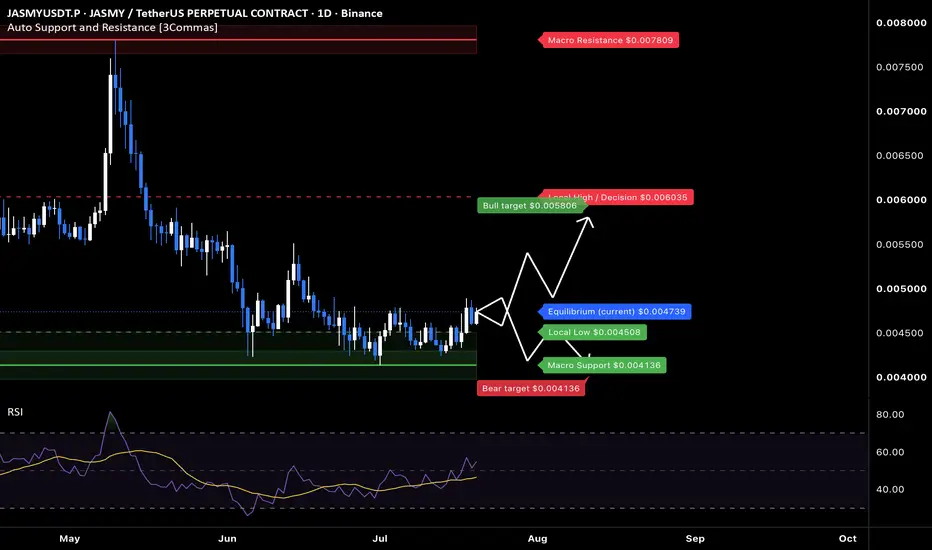
JASMY: local squeeze with $0.0058 destinationThe Macro Picture 🗺️
After the May spike to $0.007809 faded, JASMY built a base in the lower range and is now grinding higher off it, with price at $0.004743 and RSI reclaiming 50. Momentum is starting to rotate back toward the buyers.
The Setup ⚙️
The Range Floor 🟢
$0.004136 (Macro Support) is the demand base, with $0.004508 (Local Low) as the nearer shelf. Both have held, and that's the floor this range pivots on.
The Decision Point 🔴
$0.006035 (Local High) is the gate. The $0.005810 measu
JASMY Rebounds from Demand Zone | Bullish ContinuationJASMY is showing signs of renewed bullish momentum after completing a healthy pullback into a well-defined demand zone. The highlighted green area has acted as a strong support level throughout recent price action, attracting buyers each time price revisited it. The latest reaction from this zone suggests that buyers remain in control and continue to defend higher prices.
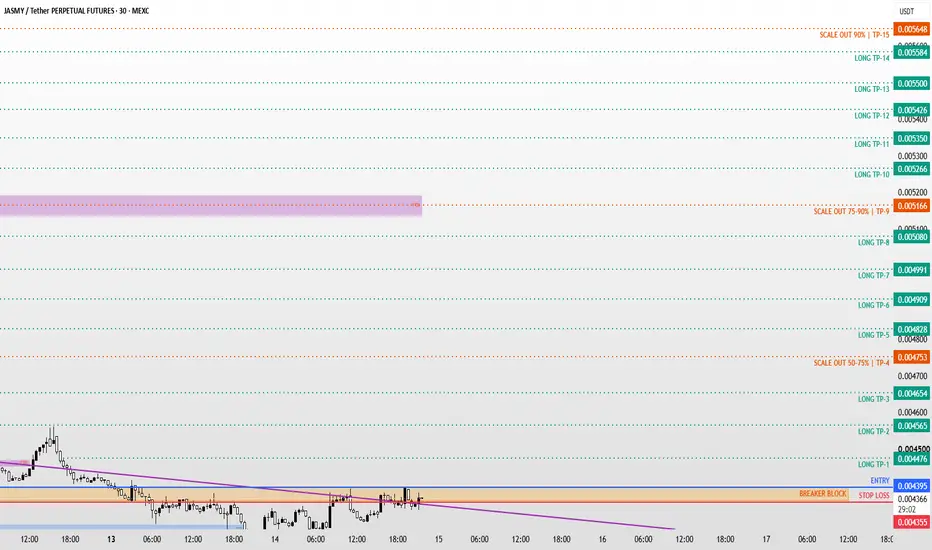
JASMY / JASMYUSDT Long Setup | Breaker Block ReclaimMARKET ANALYSIS
JASMY is currently reacting from a key technical area highlighted on the chart.
As long as the protected support zone remains intact, the bullish market structure remains valid and higher liquidity targets may continue to attract price action.
A breakdown below the invalidation level would weaken the current bullish scenario and require a reassessment of market conditions.
📍 Entry, Stop Loss and Take Profit levels are marked directly on the chart.
━━━━━━━━━━━━━━
⚠️ DISC