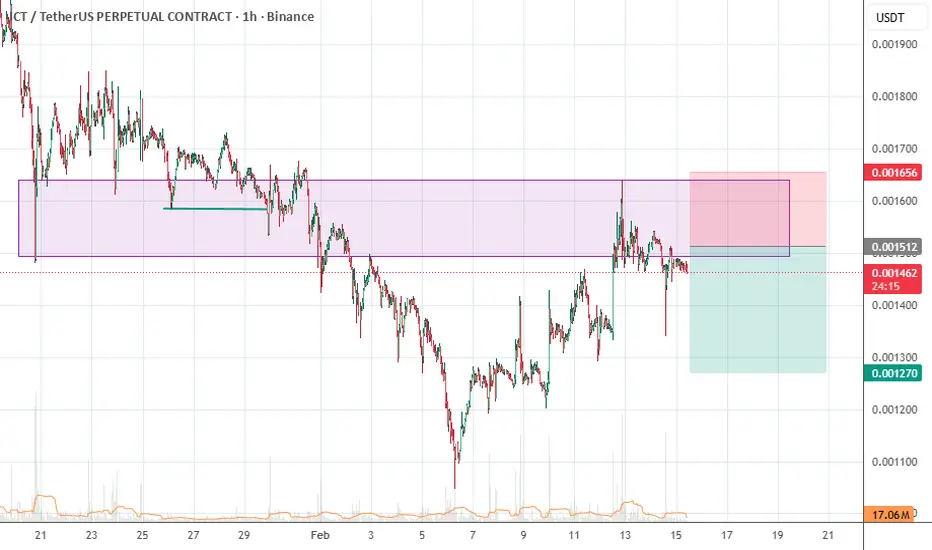
JCT USDT LONG SIGNAL#32. JCT/USDT – Trade Setup (LONG)
📈 Position Type: LONG
🕒 Timeframe: 1H
📊 Market: Futures
💰 Entry Zone:
0.003804
0.0036
🛑 Stop-Loss:
0.003485
🎯 Take-Profit Targets:
• TP1: 0.0040
• TP2: 0.004242
• TP3: 0.004479
• TP4. 0.004737
Tp5.
⚙️ Leverage:
5*3
▫️ After TP1, move SL to Entry +
JANCTION / Tether
No trades
No trades
Compare with JCT/USDT
JCTUSDT Potential Long Setup | High-Risk Bounce Play📈 Market: JCTUSDT Perpetual (Bybit)
⏰ Timeframe: 15m
Trade Setup
Entry: 0.003900
Take Profit: 0.004043
Stop Loss: 0.003842
Why I'm Watching This
After an aggressive sell-off, price is attempting to stabilize near local lows. If buyers defend this support zone, a short-term relief rally toward resi
JCTUSDT 1D#JCT has broken above the daily SMA50 and is currently testing the resistance zone. Consider entering this coin only after a confirmed breakout. In that case, the potential upside targets are:
🎯 $0.005251
🎯 $0.006152
🎯 $0.007298
🎯 $0.007896
🎯 $0.008755
⚠️ Always use a tight stop-loss and maintain
JCT / USDT — Stage 1 Base & Early Rotation PlayHey there, how you doing so far?
March 23, 2026
JCT is part of the emerging on-chain / infrastructure + microcap rotation narrative, a segment that often attracts capital after major sectors (AI, L1s, DeFi) start cooling.
These types of assets tend to move later in the cycle, but when they do, t
JCTUSDT — Price at Ceiling. Who's Left to Buy?Spot at 283.17M versus futures at 4.56B — F/S ratio 16.1x High with spot dollar 662.9K against futures 10.67M. Futures are running this at sixteen times the spot volume. Price at 0.002341 with futures basis nearly flat at 0.002343. The 42% bounce at 22.3x parabolic from demand is already printed. Th
Will JCT continue to fall? (4H)The long-term trend has been broken, and we have a bearish CH on the chart.
A pullback and supply zone has formed, and in this area we are looking for short sell positions.
The targets are marked on the chart. Move to breakeven at the first target.
A daily candle close above the invalidation leve
JCTUSDT: Rectangle Breakdown — Bearish Trend ContinuationPrice has broken down from a consolidation rectangle, which formed after a strong impulsive move lower. This structure acted as a bearish continuation pattern , and the downside breakout confirms that sellers remain in control.
After the loss of the lower boundary of the rectangle, price is expe
See all ideas
Summarizing what the indicators are suggesting.
Oscillators
Neutral
SellBuy
Strong sellStrong buy
Strong sellSellNeutralBuyStrong buy
Oscillators
Neutral
SellBuy
Strong sellStrong buy
Strong sellSellNeutralBuyStrong buy
Summary
Neutral
SellBuy
Strong sellStrong buy
Strong sellSellNeutralBuyStrong buy
Summary
Neutral
SellBuy
Strong sellStrong buy
Strong sellSellNeutralBuyStrong buy
Summary
Neutral
SellBuy
Strong sellStrong buy
Strong sellSellNeutralBuyStrong buy
Moving Averages
Neutral
SellBuy
Strong sellStrong buy
Strong sellSellNeutralBuyStrong buy
Moving Averages
Neutral
SellBuy
Strong sellStrong buy
Strong sellSellNeutralBuyStrong buy
Displays a symbol's price movements over previous years to identify recurring trends.
Frequently asked questions
The current price of JANCTION / Tether (JCT) is 0.002246 USDT — it has fallen −1.29% in the past 24 hours. Try placing this info into the context by checking out what coins are also gaining and losing at the moment and seeing JCT price chart.
JANCTION / Tether price has fallen by −40.17% over the last week, its month performance shows a −41.70% decrease, and as for the last year, JANCTION / Tether has increased by 124.60%. See more dynamics on JCT price chart.
Keep track of coins' changes with our Crypto Coins Heatmap.
JANCTION / Tether (JCT) reached its highest price on Nov 10, 2025 — it amounted to 0.012375 USDT. Find more insights on the JCT price chart.
See the list of crypto gainers and choose what best fits your strategy.
JANCTION / Tether (JCT) reached the lowest price of 0.000937 USDT on Feb 6, 2026. View more JANCTION / Tether dynamics on the price chart.
See the list of crypto losers to find unexpected opportunities.
The safest choice when buying JCT is to go to a well-known crypto exchange. Some of the popular names are Binance, Coinbase, Kraken. But you'll have to find a reliable broker and create an account first. You can trade JCT right from TradingView charts — just choose a broker and connect to your account.
Crypto markets are famous for their volatility, so one should study all the available stats before adding crypto assets to their portfolio. Very often it's technical analysis that comes in handy. We prepared technical ratings for JANCTION / Tether (JCT): today its technical analysis shows the strong sell signal, and according to the 1 week rating JCT shows the strong sell signal. And you'd better dig deeper and study 1 month rating too — it's strong sell. Find inspiration in JANCTION / Tether trading ideas and keep track of what's moving crypto markets with our crypto news feed.
JANCTION / Tether (JCT) is just as reliable as any other crypto asset — this corner of the world market is highly volatile. Today, for instance, JANCTION / Tether is estimated as 10.79% volatile. The only thing it means is that you must prepare and examine all available information before making a decision.
You can discuss JANCTION / Tether (JCT) with other users in our public chats, Minds or in the comments to Ideas.