JST/USDT (4h) Compressing Inside a Bullish PennantJST/USDT is consolidating inside a bullish pennant on the 4H chart after a strong impulsive move higher. Price is now trading near the apex, where a breakout decision may come soon.
A confirmed breakout above the upper trendline could support bullish continuation and open the way for a fresh leg up
Compare with JST/USDT
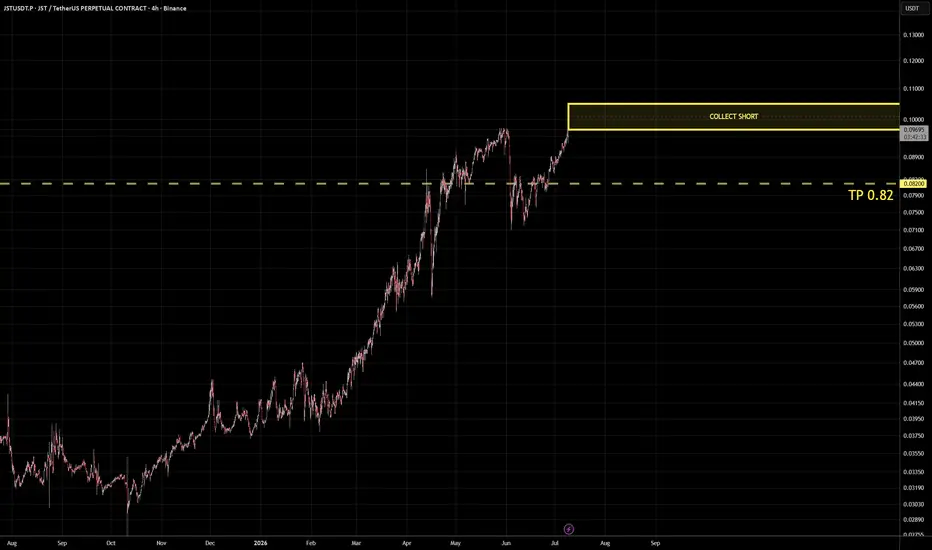
JST cryptoProverbs 16:18 — "Pride goeth before destruction, and an haughty spirit before a fall."
JST riseth to 0.105 — the haughty spirit unfolds.
There the shorts are gathered, layer upon layer.
Patient. Silent. Waiting.
TP: 0.082 — the destruction hath come.
Pride could not sustain the height.
#JST #Crypto
JST Is on the Verge of a Bearish TrendA strong sell-off occurred on the JST chart, causing the market structure to turn bearish.
Since this decline was deep and sharp, occurring in the form of a spike, price is likely to retrace upward and fill part of this impulsive move. Such spike movements often behave similarly to gaps and tend to
Satoshi Frame | JST Consolidation Box ,Breakout or Fakeout?🔥 Welcome to SatoshiFrame — let's dive into today's JST analysis.
☕️ After the recent sell-off, JST on the 4H chart has formed a consolidation box. Price has successfully built a multi-timeframe trading range just below the top of this box.
✅ Bullish Scenario
If buyers manage to break above the bo
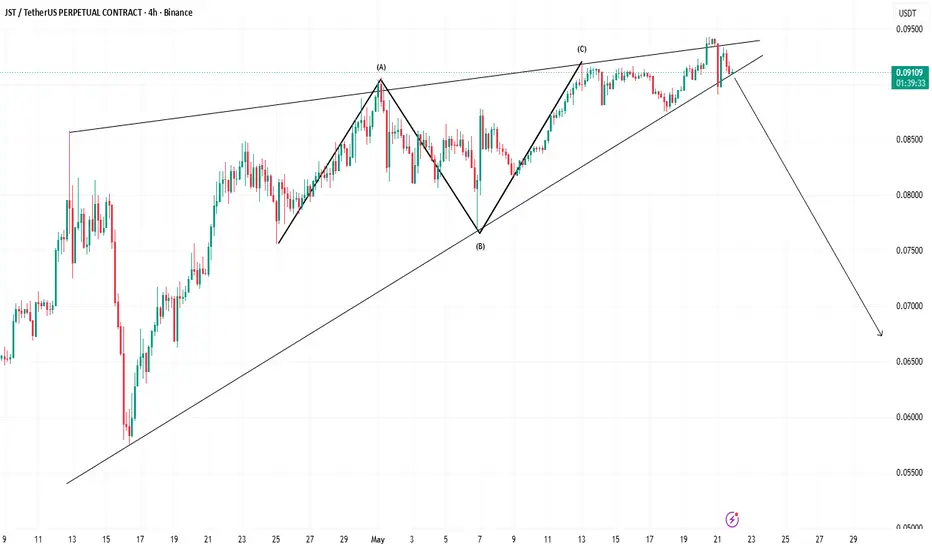
JSTUSDT 4H Analysis - Contracting Ascending Triangle + Elliott WThe chart is forming a Contracting Ascending Triangle with converging trendlines. Within this structure, we have a completed Elliott Wave Regular Flat correction on the 4H timeframe labeled (A)-(B)-(C):
(A): Initial decline
(B): Sideways corrective bounce
(C): Final leg completing the flat pattern
JST: bullish breakout or pullback? key levels to watch todayJST
Who’s been quietly grinding up while everyone stares at the majors? According to market chatter, renewed interest around the Tron ecosystem and higher on‑chain activity has pushed fresh volume into JST, and you can see that spill right into this breakout. Today’s move ripped through local resi
Just —Another uptrend confirmed (Bullish altcoins market)JSTUSDT (Just) has been rising since August 2024. No new lows since this date.
Here we have another Cryptocurrency project that has been growing long-term, a clear uptrend on the chart.
Come April 2025, when the market produced a major cleanse, JSTUSDT ended up with a higher low. Then comes Octobe
JST: ready for a breakout or just a fakeout? key levels aheadJST. Ready for a small-cap wake up call or just another fakeout? While majors are cooling off after the latest pump, according to market chatter fresh speculative money is rotating into cheaper DeFi names, and JST has quietly picked up volume on that move. On this backdrop, the current 4H setup look
See all ideas
Summarizing what the indicators are suggesting.
Oscillators
Neutral
SellBuy
Strong sellStrong buy
Strong sellSellNeutralBuyStrong buy
Oscillators
Neutral
SellBuy
Strong sellStrong buy
Strong sellSellNeutralBuyStrong buy
Summary
Neutral
SellBuy
Strong sellStrong buy
Strong sellSellNeutralBuyStrong buy
Summary
Neutral
SellBuy
Strong sellStrong buy
Strong sellSellNeutralBuyStrong buy
Summary
Neutral
SellBuy
Strong sellStrong buy
Strong sellSellNeutralBuyStrong buy
Moving Averages
Neutral
SellBuy
Strong sellStrong buy
Strong sellSellNeutralBuyStrong buy
Moving Averages
Neutral
SellBuy
Strong sellStrong buy
Strong sellSellNeutralBuyStrong buy
Displays a symbol's price movements over previous years to identify recurring trends.
Frequently asked questions
The current price of Just / Tether USD (JST) is 0.099343 USDT — it has fallen −0.21% in the past 24 hours. Try placing this info into the context by checking out what coins are also gaining and losing at the moment and seeing JST price chart.
Just / Tether USD price has risen by 0.90% over the last week, its month performance shows a 20.88% increase, and as for the last year, Just / Tether USD has increased by 166.16%. See more dynamics on JST price chart.
Keep track of coins' changes with our Crypto Coins Heatmap.
Just / Tether USD (JST) reached its highest price on Apr 5, 2021 — it amounted to 0.199000 USDT. Find more insights on the JST price chart.
See the list of crypto gainers and choose what best fits your strategy.
Just / Tether USD (JST) reached the lowest price of 0.002889 USDT on May 7, 2020. View more Just / Tether USD dynamics on the price chart.
See the list of crypto losers to find unexpected opportunities.
The safest choice when buying JST is to go to a well-known crypto exchange. Some of the popular names are Binance, Coinbase, Kraken. But you'll have to find a reliable broker and create an account first. You can trade JST right from TradingView charts — just choose a broker and connect to your account.
Crypto markets are famous for their volatility, so one should study all the available stats before adding crypto assets to their portfolio. Very often it's technical analysis that comes in handy. We prepared technical ratings for Just / Tether USD (JST): today its technical analysis shows the neutral signal, and according to the 1 week rating JST shows the buy signal. And you'd better dig deeper and study 1 month rating too — it's buy. Find inspiration in Just / Tether USD trading ideas and keep track of what's moving crypto markets with our crypto news feed.
Just / Tether USD (JST) is just as reliable as any other crypto asset — this corner of the world market is highly volatile. Today, for instance, Just / Tether USD is estimated as 5.14% volatile. The only thing it means is that you must prepare and examine all available information before making a decision. And if you're not sure about Just / Tether USD, you can find more inspiration in our curated watchlists.
You can discuss Just / Tether USD (JST) with other users in our public chats, Minds or in the comments to Ideas.