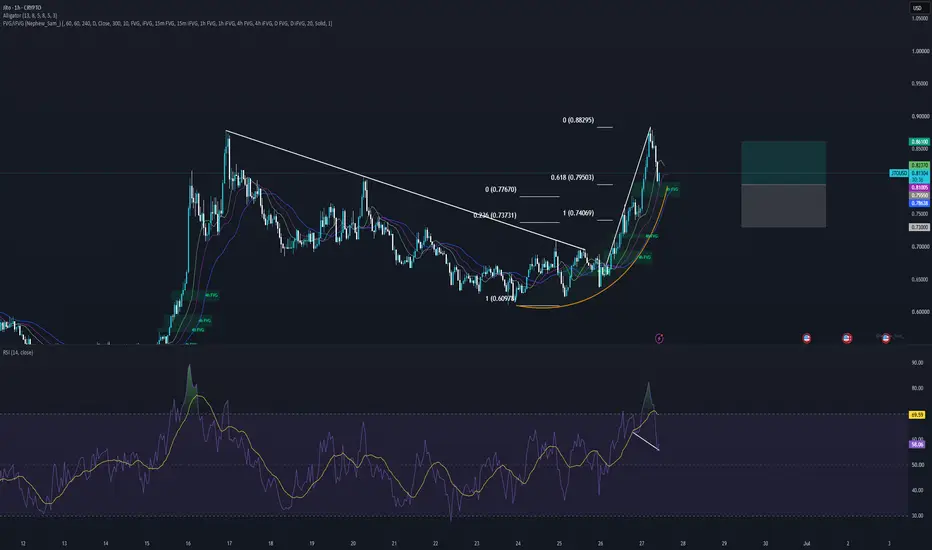
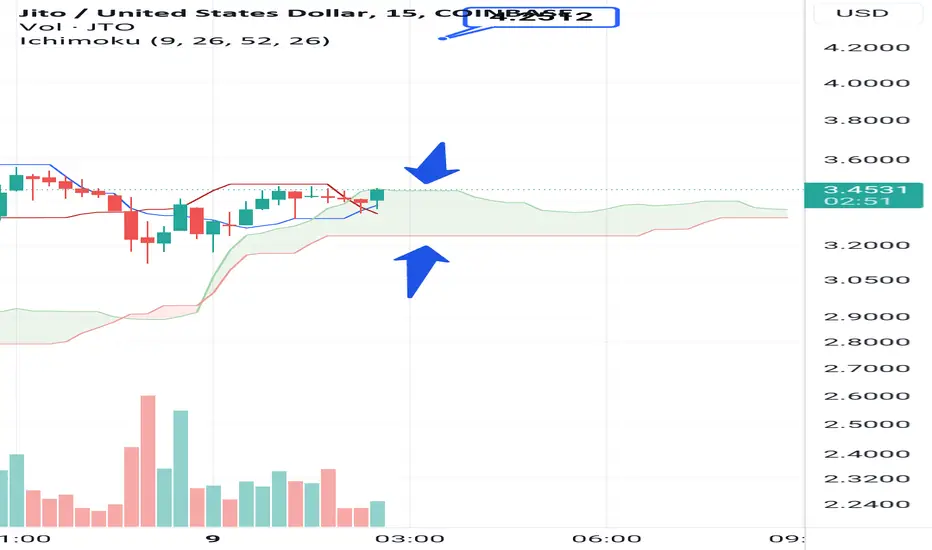
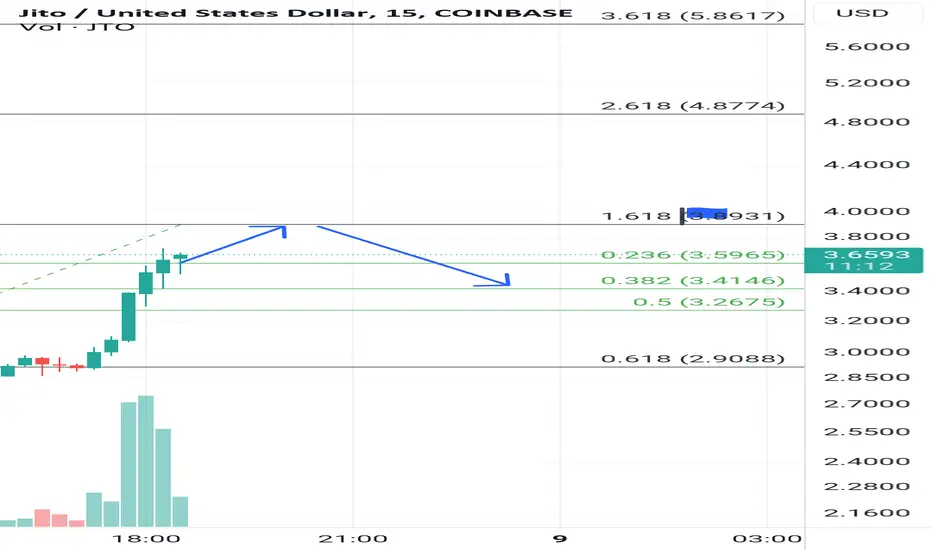
Jito Potential Potential Bullish ContinuationJito price action seems to exhibit signs of potential Bullish momentum as the price action may form a credible Higher Low with multiple confluences through key Fibonacci and Support levels which presents us with a potential long opportunity.
Courtesy of the Wealth Miners for the selection.
Trade Plan:
Entry : CMP
Stop Loss : 0.73
TP 0.9 - 1: - 0.8610
In-depth trading ideas
Consolidation leads to....?Turns out the last play was actually strength! Sideways action has finally led to a nice breakout. With alt coins popping off left and right, and a clean setup off support here, I think we have a pretty easy RR trade.
This is one of the most simple and classic crypto trades. Breakout longs. And now we are at an even mo betta technical level, the retest of that breakout. Prior highs currently acting as support.
If this continues, You can work with a very tight risk while targeting 3x or more whatever you are risking. Stops below the breakout level, giving enough room for some liquidity sweeps in case we get one or more of those gnarly wicks on the move up up and away from this BnB level
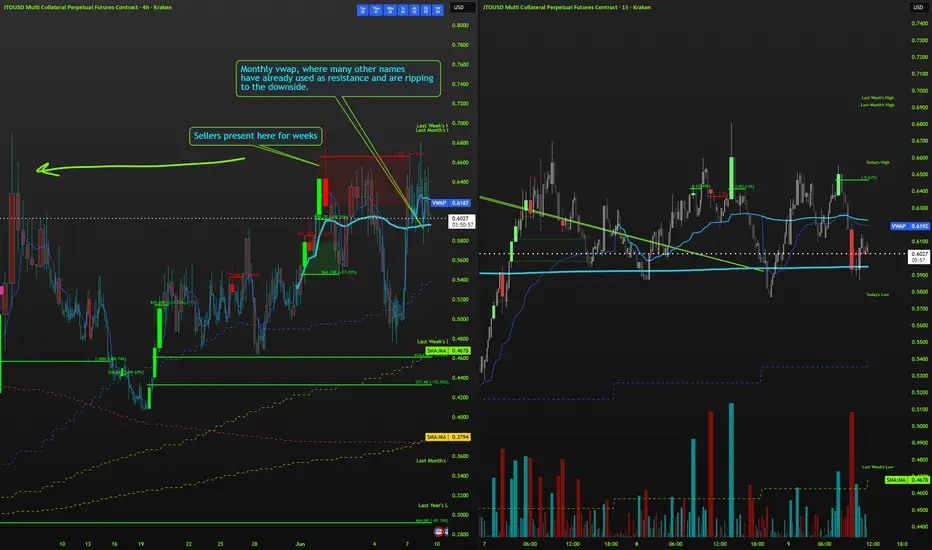
Laggard or Strength? To be frank, I expect this to melt down. If Bitcoin breaks it's lows and heads towards the next large support zone around 50k, This should melt down. Targetting the 50dma (green dashed line) surrounded by those green vpoc zones, and even further. Sweep the lows baby.
BUT, to play both sides, we are showing clear strength by holding this support while the broader market pulls back.
IF we see a bounce in the broader market soon, and JTO here does not melt down from monthly vwap before that bounce occurs, it could be a setup for a huge move to the upside.
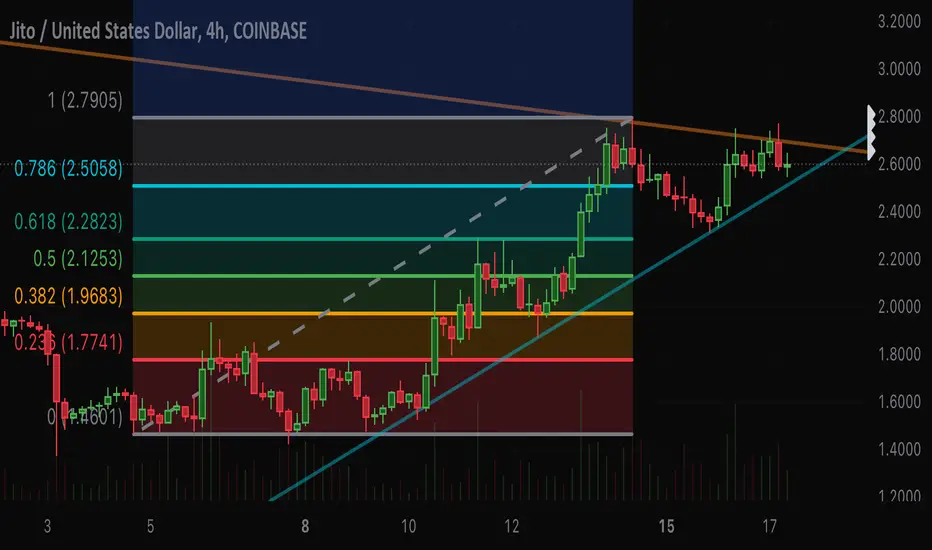
JTO is consolidating into an upward triangle formationThe Logarithmic Moving Average (LOGMA) is in a bullish momentum swing as the price approaches the upward green line the chart becomes increasing more bullish. Watch for signals to the upper price ceiling (green line), signals to the down triangle floors (orange & red lines).
JITO at the bottom of the rangeJTO has been holding strong at horizontal support for a few months. As this floor price is being established, the R:R is becoming an important part of a potential long-term setup. Invalidations are clear, and the ability to plan for a liquidation hunt is also clear. If you are bullish on the SOL narrative, this is not a bad time to consider obtaining some exposure.
JTO price analysis
Jito is showing strong potential for a breakout, following growth patterns similar to crypto 20X surge between 2018 and 2021. Bulls remain optimistic, anticipating a strong rally ahead, driven by Jito's solid development as a project.
Here are some key market structures and early signals of an upcoming uptrend:
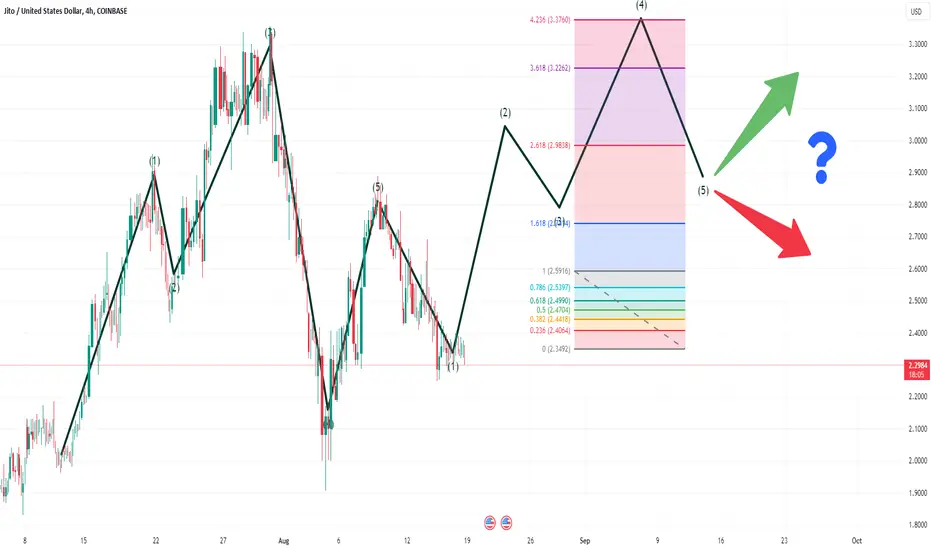
JTO has recently broken out of its downtrend and successfully retested its support at $2.20, indicating a potential for significant upward momentum. The initial target is the $3.20 resistance level, and if surpassed, the next target could be $3.80, assuming favorable market conditions. However, if sentiment turns bearish after hitting $3.2, JTO may decline toward the $2.50 level.
I hope you find this information helpful.
#JTO #JTOUSD #JTOUSDT #Analysis #Eddy #JTO #JTOUSD #JTOUSDT #Analysis #Eddy
(("All the relevant areas and explanations on the chart are clear and clear, the trading setups need to get confirmation to enter, if you don't know how to get a trigger and confirm entering into transactions, this analysis is not suitable for you, the above analysis is for professionals. and if you are a beginner, my suggestion is that you don't destroy your capital and first learn technical analysis and basic trading along with psychology and risk and capital management from reputable sources and courses, and then enter the financial markets."))
(("The above analysis and setups and points and areas are combined with most of the combined styles such as price action, supply and demand, RTM, ICT and also with the analysis of important indicators such as Dominance Tether and Bitcoin.
If you are familiar with the mentioned styles and know how to get approval to enter the above styles, use the above analysis.
This is not an investment proposal and only my opinion, please act based on your experience and decisions."))
~~~~~~~~~~~~~~~~~~~~~~~~~~~~~~~~~~~~~~~~~~
I also suggest you to view my #Analysis of #Bitcoin from the link below :
$JTO updateCRYPTOCAP:JTO following the plan as indicated before. Price moment failed to break the HTF trend line and completely retraced most of the indicated fib zones, settling on support at the last indicated zone (red-0.236), allowing excellent short opportunities. HTF trend shows bounces off the .236 level. HTF trend line is still the target to break before starting a new trend. Watching current support of the .236 level, along with the HTF trend line. (For freudie1/fraudie1/brokeboy1 since he doesn’t know what a trend line is. The O-R-A-N-G-E line. Thanks for the liquidity. Keep doing what you’re doing. Someone has to lose in this game. Unfortunately, it’s you.)
$JTO The only trend line you need. The only T/A trend line that matters on this chart. Break the daily resistance, settle above the trend line, and start your engines. Chart is looking primed for a major upthrust happening sooner than later.
Many L1’s/L1 tokens on the move. I’m seeing a rotation of funds from L1’s like NYSE:SUI and $SEI. Incremental drops in their prices are simultaneously propping up $JTO. I like the LTF price movements in Jito. Straight forward peaks and valleys accumulating into a breakout zone. A rapid price increase in CRYPTOCAP:ETH could catalyze a big breakout for $JTO. Exciting things to come.