JTO: local squeeze with $0.88 destinationThe Macro Picture 🗺️
JTO recovered hard off the $0.2533 April floor all the way to $0.88, then cooled off and pulled back to $0.6336. Price is balancing in the middle of a broad range, digesting the run rather than reversing it.
The Setup ⚙️
The Range Floor 🟢
$0.2533 (Macro Support) is the demand base the entire advance was built on. The higher-low structure since keeps the broader trend constructive.
The Decision Point 🔴
$0.6959 (Local High) is the gate. A daily close back above it re-arms the uptrend and opens the path to the $0.8816 measured-move target.
The Roadmap 🛣️
Hold equilibrium at $0.6336 → reclaim $0.6959 → run toward $0.8816. Invalidation is losing the $0.6336 equilibrium and the recovery structure, which opens the $0.3856 downside.
This is a GRID Range Play: a defined band to rotate, buying the lower half and scaling out into strength.
More setups in profile.
#JTO #Jito #crypto #trading #TA #3Commas #GRID
In-depth trading ideas
JTO USDT SHORT SIGNAL#118. JTO/USDT – Trade Setup (SHORT)
📈 Position Type: SHORT
🕒 Timeframe: 1H
📊 Market: Futures
💰 Entry Zone:
0.5919
0.6050
🛑 Stop-Loss:
0.62
🎯 Take-Profit Targets:
• TP1: 0.5777
• TP2: 0.5539
• TP3: 0.53
• TP4:
⚙️ Leverage:
5 *10
▫️ After TP1, move SL to Entry + 0.2%.
▪️ Exit Plan:
• 50% at TP1
• 25% at TP2
• 25% at TP3
📌 Risk Management:
Risk only 1–2% of your capital per trade.
⚠️ Always check and confirm the setup on your chart before entering the trade.
JTO has completed a bullish pattern (4H)JTO has entered a bullish cycle from the point where we placed the green arrow on the chart. This cycle has formed as a Diametric pattern, and its final wave, wave G, has also been completed.
We expect JTO to enter a bearish wave or pattern of the same degree as the previous pattern. If a pullback occurs into the red zone, it will present a sell/short opportunity.
A daily candle close above the invalidation level will invalidate this analysis.
If you have a coin or altcoin you want analyzed, first hit the like button and then comment its name so I can review it for you.
What do you think? Is JTO bearish?
JTO / USDT Below Key Level — Bearish Setup in FocusJTO / USDT is trading below our key level, increasing the probability of a bearish move toward the $0.5730 target. Price may face rejection from both the resistance zone and the key level, so keep a close watch on the price action. Wait for proper confirmation before entering any position, manage your risk wisely, and always do your own research before taking a trade. 📊
JTO LONG — 4H ALMA Setup (WR 81%)█ SETUP
BYBIT:JTOUSDT.P · 4H · long only.
(Context: Jito — Solana liquid staking / MEV infra beta; trades with SOL liquidity and alt risk appetite.)
ALMA Averaging Strategy: ALMA 3 / σ2, SD band 2, min diff 6 bars to add / 1 bar to exit, 25% per bar, up to 4 adds, hard stop −10% from average entry.
Strategy Tester (JTO 4H):
Win rate 81% · profit factor 2.0 · max drawdown 43%
Avg winning trade +9.9% · avg losing trade −8.7%
Typical hold ~21×4H bars on winners — Solana-infra mean-reversion grid · 97-trade sample
█ WHY NOW
Friday 4-hour cluster — two ALMA long lots on the same 81% WR template:
· 17 Jul 12:00 UTC ~ $0.5577
· 17 Jul 16:00 UTC ~ $0.5500 (second add · pyramid 2 of 4)
Working blend ~ $0.5539 . Bar-close scale-in into the BTC risk-off wash — not a discretionary Jito roadmap trade.
Hard stop zone −10% from blended average ~ $0.4985 . Exits follow Pine ALMA flip + min diff or the hard stop.
═
█ MACRO
Sector: JTO = Jito Network — Solana liquid staking (JitoSOL) · Block Engine / MEV · BAM · JTX self-custody spot terminal; beta to SOL activity and validator yield.
Fundamental (30d → 18 Jul): Structural Bid — JIP-38 passed (13 Jul): token-centric network · 100% DAO share of JTX fees → programmatic JTO buyback & burn through Q4 2027 via Rev Splitter; JTX live for first 1,000 waitlist users (14 Jul) after late-Jun early access. On-chain footprint: >95% active Solana stake on Jito client · ~$79M MEV fees (late-Jun ref.). Near-term drag: July linear unlock ~18.59M JTO (~3.8% circulating · ~$14M notional) arriving before JTX fee scale; post-launch derating ~$0.96 peak (07 Jul) → ~$0.54–0.56 into fills.
Tape (17 Jul): Bitcoin under ~$62.5K on Iran / US-equities pressure — SOL-ecosystem beta soft with BTC; governance/fee-switch headlines already printed mid-week, fill bars are risk-off mean-reversion.
Window read: mixed — JIP-38 + JTX value-accrual +, July unlock + sell-the-news + macro beta −.
Execution is 4H ALMA at the ~$0.55–0.56 cluster — not a JTX revenue or unlock forecast.
═
█ OUTLOOK
Positive factors
- 81% WR · PF 2.0 · avg win +9.9% vs avg loss −8.7% · ~21×4H bars — high hit-rate grid in a 97-trade sample (payoff skew modest; edge is win frequency)
- Fresh twin adds inside the 24h window on the same Averaging template · pyramid 2 of 4 still has room if the script qualifies further bars
- Fundamental — fee-switch: JIP-38 routes DAO JTX revenue into open-market buyback/burn ≥1 year — long-cycle value accrual under the post-launch wash
- Fundamental — infra footprint: >95% Solana stake on Jito client · MEV fee base still frames the network as core Solana market plumbing, not a pure meme LST
- Working blend ~$0.5539 sits under the first-lot print — second add improved average into the dip after the ~$0.96 → ~$0.55 giveback
Negative factors
- Fundamental — supply before revenue: ~18.6M JTO July vesting (~3.8% circ.) lands while JTX is still a 1k-user rollout — burn math lags unlock flow near-term
- Post-launch derating: ~40% off the window high into ~$0.55 — sell-the-news structure still dominates short-term tape
- Max drawdown ~43% on the tester path — path risk is real even with an 81% hit rate; size for adverse 4H gaps
- Avg win only slightly larger than avg loss — this is not a fat right-tail template; one extended loser can offset several small wins
- Solana-infra beta can gap with BTC / SOL headline risk on 4H perps — stop slippage possible through the −10% zone
- Past backtest ≠ live fills; geo tape can invalidate a clean mean-reversion path before the typical ~21-bar hold completes
Takeaway: the 4H ALMA strategy and 81% WR support the long into the Friday twin-add cluster, and JIP-38 / JTX keep a constructive value-accrual floor — but July unlock timing, post-launch derating from ~$0.96, and a ~43% tester drawdown path frame a disciplined grid into a mixed fund window, not a high-convexity bounce; nominal risk stays on the −10% hard stop / Pine exit path.
Base case: 4H ALMA holds · blend ~$0.55 holds as a base · grind higher if SOL/alt beta stabilises with BTC and first JTX fee → burn prints become visible.
Bear case: fail 4H ALMA · unlock / SOL beta extends · −10% from ~$0.5539 blend toward ~$0.4985 · perp gap through the hard-stop zone.
Chart: BYBIT:JTOUSDT.P 4H — ALMA Averaging Strategy.
Educational idea. Live position — past backtest ≠ future results. NFA.
JTO LONGMarket Outlook: JTO — Long Setup
Hello, everyone! Today, let's look at the JTO asset.
From a technical perspective, the outlook is as follows:
Global Structure: Following a daily liquidity sweep, we are seeing the formation of a consolidation range. We have broken the market structure to the upside, which presents an interesting setup.
Context & Reaction: We are currently facing a bearish FVG that has been tested twice, confirming its significance. However, bullish pressure remains strong; we have received a clear reaction on the 4-hour timeframe and are currently forming an order block.
Trading Plan: Upon a successful retest of this block, I expect a markup in price toward the targets outlined in my video. The final objective is a full rebalance of the range at the top of the structure.
I am currently maintaining a bullish (long) bias for this asset.
Disclaimer: This analysis is for educational purposes only and does not constitute financial advice.
#JTOUSDT Forming Bullish Wave#JTO
The price is moving within a descending channel on the 1-hour timeframe and has reached the lower boundary. It is now poised for a bounce and is expected to retest this boundary.
The Relative Strength Index (RSI) indicates a downward trend, which is likely to continue given the overbought conditions.
There is a key support zone in green at 0.5555. The price has bounced off this zone several times, making it a strong support level.
The price is trending towards the 100-period moving average, which we are approaching. This trend supports an upward move.
Entry Price: 0.6240
Target 1: 0.6387
Target 2: 0.6600
Target 3: 0.6900
Stop Loss: At the resistance zone in green
Remember this simple rule: Money management.
Any questions? Please leave a comment.
Thank you.
#JTOUSDT Forming Bullish Wave#JTO
The price is moving within a descending channel on the 1-hour timeframe and has reached the lower boundary. It is now poised for a bounce and is expected to retest this boundary.
The Relative Strength Index (RSI) indicates a downward trend, which is likely to continue given the overbought conditions.
A key support zone (in green) has been identified at 0.5611. The price has bounced off this zone several times, making it a strong support level.
The price is trending towards the 100-period moving average, which we are approaching. This trend supports an upward move.
Entry Price: 0.6311
First Target: 0.6474
Second Target: 0.6681
Third Target: 0.6945
You can close at the second target or wait for the third target. The choice is yours.
Stop Loss: At the resistance zone (in green).
Remember this simple rule: Money Management.
Any questions? Please leave a comment.
Thank you.
JTO USDT LONG SIGNAL#91. JTO/USDT – Trade Setup (LONG)
📈 Position Type: LONG
🕒 Timeframe: 1 H
📊 Market: Futures
💰 Entry Zone:
Market
0.5975
🛑 Stop-Loss:
0.5794
🎯 Take-Profit Targets:
• TP1: 0.6235
• TP2: 0.6403
• TP3: 0.6581
• TP4: 0.6817
TP5: 0.6990
TP6:
⚙️ Leverage:
5- 10
⚠️ After reaching TP1, move Stop-Loss to Entry Price.
📌 Risk Management:
Risk only 1–2% of your capital per trade.
Always confirm the setup on your chart before entry
JTOUSDT Forming Bullish MomentumJTOUSDT is forming a clear bullish momentum pattern, a classic bullish wave signal that often indicates an upcoming breakout. The price has been consolidating within a narrowing range, suggesting that selling pressure is weakening while buyers are beginning to regain control. With consistent volume confirming accumulation at lower levels, the setup hints at a potential bullish breakout soon. The projected move could lead to an impressive gain of around 20% to 30% once the price breaks above the wedge resistance.
This bullish momentum pattern is typically seen at the end of downtrends or corrective phases, and it represents a potential shift in market sentiment from bearish to bullish. Traders closely watching JTOUSDT are noting the strengthening momentum as it nears a breakout zone. Good trading volume adds confidence to this pattern, showing that market participants are positioning early in anticipation of a sustained upward move.
Investors' growing interest in JTOUSDT reflects rising confidence in the project's long-term fundamentals and current technical strength. If the breakout confirms with sustained buying volume, this could mark the start of a fresh bullish leg. The ongoing consolidation phase suggests that buyers are steadily accumulating positions while bearish pressure continues to fade, creating favorable conditions for additional upside.
Traders might find this a valuable setup for medium-term gains, especially as the bullish momentum pattern nears completion and buying momentum continues to accelerate. A confirmed breakout above resistance could attract more market participants and potentially push the price toward its projected upside target over the coming weeks.
✅ Show your support by hitting the like button!
✅ Leave a comment below! (What is your opinion about this coin?)
Your feedback and engagement keep me inspired to share more insightful market analysis with you!
#JTO/USDT Forming Bullish Wave#JTO
The price is moving within a descending channel on the 1-hour timeframe and has reached the lower boundary. It is now poised for a bounce and is expected to retest this boundary.
The Relative Strength Index (RSI) indicates a downward trend, which is likely to continue given the overbought conditions.
There is a key support zone (in green) at 0.6437. The price has bounced off this zone several times, making it a strong support level.
The price is trending towards the 100-period moving average, which we are approaching. This trend supports an upward move.
Entry Price: 0.7300
Target 1: 0.7500
Target 2: 0.7846
Target 3: 0.8280
Stop Loss: At the resistance zone (in green)
Remember this simple rule: Money management.
Any questions? Please leave a comment.
Thank you.
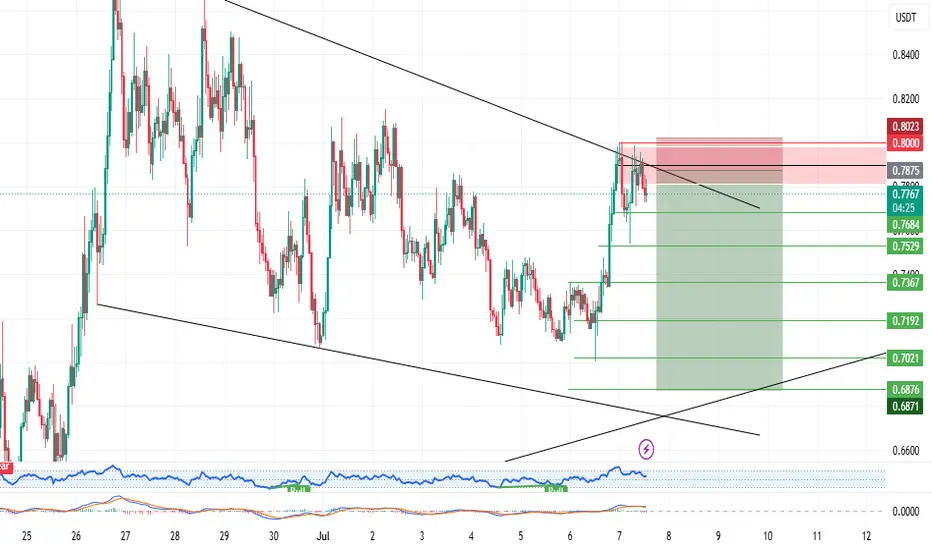
JTO USDT SHORT SIGNAL#29. JTO/USDT – Trade Setup (SHORT)
📈 Position Type: SHORT
🕒 Timeframe: 1 H
📊 Market: Futures
💰 Entry Zone:
0.7875
🛑 Stop-Loss:
0.8027
🎯 Take-Profit Targets:
• TP1: 0.7684
• TP2: 0.7528
• TP3: 0.7367
• TP4: 0.7191
TP5: 0.7020
TP6: 0.6873
⚙️ Leverage:
5- 10
⚠️ After reaching TP1, move Stop-Loss to Entry Price.
📌 Risk Management:
Risk only 1–2% of your capital per trade.
Always confirm the setup on your chart before entry
JTOUSDT – Descending Trendline: Breakout or Rejection?📊 Technical Analysis
🪙 Coin: CRYPTOCAP:JTO #JTO
⏳ Time Frame: 3D
📉 Pattern: Descending Trendline (Major Dynamic Resistance)
🎯 Market Structure: Recovery Rally Toward Key Resistance
🚀 Potential Upside: 40–100%+ (If the Breakout is Confirmed)
---
📌🔍 Pattern Overview
📉 JTO/USDT is still trading below a major Descending Trendline, which has acted as the primary dynamic resistance since the market peaked.
🛑 This trendline has rejected multiple bullish attempts, making it one of the most important technical levels to monitor.
📈 After forming a solid Higher Low from the bottom area, the price has staged a strong recovery and is now testing the descending resistance once again.
⚖️ This area represents a critical Decision Zone, which is likely to determine the next major direction of the trend.
💡 From a technical perspective, the more times a resistance level is tested, the greater the probability of a successful breakout. However, confirmation is still essential because as long as the price remains below the Descending Trendline, the medium-term bearish structure remains intact.
---
🟢🚀 Bullish Scenario (Breakout Confirmation)
✅ If JTO successfully breaks above the Descending Trendline and achieves a strong candle close above it, supported by increasing trading volume, the bearish structure could shift into a bullish trend reversal.
🎯 The next upside targets are:
🥇 Target 1: 1.1311 USDT
🥈 Target 2: 1.5646 USDT
🥉 Target 3: 2.0457 USDT
📈 If buying momentum continues to strengthen and volume expands, JTO could potentially rally toward all of the resistance levels above.
🔥 A confirmed breakout may also attract new buyers and further accelerate bullish momentum.
---
🔴⚠️ Bearish Scenario (Trendline Rejection)
❌ If the price fails to break above the Descending Trendline and experiences a strong rejection, the trendline will once again be confirmed as a significant selling zone.
In this scenario, the price could:
🔻 Pull back toward the nearest support level.
🔻 Continue moving sideways or consolidate below the trendline.
🔻 Form another Lower High, increasing the probability of a continuation of the broader downtrend if selling pressure intensifies.
⚠️ Until a confirmed breakout occurs, traders should remain cautious of a potential Fake Breakout (Bull Trap).
---
📌📝 Conclusion
📍 The Descending Trendline is currently the most critical technical level for JTO.
🟢 Bullish Confirmation ➡️ A breakout followed by a strong close above the trendline could open the door toward:
🎯 1.1311 USDT ➡️ 1.5646 USDT ➡️ 2.0457 USDT
🔴 Bearish Confirmation ➡️ A rejection from the trendline could trigger another correction and keep the bearish market structure intact.
⚖️ The market is currently sitting in a Decision Zone, making price confirmation the key factor before considering any trading position.
---
⚠️ Disclaimer
📚 This analysis is based solely on Technical Analysis and is intended for educational and informational purposes only.
💼 This is not Financial Advice.
🛡️ Always practice proper risk management, wait for confirmation before entering a trade, and conduct your own research (DYOR) before making any investment decisions.
---
#JTO #JTOUSDT #Crypto 🚀 #Cryptocurrency 💰 #Altcoins #TechnicalAnalysis 📊 #TradingView #PriceAction #DescendingTrendline #Breakout #Resistance #Support #Bullish 🟢 #Bearish 🔴 #SwingTrading #CryptoTrading #Binance #MarketAnalysis #Trendline #ChartAnalysis
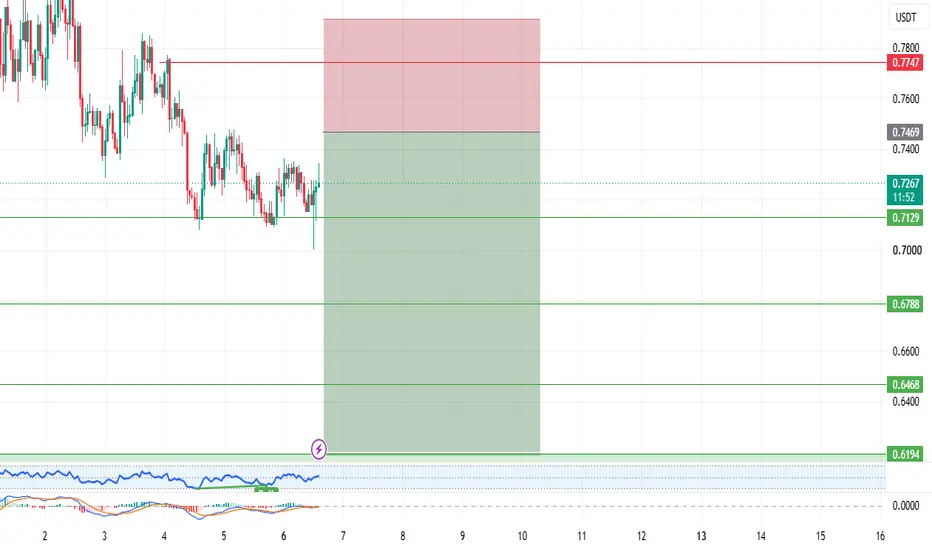
JTO USDT SHORT SIGNALJTO/USDT – Trade Setup (SHORT)
📈 Position Type: SHORT
🕒 Timeframe: 1 H
📊 Market: Futures
💰 Entry Zone:
0.7465
0.7747
🛑 Stop-Loss:
0.7920
🎯 Take-Profit Targets:
• TP1: 0.7129
• TP2: 0.6788
• TP3: 0.6458
• TP4: 0.6202
TP5:
TP6:
⚙️ Leverage:
5- 3
⚠️ After reaching TP1, move Stop-Loss to Entry Price.
📌 Risk Management:
Risk only 1–2% of your capital per trade.
Always confirm the setup on your chart before entry
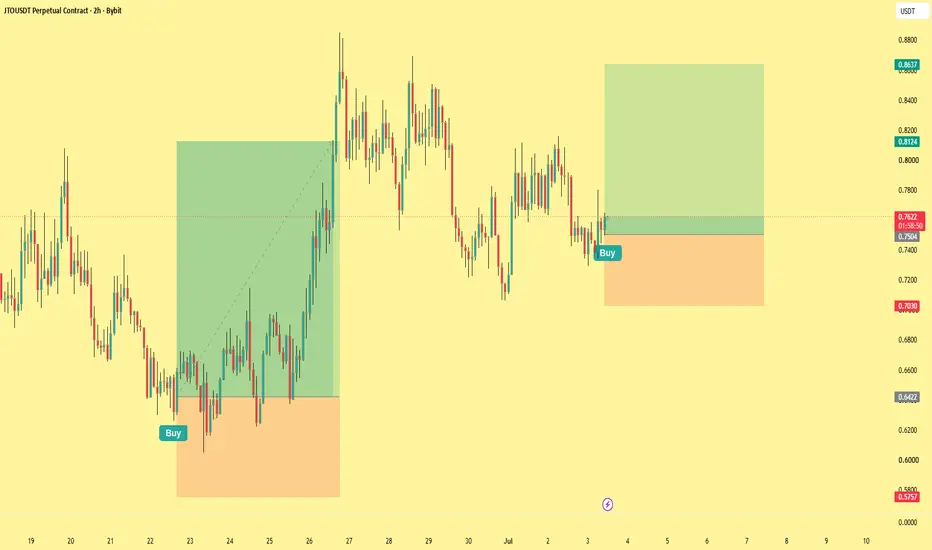
JTOUSDT — Long at Demand Rejection [Quantum Algo]JTO rallied off the 0.642 demand all the way to 0.88, then pulled back into a wide balance between 0.72 and 0.82. Price has now retraced into a higher demand shelf near 0.7500 and reacted, firing the Buy. This is a continuation long: the larger structure is a series of higher lows off the base, and the play is to buy the pullback into demand and ride the next leg back toward the range highs.
Why this setup works — three confluences:
Demand rejection at a higher low. Price pulled back into the demand zone and held instead of breaking down. This is where buyers step back in — the reaction printed on the tap, giving a defined floor to lean risk against rather than chasing mid-range.
Higher-low structure intact. The pullback is holding above the prior swing, keeping the bullish sequence alive off the 0.642 base. Buying here sits with the dominant direction of the last two weeks rather than fighting a fresh trend.
Clean room back to the range highs. Above entry there's an air pocket up to the 0.81 shelf, then the 0.86 zone sitting as the logical draw. Defined risk below demand, asymmetric room up to structure.
Trade management:
Entry: 0.7500 (rejection off demand)
SL: 0.7250 (below the zone)
TP1: 0.8120 — take 50% off, move stop to breakeven
TP2: 0.8600 — 100% exit at the range highs
R:R: ~4.4:1 to full target
Invalidation:
A 2h close back below 0.7250. That breaks the demand shelf and the higher-low structure — sellers in control, continuation thesis dead, just out.
The lesson:
Buying pullbacks beats chasing breakouts. When a market makes a strong impulsive leg and then retraces into demand, the disciplined entry is at the level — not at the top of the move where you're paying up and stopping into every wick. Let price come back to a zone that matters, wait for the hold, and set your risk below structure so a failed pullback costs one clean R.
Signal fired. We took it. Update coming.
Disclaimer: Not financial advice. This idea is shared for educational purposes only. Trading leveraged instruments carries substantial risk. Past performance is not indicative of future results. Always do your own research and manage your own risk.
#JTO/USDT Forming Bullish Wave#JTO
The price is moving within a descending channel on the 1-hour timeframe and has reached the lower boundary. It is now poised for a bounce and is expected to retest this boundary.
The Relative Strength Index (RSI) indicates a downward trend, which is likely to continue given the overbought conditions.
There is a key support zone in green at 0.5520. The price has bounced off this zone several times, making it a strong support level.
The price is trending towards the 100-period moving average, which we are approaching. This trend supports an upward move.
Entry Price: 0.6640
Target 1: 0.7077
Target 2: 0.7514
Target 3: 0.8050
Stop Loss: At the resistance zone in green
Remember this simple rule: Money management.
Any questions? Please leave a comment.
Thank you.
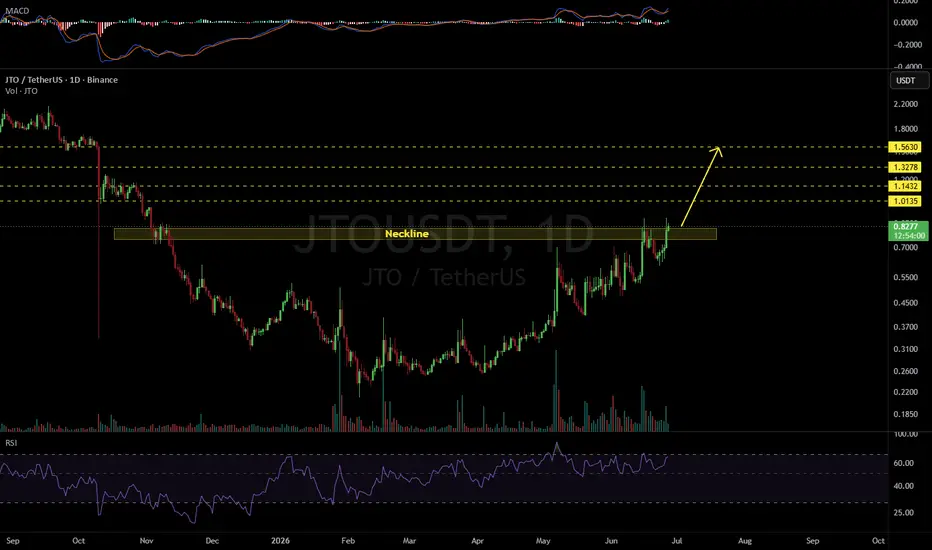
JTO Approaching Key Resistance — Breakout Setup BuildingJTO remains in a strong uptrend and is now testing an important resistance zone.
If price reclaims this level and holds it as support, JTO could move toward new range highs. Waiting for confirmation is better than chasing early.
Trading Levels:
Entry: $0.79 – $0.80
TP1: $1.00
TP2: $1.25
Stop Loss: $0.75
JTOUSD Looking Interesting Here...JTOUSD Looking Interesting Here...
After days of lower highs and constant selling pressure, CRYPTOCAP:JTO is finally pushing into the descending trendline that has been holding price down since the recent peak. The key area I'm watching is 0.64 - 0.66. Buyers defended this zone multiple times, and the latest reaction suggests demand is still present.
A clean breakout and reclaim above the trendline could open the door toward:
0.6847
0.7314
0.7977
For now, patience is important. I don't want to chase candles. The ideal scenario is a confirmed breakout followed by a healthy retest before continuation. As long as the 0.60 - 0.64 demand zone remains protected, bulls still have a chance to take control.
#JTO #JTOUSDT #Crypto #Altcoins #Trading #Bybit #BinanceFutures #Leo524
JTO isn’t bullish - It’s holding supportJTOUSDT 4H Analysis
Downtrend
Contracting volatility
Support under pressure
JTO has shifted into a clear downtrend over the analyzed period. Price peaked near the 0.74 region around June 20 and has steadily eroded since, currently sitting at 0.63338. The structure of the moving averages confirms this character: the short-term SMA28 at 0.6874 has rolled over and is declining sharply, while the medium SMA58 at 0.6919 sits just above it. Both remain above price, acting as overhead resistance. The longer SMA128 at 0.6262 is flat and now sits just below current price, marking a key pivot zone the market is testing.
Current Structure
Price is wedged between the rising-then-flattening SMA128 support around 0.6262 and the descending short and medium averages overhead near 0.6874 to 0.6919. The recent recovery attempt to 0.665 on June 22 failed and was rejected, producing a fresh leg lower into the 0.617 to 0.633 area. The current candle shows a modest bounce off the 0.6169 low, closing at 0.63338, suggesting buyers are defending the long-term average. This makes the 0.6262 SMA128 level the immediate battleground.
Momentum and Volatility
RSI14 sits at 40.99, recovering slightly from a recent low of 36.6 but remaining firmly in the lower half of the range, consistent with bearish momentum that has not yet reached oversold extremes. The RSI has been oscillating in the high 30s to mid 40s, reflecting persistent weakness without capitulation. ATR14 has compressed from 0.0413 down to 0.0355 over the last fourteen bars, indicating volatility is contracting as the move matures. This declining volatility alongside a downtrend can precede either a stabilization or a sharper resolution once range expansion returns.
Scenarios
In the bullish case, price holds the SMA128 support near 0.6262 and builds a base, with a recovery targeting the 0.6874 to 0.6919 cluster of moving averages. Reclaiming that zone would neutralize the bearish structure and open room toward the 0.71 region. A move back above 0.665 first would be the early confirmation signal.
In the bearish case, a decisive break and close below 0.6262 invalidates the long-term support and exposes the lower 0.60 area and beyond. The failed bounce from June 22 and the lower highs argue this remains the path of least resistance unless buyers reclaim the descending averages.
The neutral case sees continued chop between roughly 0.617 and 0.665 as volatility compresses further, with the market awaiting a catalyst to break the range.
Invalidation and Risk
The bullish thesis is invalidated on a sustained close below 0.6262, particularly with rising volume. The bearish thesis weakens on a reclaim of 0.6874 with momentum confirmation. Traders should note that the SMA128 has flattened, removing the prior longer-term tailwind, so the support there is less robust than during the earlier uptrend. The compressed ATR also raises the risk of a sudden expansion move that can run further than expected in either direction.
Confidence
Moderate. The trend and moving average structure clearly favor the bearish to neutral bias, but the proximity to long-term support, the slight RSI recovery, and the contracting volatility introduce meaningful two-way risk. The 0.6262 level is the decisive reference for the next directional resolution.
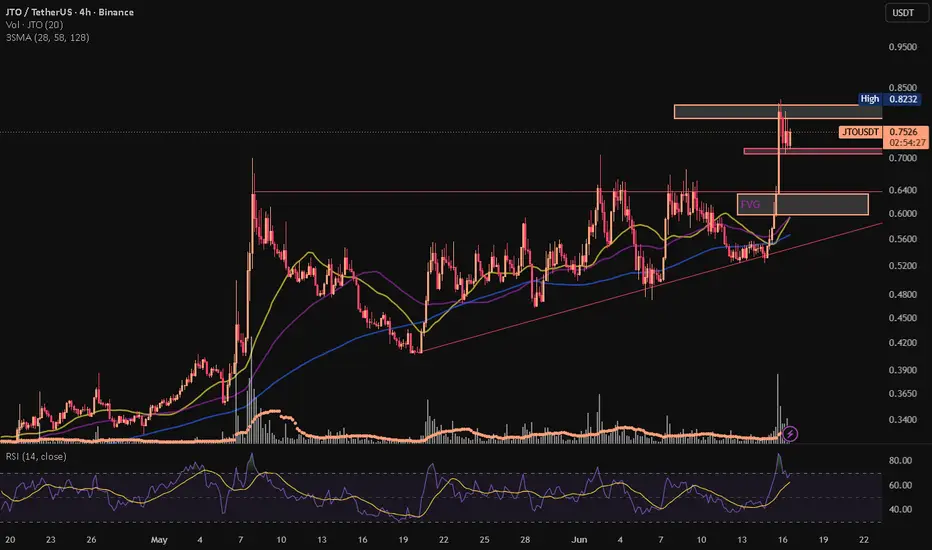
JTO 4H Analysis | Breakout Confirmed, Momentum CoolingJTOUSDC / 4h
-- STRUCTURE --
Trend: BULLISH / strong
Pattern: LH_LL
BOS: BULLISH @ 0.55995
Decisive bullish break of structure above prior consolidation highs (~0.56) on 2026-06-15, confirmed by massive volume expansion (9.7M on breakout candle).
CHoCH: BEARISH @ 0.74526
Short-term character shift after the top: sequence of lower highs (0.810 -> 0.784 -> 0.781) signals near-term corrective phase within the larger uptrend.
Primary Strong impulsive uptrend following a prolonged consolidation base around 0.54-0.55, with explosive breakout candle on 2026-06-15T12:00 (range 0.633-0.810).
and Behavior Post-breakout consolidation/pullback; price retraced from 0.8098 high and is now ranging between ~0.715 and ~0.78 attempting to digest gains.
The macro structure flipped decisively bullish via a high-volume BOS that lifted price ~45% off the base. However, immediately after the impulse, micro structure shows lower highs and lower lows, indicating a normal corrective/distribution phase rather than trend reversal. The larger trend remains intact while short-term momentum cools.
-- MOVING AVERAGES --
Stack: BULLISH
-- MOMENTUM --
ATR nearly doubled from ~0.022 to ~0.045, signaling a major volatility expansion coinciding with the breakout. Volatility remains elevated and is just beginning to plateau.
Volatility: high / expansion
-- LIQUIDITY --
Support: 0.70782 | 0.71882 | 0.6938
Resistance: 0.78053 | 0.8098 | 0.82025
Sweep: BULLISH 0.8098
The 0.810 wick high on the breakout candle followed by rejection (close 0.795) and subsequent lower highs suggests a liquidity grab above prior resistance, sweeping buy-side stops before the pullback.
FVG: 0.59851 - 0.63403 (BULLISH)
Large bullish fair value gap left by the impulsive 06-15 candles; a deep retracement toward 0.60-0.63 would represent a high-probability demand zone if tested.
-- BULL SCENARIO --
IF Reclaim and 4h close above 0.7806 (last lower high)
Confirm could be Follow-through close above 0.8025 establishing a new higher high and continuation of trend
Invalidate: 4h close below 0.7078 breaking the recent swing low structure
-- BEAR SCENARIO --
IF 4h close below 0.7078 swing low
Confirm could be Break and acceptance below 0.6938 with momentum opening path to the 0.60-0.63 imbalance fill
Invalidate: 4h close back above 0.7806
-- NEUTRAL ZONE --
Range: 0.7078 - 0.7806
Conditions: Price continues to oscillate between recent swing low and lower-high resistance while volatility normalizes
-- RISK --
Rating: HIGH
ATR Stop: 0 pts
Context: Elevated ATR (0.0446) implies wide stops; recommended ~2x ATR distance of ~0.089. Whipsaw risk is high in this post-breakout consolidation.
-- SUMMARY --
Explosive volume-driven breakout from a long base, now in a high-volatility post-impulse consolidation.
Bullish primary trend with all MAs stacked positively and price ~27% above the SMA cluster, but short-term structure showing lower highs/lows and cooling RSI from overbought.
Confirms change, Bullish continuation confirmed by reclaiming 0.7806/0.8025; bearish correction confirmed by losing 0.7078, opening the 0.60-0.63 imbalance and SMA confluence near 0.594.
This is a textbook impulse-then-consolidation. The risk/reward asymmetry favors waiting: chasing here is dangerous given overbought-recovery RSI and a possible liquidity sweep at 0.810. Highest-probability long re-entry is either a confirmed reclaim of 0.78 or a controlled retracement into the 0.60-0.63 FVG defended by the SMA stack. Maintain wide ATR-based stops due to elevated volatility.
JTO
---
## 🧭 Multi-Scenario Playbook: CRYPTOCAP:JTO / USDT (5H Chart)
We are looking at a crucial inflection point for ** CRYPTOCAP:JTO **. Price is currently consolidating inside a descending flag pattern right on top of major support, setting up two distinct, high-probability paths depending on how the market reacts.
### 🔍 Technical Setup:
* **The Structure:** Price is squeezing inside a clear descending channel/flag right at the **0.65 Fibonacci Golden Pocket** ($0.546).
* **The Confluence:** This current zone aligns perfectly with a major Fair Value Gap (FVG) and a significant high-volume node on the Volume Profile (visible on the right).
---
### 🗺️ The Two Scenarios to Play:
#### 🔵 Path A: The Aggressive Long (Immediate Breakout)
* **The Thesis:** The Golden Pocket holds ($0.544). Price prints a local double bottom, breaks out of the descending channel, and fills the upper FVG.
* **Target:** **$0.6170** (0.31 Fib level / local resistance) 🎯
#### 🔴 Path B: The Deep Liquidity Sweep (Patience Pays)
* **The Thesis:** The current Golden Pocket support fails, triggering a flush to sweep liquidity down to the **1 Fib extension level** around **$0.4745**. This area aligns with the macro ascending trendline and structural demand.
* **The Play:** Look for sharp rejection/capitulation volume here to catch the macro reversal.
* **Target:** **$0.5534** (Previous support flipped to resistance) 🎯
---
⚖️ **Strategy:** Watch the 5H candle closes. If we reclaim the channel top, Path A triggers. If $0.518 breaks down, we patienty wait to bid the $0.470 macro trendline trap.
*Which path are you betting on for JTO? Immediate bounce or one last flush?* 👇
#CryptoTrading #JTO #Jito #SolanaEcosystem #TechnicalAnalysis #Fibonacci #OrderFlow
JTO Approaching a Major Decision ZoneJTO has recovered strongly from the April lows and is now compressing directly beneath the 0.65 - 0.70 resistance zone, which has rejected price multiple times in recent weeks.
The structure remains constructive with a clear series of higher lows and an ascending trendline supporting the move. At the same time, price is building pressure against horizontal resistance, creating a classic breakout setup.
A successful break and close above 0.65 - 0.70 could open the door for a fresh expansion leg, as there is relatively little resistance overhead compared to the consolidation that has already formed below.
However, bulls still need confirmation. Until resistance breaks, the market may continue ranging between support and resistance while building energy for the next move.
Key Levels
🟢 Support: 0.5939 → 0.4627
🔴 Resistance: 0.6500 → 0.7000
📈 Bias: Bullish while holding above rising trendline
⚠️ A breakout above 0.70 could trigger the next impulsive move higher.