Jito/USDT
No trades
No trades
In-depth trading ideas
JTO at a Critical Long-Term Resistance — Breakout or Rejection?📊 Technical Analysis — CRYPTOCAP:JTO
⏳ Time Frame: 6D
📌 Pattern: Descending TrendLine
💰 Current Price Area: around $0.62
🎯 Key Resistance: $0.75 → $1.10 → $1.55 → $2.25 → $3.35 → $4.05
---
🔻 PATTERN: DESCENDING TRENDLINE
📉 The JTO/USDT chart shows a Descending TrendLine formed by a series of lower highs since the major high around $4.05–$4.94.
🔻 The yellow trendline acts as dynamic resistance, repeatedly limiting upward price movement.
📍 As long as price remains below this trendline, the
JTOUSDT 1D FOR LONG TIMEJTOUSDT.P (1D) — Two-Leg Target Scenario
Entry: current zone ~0.44 (above EMA21 0.4576)
Stop: ~0.383 (support line below current base)
TP1: ~0.648 (+47% from entry) — top of the first upward leg; a good zone to take partial profit / move stop to breakeven.
TP2: ~1.31 (+198% from entry) — major resistance (prior high), final target after the pullback and second breakout leg.
R:R to TP2 is attractive given the tight stop, but expect a pullback (~0.47) after TP1 before the second leg plays out
JTO Key levels to watch
JTO is looking interesting here.
After fully filling the wick, price formed a base and printed a bullish MSS. Since then, JTO has been trading inside a descending channel.
For now, I’m watching:
Descending channel → Break & hold would be interesting
$0.338 → Key support
$1.30–$1.50 → Large Daily FVG
$1.557 → Major HTF reclaim level
I’m bullish on JTO, but first I want to see price break out of the current corrective structure.
Want a lower timeframe breakdown? Let me know.
MrC
JTOUSDT — Short Setup on a Retest of Lost SupportFor JTO, I’m not interested in shorting the current price after such a large move down.
The cleaner scenario for me is a pullback into 0.5256–0.5380.
This area previously acted as an important part of the local structure. Once price lost it, sellers gained control and we saw a strong continuation lower.
If JTO comes back into this area, the old support can now act as resistance.
The scenario is simple:
breakdown → pullback → retest from below → seller reaction
SHORT zone: 0.5256–0.5380
Inv
JTOUSDT 1D#JTO is breaking out above the daily SMA200 and trying to hold above it. It is also moving inside a bullish flag. The structure looks promising. In case of a breakout above the flag resistance, the potential upside targets are:
🎯 $0.5743
🎯 $0.6267
🎯 $0.6790
🎯 $0.7535
🎯 $0.8485
⚠️ Always remember to use a tight stop-loss and maintain proper risk management.
JTO/USDT H3: Bear pressure at KEY level🎯 TP1: $0.472400 (+2.42%) │ TP2: $0.445724 (+7.93%)
🛑 SL: $0.530781 (-9.64%) │ R/R: 1 : 0.82
⚠️ Stop is wider than TP2 target (R/R < 1) — the closer target is hit more often, but adjust position size according to stop loss
FUNDAMENTAL BACKGROUND
JTO shows weakness amid a lack of fresh project catalysts. The broader crypto market maintains a bullish sentiment but is seeing local profit-taking after recent gains. No major macro releases in the coming days leave price action driven by technical fa
JTO USDT LONG SIGNAL93. JTO/USDT – Trade Setup (LONG)
📈 Position Type: LONG
🕒 Timeframe: 1H
📊 Market: Futures
💰 Entry Zone:
0.5237
🛑 Stop-Loss:
0.5127
🎯 Take-Profit Targets:
• TP1: 0.5334
• TP2: 0.5498
• TP3: 0.57
• TP4. 0.5930
Tp5.
⚙️ Leverage:
5*10
▫️ After TP1, move SL to Entry + 0.2%.
▪️ Exit Plan:
• 40% at TP1
• 20% at TP2
• 20% at TP3
20% at TP4
📌 Risk Management:
Risk only 1–2% of your capital per trade.
⚠️ Always check and confirm the setup on your chart before entering the trad
JTO is still in a corrective structure (8H)The bullish phase of JTO started from where we placed the green arrow on the chart. From where we placed the red arrow, the bullish phase ended and the bearish phase began.
It appears that the bearish phase is forming a Diametric structure, with price currently in wave F.
We expect price to be rejected from the red supply zone and drop toward the green zone to complete wave G, followed by another recovery.
The red zone is an important trading area that has been lost.
Let’s see what happens.
JTOUSDT Forming Bullish MomentumJTOUSDT is forming a clear bullish momentum pattern, a classic bullish wave signal that often indicates an upcoming breakout. The price has been consolidating within a narrowing range, suggesting that selling pressure is weakening while buyers are beginning to regain control. With consistent volume confirming accumulation at lower levels, the setup hints at a potential bullish breakout soon. The projected move could lead to an impressive gain of around 60% to 70% once the price breaks above the
JTO USDT LONG SIGNAL#33. JTO/USDT – Trade Setup (LONG)
📈 Position Type: LONG
🕒 Timeframe: 1H
📊 Market: Futures
💰 Entry Zone:
0.4985
0.4879
🛑 Stop-Loss:
0.4796
🎯 Take-Profit Targets:
• TP1: 0.5178
• TP2: 0.5344
• TP3: 0.5525
• TP4. 0.5739
Tp5.
⚙️ Leverage:
5*10
▫️ After TP1, move SL to Entry + 0.2%.
▪️ Exit Plan:
• 40% at TP1
• 20% at TP2
• 20% at TP3
20% at TP4
📌 Risk Management:
Risk only 1–2% of your capital per trade.
⚠️ Always check and confirm the setup on your chart before entering the
JTO LONG — 4H ALMA Setup (WR 81% · avg RR 1.1)█ SETUP
BYBIT:JTOUSDT.P · 4H · long only.
(Context: Jito — Solana liquid staking / MEV infra beta; trades with SOL liquidity and alt risk appetite.)
ALMA Averaging Strategy: ALMA 3 / σ2, SD band 2, min diff 6/1, 25% per bar, up to 4 adds, hard stop −10% from average entry.
Strategy Tester (JTO 4H):
Win rate 81% · profit factor 2.0 · max drawdown 14%
Avg winning trade +9.9% · avg losing trade −8.7%
Typical hold ~21×4H bars on winners — Solana-infra mean-reversion grid on the 4H Averaging
JTO USDT SHORT SIGNAL#118. JTO/USDT – Trade Setup (SHORT)
📈 Position Type: SHORT
🕒 Timeframe: 1H
📊 Market: Futures
💰 Entry Zone:
0.5919
0.6050
🛑 Stop-Loss:
0.62
🎯 Take-Profit Targets:
• TP1: 0.5777
• TP2: 0.5539
• TP3: 0.53
• TP4:
⚙️ Leverage:
5 *10
▫️ After TP1, move SL to Entry + 0.2%.
▪️ Exit Plan:
• 50% at TP1
• 25% at TP2
• 25% at TP3
📌 Risk Management:
Risk only 1–2% of your capital per trade.
⚠️ Always check and confirm the setup on your chart before entering the trade.
JTO: local squeeze with $0.88 destinationThe Macro Picture 🗺️
JTO recovered hard off the $0.2533 April floor all the way to $0.88, then cooled off and pulled back to $0.6336. Price is balancing in the middle of a broad range, digesting the run rather than reversing it.
The Setup ⚙️
The Range Floor 🟢
$0.2533 (Macro Support) is the demand base the entire advance was built on. The higher-low structure since keeps the broader trend constructive.
The Decision Point 🔴
$0.6959 (Local High) is the gate. A daily close back above it re-arms
JTO LONG — 4H ALMA Setup (WR 81%)█ SETUP
BYBIT:JTOUSDT.P · 4H · long only.
(Context: Jito — Solana liquid staking / MEV infra beta; trades with SOL liquidity and alt risk appetite.)
ALMA Averaging Strategy: ALMA 3 / σ2, SD band 2, min diff 6 bars to add / 1 bar to exit, 25% per bar, up to 4 adds, hard stop −10% from average entry.
Strategy Tester (JTO 4H):
Win rate 81% · profit factor 2.0 · max drawdown 43%
Avg winning trade +9.9% · avg losing trade −8.7%
Typical hold ~21×4H bars on winners — Solana-infra mean-reversio
JTO has completed a bullish pattern (4H)JTO has entered a bullish cycle from the point where we placed the green arrow on the chart. This cycle has formed as a Diametric pattern, and its final wave, wave G, has also been completed.
We expect JTO to enter a bearish wave or pattern of the same degree as the previous pattern. If a pullback occurs into the red zone, it will present a sell/short opportunity.
A daily candle close above the invalidation level will invalidate this analysis.
If you have a coin or altcoin you want analyzed,
JTO / USDT Below Key Level — Bearish Setup in FocusJTO / USDT is trading below our key level, increasing the probability of a bearish move toward the $0.5730 target. Price may face rejection from both the resistance zone and the key level, so keep a close watch on the price action. Wait for proper confirmation before entering any position, manage your risk wisely, and always do your own research before taking a trade. 📊
JTO LONGMarket Outlook: JTO — Long Setup
Hello, everyone! Today, let's look at the JTO asset.
From a technical perspective, the outlook is as follows:
Global Structure: Following a daily liquidity sweep, we are seeing the formation of a consolidation range. We have broken the market structure to the upside, which presents an interesting setup.
Context & Reaction: We are currently facing a bearish FVG that has been tested twice, confirming its significance. However, bullish pressure remains strong; w
JTO USDT LONG SIGNAL#91. JTO/USDT – Trade Setup (LONG)
📈 Position Type: LONG
🕒 Timeframe: 1 H
📊 Market: Futures
💰 Entry Zone:
Market
0.5975
🛑 Stop-Loss:
0.5794
🎯 Take-Profit Targets:
• TP1: 0.6235
• TP2: 0.6403
• TP3: 0.6581
• TP4: 0.6817
TP5: 0.6990
TP6:
⚙️ Leverage:
5- 10
⚠️ After reaching TP1, move Stop-Loss to Entry Price.
📌 Risk Management:
Risk only 1–2% of your capital per trade.
Always confirm the setup on your chart before entry
JTOUSDT Forming Bullish MomentumJTOUSDT is forming a clear bullish momentum pattern, a classic bullish wave signal that often indicates an upcoming breakout. The price has been consolidating within a narrowing range, suggesting that selling pressure is weakening while buyers are beginning to regain control. With consistent volume confirming accumulation at lower levels, the setup hints at a potential bullish breakout soon. The projected move could lead to an impressive gain of around 20% to 30% once the price breaks above the
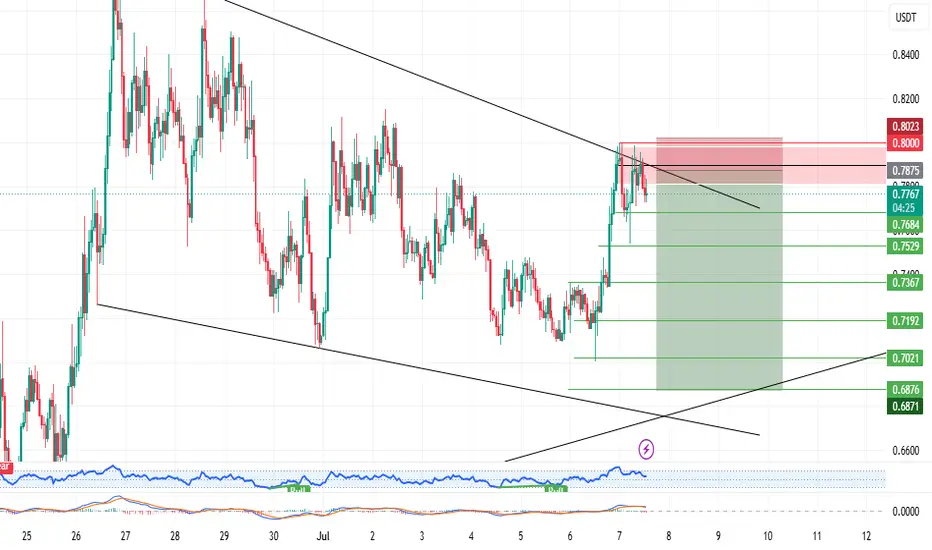
JTO USDT SHORT SIGNAL#29. JTO/USDT – Trade Setup (SHORT)
📈 Position Type: SHORT
🕒 Timeframe: 1 H
📊 Market: Futures
💰 Entry Zone:
0.7875
🛑 Stop-Loss:
0.8027
🎯 Take-Profit Targets:
• TP1: 0.7684
• TP2: 0.7528
• TP3: 0.7367
• TP4: 0.7191
TP5: 0.7020
TP6: 0.6873
⚙️ Leverage:
5- 10
⚠️ After reaching TP1, move Stop-Loss to Entry Price.
📌 Risk Management:
Risk only 1–2% of your capital per trade.
Always confirm the setup on your chart before entry