JUP USDT LONG SIGNAL#151. JUP/USDT โ Trade Setup (LONG)
๐ Position Type: LONG
๐ Timeframe: 1H
๐ Market: Futures
๐ฐ Entry Zone:
0.1916
๐ Stop-Loss:
0.1860
๐ฏ Take-Profit Targets:
โข TP1:ย 0.1970
โข TP2: 0.2054
โข TP3: 0.2135
โข TP4..0.2215
โ๏ธ Leverage:
5 *10
โซ๏ธ After TP1, move SL to Entry + 0.2%.
โช๏ธ Exit Plan:
โข 40% at TP1
โข 20% at TP2
โข 20% at TP3
ย 20%. at. TP4
๐ Risk Management:
Risk only 1โ2% of your capital per trade.
โ ๏ธ Always check and confirm the setup on your chart before entering the trade.
In-depth trading ideas
๏ปฟ$JUP IS ONE 4H CANDLE AWAY FROM A BIG MOVE !LSE:JUP IS ONE 4H CANDLE AWAY FROM A BIG MOVE ๐๐ฅ
LSE:JUP is sitting right below a major 4H resistance zone after printing a strong recovery from support. Buyers are showing strength, but this is not a confirmed breakout yet.
If we get a strong 4H candle close above this resistance, supported by high volume, it will confirm that buyers have taken control. The best confirmation would be a breakout followed by a successful retest of this zone as new support.
If that confirmation happens, I'm expecting the next upside targets around 0.216, followed by 0.242.
However, if price gets rejected from this resistance again or the breakout happens on weak volume, the bullish setup becomes invalid and another pullback is likely before the next attempt.
JUP: local squeeze with $0.2373 destinationThe Macro Picture ๐บ๏ธ
JUP unwound from the $0.2766 macro ceiling into a summer range and now sits at $0.1912, holding above the $0.1695 local low. Price is coiling just under its local high with the floor intact โ a base rebuilding, not a breakdown.
The Setup โ๏ธ
The Range Floor ๐ข
$0.1695 (Local Low) is the demand shelf, with $0.1418 (Macro Support) as the deeper backstop. Both have held, and that's the base this range pivots on.
The Decision Point ๐ด
$0.2002 (Local High) is the gate. A daily close above it flips the local structure bullish and opens the path to the $0.2373 measured-move target.
The Roadmap ๐ฃ๏ธ
Hold above $0.1695 โ break $0.2002 โ run toward $0.2373. Invalidation is a clean daily close below $0.1418 โ that breaks the range.
This is a GRID Range Play: a defined band to rotate, buying the lower half and scaling out into the breakout.
#JUP #Jupiter #crypto #trading #TA #3Commas #GRID
JUP/USDT (4h) Testing Descending Channel ResistanceJUP/USDT continues to trade inside a descending channel on the 4H chart. Price has rebounded from the lower part of the structure and is now testing the upper boundary.
A confirmed breakout above the channel could support a move toward the 0.2045 USDT resistance area. Rejection from the trendline would keep the bearish structure intact and could lead to another move toward channel support.
JUP USDT SHORT SIGNAL#114. JUP/USDT โ Trade Setup (SHORT)
๐ Position Type: SHORT
๐ Timeframe: 1H
๐ Market: Futures
๐ฐ Entry Zone:
0.1885
๐ Stop-Loss:
0.1948
๐ฏ Take-Profit Targets:
โข TP1:ย 0.1850
โข TP2: 0.1811
โข TP3: 0.1768
โข TP4:
โ๏ธ Leverage:
5 *10
โซ๏ธ After TP1, move SL to Entry + 0.2%.
โช๏ธ Exit Plan:
โข 50% at TP1
โข 25% at TP2
โข 25% at TP3
ย
๐ Risk Management:
Risk only 1โ2% of your capital per trade.
โ ๏ธ Always check and confirm the setup on your chart before entering the trade.
JUP/USDT - Sideways cage, weak volume, decision aheadKatsu on the Bridge. In the middle of deep space, our radars are currently scanning the JUP cruiser. On the JUP 4H chart, we are not seeing a clean trend right now. Instead, we are seeing a tiring, nerve-grinding sideways structure.
Price is currently trying to hold around 0.1920, while nearby bearish Order Blocks are sitting above it, and deeper bullish zones are waiting below it.
This is the type of situation where the market is not saying, come on, here is the perfect entry. It is more like the market is saying, pay attention, because a decision may be coming soon.
A larger downward structure is also visible on the chart. The upper red trendline is still putting pressure on price, while price can easily drift back toward the lower blue support zones if the current blue support fails.
The black path is, in my opinion, a very realistic scenario. It should not be understood candle by candle, but more as a directional idea. JUP may first try to bounce toward the nearby resistance zones, and if real strength does not appear there, it may turn back down again toward the deeper green OB zones.
What Do I See on the Chart?
The current price is around 0.1920. This is right near the 0.1905 blue zone, which is currently a nearby Order Block.
Above price, we have the bearish Order Blocks in red:
0.1985
0.2057
0.2165
higher at 0.2356
even higher at 0.2467
Below price, we have the bullish Order Blocks in green:
0.1711
0.1622
0.1569
deeper at 0.1421
For me, the current situation is mostly neutral, with a slightly bearish tone. I would not call it strongly bearish, because price has not yet broken down from the reaction zone around 0.1905. But I also cannot call it bullish, because buyers have not shown meaningful strength yet.
This is a waiting chart right now. It is not ugly, it is just not ready yet.
Important Zones
Resistance / Bearish OBs
0.1985 - 0.2057 - This is the nearest red resistance / bearish OB area. If price bounces from here, this is where the first serious test may come. If JUP moves into this zone but cannot stay above it, another rejection could easily come from here.
0.2165 - This is an important horizontal resistance. If price reclaims this level, the short-side picture may weaken, and a stronger upside attempt could follow.
0.2356 - This is already a higher bearish zone, close to the larger descending trendline. If price reaches this area, I think many late longs may start believing in the story again. That is exactly why it can be dangerous.
0.2467 - This is the upper blue resistance. It is a more serious decision zone. If the market reaches this area and does not turn down from there, then the larger structure would need to be reconsidered.
Support / Bullish OBs
0.1905 - This is the current nearby support / reaction level. One of the most important questions now is whether price can hold this area.
0.1711 - This is the first more serious deeper bullish OB. If 0.1905 fails, this may become the first important long watch zone.
0.1622 - 0.1569 - This is already a deeper and stronger green OB zone. Here I would watch more closely to see whether buyers appear. If price drops into this area and gives a clear rejection, it could create a nice smart money style long setup.
0.1421 - This is deeper support. If price falls this far, then the current sideways structure has probably fully faded, and we would be talking about a larger bearish continuation.
Volume and RSI
Based on volume, I do not see strong buyer presence yet. It looks more like the market is slowly drifting, sometimes moving a little, but without the kind of momentum that would make me say, here comes the institutional tank division.
However, we can see something interesting where the blue volume bars appear. Selling pressure was absorbed there. Even though the candles were small, the volume inside them was quite large.
That gives a bit of hope, because the question is obvious. Why did they absorb all that selling?
The RSI also gives a fairly average picture at around 47. There is no extreme oversold condition and no strong bullish momentum.
This is more of a sideways, uncertain market.
So the chart is basically saying: patience, not rushing.
Long Battle Plan - From Bullish OB Defense
On the long side, I would not try to play hero around the current price. The cleaner long can come either from a confirmed reclaim or from a deeper bullish OB.
Long Setup 1 - After Holding 0.1905
This is the more aggressive long plan. It becomes interesting if JUP can hold the support around 0.1905 and starts building bullish structure on a lower timeframe.
What I want to see:
price holds the 0.1905 area
bullish ChoCh appears on the lower timeframe
after the retest, price does not fall back below the zone
a stronger bullish candle appears
volume improves at least a little
In simple terms: support holds -> bullish ChoCh -> retest -> long
Possible Long Plan
Entry: 0.191-0.194, after confirmation
Stop Loss: below 0.186
TP1: 0.1985
TP2: 0.2057
TP3: 0.2165
This long is more aggressive because we are still close to the lower / middle part of the range, and there is no strong momentum yet. So I would not rush this one.
Long Setup 2 - From the Deeper OB
This would be the cleaner smart money long for me. If price cannot hold the 0.1905 area, I would not immediately look for a long. I would rather wait to see whether it moves down to the deeper green OBs.
The zone I am watching: 0.1711-0.1569
What I would look for:
price slowly drifts or wicks into the 0.1711-0.1569 zone
local liquidity gets swept
a strong rejection candle appears
bullish ChoCh forms on the lower timeframe
price holds the zone after the retest
In simple terms: bullish OB -> sweep -> bullish reaction -> ChoCh -> retest -> long
Possible Long Plan
Entry: 0.171-0.157, after confirmation
Stop Loss: below 0.150
TP1: 0.1905
TP2: 0.1985
TP3: 0.2057
This would be the cleaner long, because the market would first shake out the impatient longs, and a strong reaction from there would be much more valuable.
Short Battle Plan - From Bearish OB Rejection
On the short side, the most important nearby area for me is the 0.1985-0.2057 zone. This red OB zone is the first serious resistance if price bounces from here.
Short Setup 1 - Weak Bounce Into the Red OB
I would look for a short if price moves up into the 0.1985-0.2057 zone, but starts weakening there.
What I want to see:
price bounces into the 0.1985-0.2057 zone
the move slows down
a rejection wick appears
bearish ChoCh forms on the lower timeframe
price falls back below 0.1905
price fails to reclaim it on the retest
In simple terms: weak bounce -> bearish OB -> rejection -> bearish ChoCh -> short
Possible Short Plan
Entry: 0.198-0.206, after confirmation
Stop Loss: above 0.210
TP1: 0.1905
TP2: 0.1711
TP3: 0.1622-0.1569
This short looks good only if price merely bounces into the red zone, collects the late longs, and then falls back below it. But if JUP clearly reclaims the 0.2057 area on the 4H timeframe, this short idea is dead.
Short Setup 2 - From Higher Resistance
If price bounces more strongly, then the next interesting short zone is around 0.2165. This is already a higher liquidity / resistance area. If price wicks into this zone but cannot stay above it, then a cleaner short reaction may follow.
Possible Plan
Entry: 0.214-0.217, after rejection
Stop Loss: above 0.222
TP1: 0.2057
TP2: 0.1985
TP3: 0.1905
This would be a higher and more patient short setup.
What Am I Watching Closely Now?
Can JUP hold the zone around 0.1905? If yes, we may see a bounce toward 0.1985-0.2057. If the bounce is strong, even 0.2165 can come into play. But if 0.1905 fails, then in my opinion the next logical stop is 0.1711, followed by the 0.1622-0.1569 zone.
This is not financial advice. The raccoon was simply thinking out loud about JUP today.
I wrote down what I see, what I think, and how I would trade it.
Then either I am right... or we learn from it. :))
IMPORTANT!
The entry prices and stop-loss levels are not set in stone. These are my own plans, and I share them only to teach the thinking process behind the setup. Never enter a trade blindly just because someone said so. Check it, verify it, and make your own decision. This is exactly how I explain it to my students as well, because this way the logic is easier to follow, and it becomes clearer what I actually mean when I talk about Order Blocks.
JUP 1D โ Symmetrical Triangle at Decision PointJUP on the 1D timeframe is currently trading around 0.3532 after recovering from the February low near 0.1360 and pushing up toward the descending upper trendline near 0.2400โ0.2500, with price now pressing into that trendline as the symmetrical triangle formed between it and the rising lower trendline approaches a resolution.
The chart shows a symmetrical triangle formed by a descending upper trendline originating from the November 2025 high near 0.3600, connecting through the May recovery high near 0.2800 and continuing to slope down into the 0.2400โ0.2500 area currently, while the rising lower trendline connects the February low near 0.1360 through the March low near 0.1360 and the June low near 0.1480, now climbing into the 0.1480โ0.1500 zone. Price spent February through April ranging in the lower portion of the triangle before a strong rally in May pushed it toward 0.2800 where the descending upper trendline rejected it. A subsequent pullback brought price back toward 0.1900โ0.2000 before recovering again into the current test of the trendline near 0.2400โ0.2500. The horizontal level near 0.2050โ0.2100 has acted as a consistent pivot through the mid-to-late portion of the structure and is now sitting as an important reference below current price.
Price is pressing directly into the descending upper trendline near 0.2400โ0.2500 for the second time, with the prior rejection from this level in May having produced a significant pullback, making the current test the most important on this chart.
Key Levels To Watch
โ 0.3400โ0.3600 โ November 2025 high, major resistance above
โ 0.2700โ0.2800 โ Prior recovery high, trendline rejection zone
โ 0.2400โ0.2500 โ Descending upper trendline, current test (dynamic)
โ 0.2200โ0.2300 โ Minor resistance zone inside triangle
โ 0.2050โ0.2100 โ Horizontal pivot, key reference below
โ 0.1900โ0.2000 โ Prior pullback low, support
โ 0.1480โ0.1500 โ Rising lower trendline, dynamic support (climbing)
A confirmed daily close above the descending upper trendline near 0.2400โ0.2500 and follow-through above 0.2700โ0.2800 would signal a bullish resolution out of the triangle, opening a move toward 0.3400โ0.3600 and a retest of the November 2025 high.
A rejection at the descending upper trendline near 0.2400โ0.2500 and a loss of 0.2050โ0.2100 would keep the bearish trendline structure intact and open a return toward the rising lower trendline near 0.1480โ0.1500, with a break below it signaling a full triangle breakdown.
Second test of descending upper trendline, prior rejection here produced a major pullback.
Break above 0.2400โ0.2500 โ triangle resolved bullish, eyes on 0.2700โ0.3600. Reject here โ return toward 0.2050โ0.2100 and lower trendline near 0.1480โ0.1500. Bias neutral inside triangle. Shift bullish only on confirmed daily close above descending trendline.
JUP USDT LONG SIGNAL#63.ย JUP/USDT โ Trade Setup (LONG)
๐ Position Type: LONG
๐ Timeframe: 1 H
๐ Market: Futures
๐ฐ Entry Zone:
0.2050
๐ Stop-Loss:
0.200
๐ฏ Take-Profit Targets:
โข TP1:ย 0.2090
โข TP2:ย 0.2132
โข TP3:ย 0.2171
โข TP4:ย 0.2213
TP5:ย
TP6:ย
โ๏ธ Leverage:
5- 10
โ ๏ธ After reaching TP1, move Stop-Loss to Entry Price.
๐ Risk Management:
Risk only 1โ2% of your capital per trade.
Always confirm the setup on your chart before entry
JUP: local squeeze with $0.25 destinationThe Macro Picture ๐บ๏ธ
JUP has spent the past two months in a broad $0.145โ0.28 range, a volatility playground where the extremes get faded and price keeps rotating back through the middle. The June flush to $0.145 set the macro floor, and the early-July push to $0.25 tested the ceiling before sellers stepped in. Price has now pulled back to the equilibrium line near $0.20 with RSI sitting neutral around 48. This is the balanced center of the range โ the floor is defended, the ceiling is defined, and the path of least resistance leans back toward the upper boundary from here.
The Setup โ๏ธ
The Buy Area: The $0.17โ0.20 band has repeatedly absorbed pullbacks. Bulls are defending the equilibrium, and as marked on the chart, price is holding above the $0.17 local support with room to rotate higher.
The Ceiling: The $0.22 decision line is the first hurdle. A clean reclaim flips the local structure bullish and opens the path toward the $0.25 macro resistance at the top of the range.
The Range Play: The zone between $0.17 and $0.22 creates a structural playground for grid-based accumulation โ staggered entries across the range capture the chop while the market decides its next macro leg.
The Roadmap: Primary target sits at $0.25 โ the green roadmap points there as price works up from the equilibrium toward the range top. Invalidation: a clean daily close below $0.145 would invalidate this bullish thesis and signal a structural breakdown out of the range.
More setups in profile.
#JUP #CRYPTO #Jupiter #Solana #TechnicalAnalysis
JUP will go DownHello Traders!
\\This trade has been analyzed with A1000x Golden alpha strategy.
There is a beautiful short formation at the peak in 1hr timeframe and after that we can see an expanding triangle, JUP is moving down to break this triangle. Target is set using A1000x target strategy. There are many more bearish confirmation in JUP.
We are selling JUP from 0.2335
Stoploss 0.2587 -10.6%)
Target 0.16 (+31.5%)
My goal is to be recognized as one of the highest win-rate traders in the TradingView community. :)
Trade Analysis Based on
> Fibonacci Tool (A1000x Way) โ Custom Fibonacci approach for precise market analysis
> Candlestick Patterns โ Strong price action confirmation through key candle formations
> A1000x Breakout Strategy โ Identifying and trading high-probability breakout setups
> HH, HL & LH, LL Strategy โ Market structure analysis for clear trend direction
> Swing Points โ Tracking key highs and lows for accurate price movement insight
> A1000x Stoploss Strategy โ Strategic stoploss placement for effective risk control
> A1000x Target Strategy โ Structured target setting based on price action
We trade using carefully developed strategies and disciplined market analysis, always seeking the best possible accuracy while remembering that ultimate success comes only by the will of Allah.
In some trades, you may notice a relatively larger stop loss or a risk-to-reward ratio that may appear unusual at first glance. However, every trade is taken with proper planning and calculated analysis, not random entries.
Before entering any position, we perform detailed calculations and market evaluation. Based on this analysis, we carefully determine our stop loss and target levels.
I personally apply one of my specialized stop-loss and target strategies, designed to place the stop loss at a logical market level where price is less likely to reach before moving toward the intended target โ InshaAllah.
Trading always involves risk, but with discipline, patience, and proper strategy, we aim for consistent and responsible decision-making.
Feel free to share your thoughts, leave a comment, or contact me.
JUP USDT SHORT SIGNALJUP /USDT โ Trade Setup (SHORT)
๐ Position Type: SHORT
๐ Timeframe: 1 H
๐ Market: Futures
๐ฐ Entry Zone:
0.2345
๐ Stop-Loss:
0.2411
๐ฏ Take-Profit Targets:
โข TP1:ย 0.2310
โข TP2:ย 0.2275
โข TP3:ย ย 0.2238
โข TP4:ย
TP5:ย
TP6:ย
โ๏ธ Leverage:
5- 10
โ ๏ธ After reaching TP1, move Stop-Loss to Entry Price.
๐ Risk Management:
Risk only 1โ2% of your capital per trade.
Always confirm the setup on your chart before entry
JUP: bullish spike toward $0.275The Macro Picture ๐บ๏ธ
JUP carved a structural peak at $0.275 back in early May, then bled into a deep flush that bottomed on the $0.145 macro floor in June โ the kind of volatility playground that sparks powerful reversals once the floor holds. Price has since V-recovered in a clean staircase of higher lows and now sits at the $0.215 equilibrium, pressing back toward the top of the macro range. The path of least resistance points up, with only the $0.24 decision level standing between current price and a full retest of the peak.
The Setup โ๏ธ
The Reaction: The recovery off the $0.145 macro floor has printed higher low after higher low, and RSI is holding above its midline as the trend rebuilds. Every pullback since the June bottom has been bought โ a signal that buyers are defending the structure on the way up.
The Ceiling: Price is now tagging the $0.24 Local High / Decision level, the lower edge of the supply zone that capped the May breakdown between $0.24 and $0.26. This is the high-confluence zone bulls need to clear to trap the shorts stacked against the range top.
The Roadmap: Primary target sits at $0.275 โ the macro ceiling and May structural peak, exactly where the green roadmap points once the $0.24 decision breaks and the buy stops above it get triggered. Invalidation: a sustained 1D close below $0.19 would invalidate this bullish thesis and open the bearish path back toward the macro floor at $0.145.
JUP about to Explode? Long Setup + Key Levels๐ JUP is quietly building strength while the market corrects โ and the volume data is telling a bullish story most people are missing.
Here's the full breakdown ๐
Following the recent broad market correction, JUP saw a healthy pullback and is now testing resistance at 0.2343.
Price has been respecting an ascending curved trendline, which was briefly faked out before buyers stepped back in and reclaimed it โ a clear sign of underlying strength.
๐ Volume tells the real story: during upward impulses, volume expanded noticeably, while during the correction phase, volume contracted โ suggesting sellers lack conviction and buyers remain firmly in control.
๐ฏ Trade Setup:
Direction: Long
Entry: On break and retest of 0.2343, or on a pullback to the curved trendline
Stop Loss: 0.2199
Target 1: 0.2645
Risk/Reward: ~1:3.3
๐ Key levels:
Resistance: 0.2343
Support (horizontal): 0.1817
Major support: 0.1413
As long as price holds above the curved trendline, structure favors continuation to the upside once 0.2343 is broken with volume confirmation.
๐ฌ What's your take on JUP? Drop your thoughts below.
๐ Follow for more setups like this.
JUPUSDT support flip retest: targeting $0.220The Macro Picture ๐บ๏ธ
Four targets hit in seventeen sessions โ the entire recovery sequence from the June 10 macro floor sweep has played out, with the final stop at the May supply shelf rejecting price on a clean $0.240 wick last week. The pullback from that rejection has been just as decisive as the rally that produced it, retracing the entire June extension back to the $0.200 flipped wall in four sessions. This is the first retest from above of the level that capped four months of attempts โ the structural test that decides whether the support flip is real or whether the May supply rejection ends the recovery cycle.
The Setup โ๏ธ
The Rejection: The $0.240 wick into the May supply shelf was textbook distribution โ wide range up, sharp reversal candle, and four consecutive red sessions back to the prior breakout level. The supply zone has done its job; the question is whether the breakout structure beneath survives the test.
The Support Flip Test: $0.200 is the line where the entire bullish narrative is decided. Bulls defending here on the daily close turns the post-spike compression base into a clean stair-step higher-low โ a wick into $0.195 followed by a recovery candle is the structural signature of a real flip. A clean break below opens the unwind back through every level the recovery just reclaimed.
The Reaction: RSI has cooled from the upper 60s back to the midline, draining the post-rejection downside momentum without printing oversold. The indicator is positioned for a recovery attempt โ it has shed enough heat to support a second leg, but not so much that it requires capitulation first.
The Roadmap: Primary target sits at $0.220 โ the lower edge of the supply zone, where the rejected territory begins. The white projection points through a brief retest of the $0.195โ0.200 zone before reversing back toward the supply edge. Invalidation: a sustained 1D close below $0.200 would invalidate the support flip thesis and reopen the $0.190 prior stall floor as the next downside magnet, with the $0.165 reclaimed floor as the deeper structural test.
JUP USDT SHORT SIGNALJUP /USDT โ Trade Setup (SHORT)
๐ Position Type: SHORT
๐ Timeframe: 1 H
๐ Market: Futures
๐ฐ Entry Zone:
0.2180
0.2225
๐ Stop-Loss:
0.2245
๐ฏ Take-Profit Targets:
โข TP1:ย 0.2127
โข TP2:ย 0.2083
โข TP3:ย ย 0.2023
โข TP4:ย 0.1961
TP5:ย
TP6:ย
โ๏ธ Leverage:
6โ3
โ ๏ธ After reaching TP1, move Stop-Loss to Entry Price.
๐ Risk Management:
Risk only 1โ2% of your capital per trade.
Always confirm the setup on your chart before entry
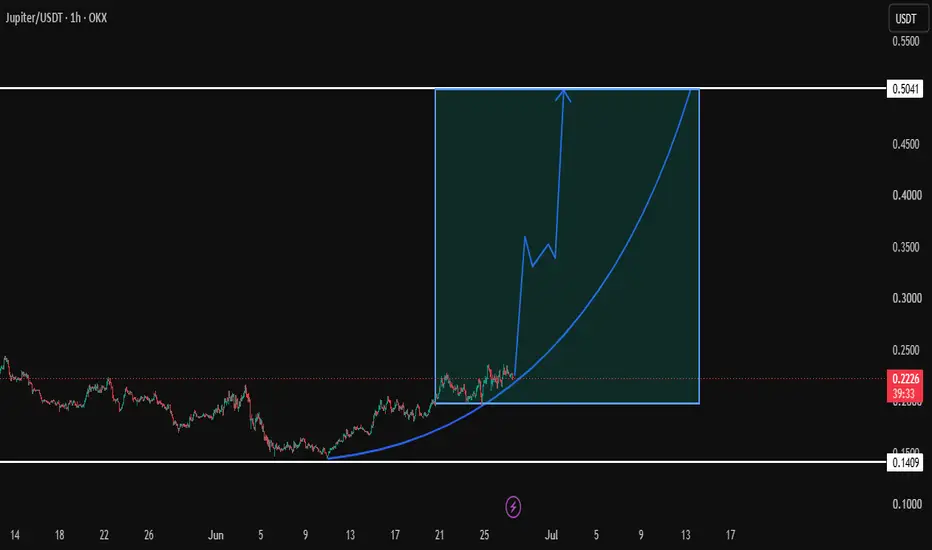
JUP:USDT THIS CAN BE THE START OF THE GOLDEN INCREASE OF JUPITERDepending on trend data, and accumulation data, there is a interest on DCA following of this token by whale trend, which makes this token an interesting token, that can even have a golden breakout in the coming time to over $0,50.. This will be over a trend of 100% like velvet did, and that is exactly what we are going to follow for this token in the coming time.
JUPUSDT: bullish extension toward $0.235The Macro Picture ๐บ๏ธ
The post-reclaim squeeze has resolved โ and resolved exactly as the bullish branch mapped. Price broke through the $0.200 wall, cleared the $0.205 ceiling, and just tagged the $0.220 target on a clean four-session run. That is the second consecutive bullish target hit in this series, with the entire move tracing back to the macro floor sweep at $0.144 on June 10. The structure has finished its rebuild phase: $0.200 has flipped from the most-tested resistance on the chart into structural support, the prior stall floor at $0.190 is now well below price, and the next test sits at the lower edge of the May overhead supply zone.
The Setup โ๏ธ
The Flipped Wall: $0.200 capped four months of attempts before finally breaking โ and price has now spent multiple sessions trading well above it without a single dip back into the level. The wall has become the floor, and the post-spike compression range below it has been retired.
The Reaction: RSI has lifted from the midline back into the upper 50s without printing overbought. Eight days of recovery, two targets hit, and the indicator still has room to extend โ the kind of slow, structural momentum that tends to carry through to the next supply test rather than fade beforehand.
The Continuation Path: The territory between $0.220 and $0.235 is unwalked since the immediate post-spike unwind in mid-May. Bulls have a clear runway through that pocket with no intermediate horizontal blocks โ the next real test is the supply shelf at $0.235 itself.
The Roadmap: Primary target sits at $0.235 โ the lower edge of the May overhead supply zone, where the original distribution shelf demands to be retested. Invalidation: a sustained 1D close back below $0.200 would invalidate the continuation thesis, signal that the flipped wall has failed to hold as support, and reopen the deeper retest toward the $0.165 reclaimed floor.
JUPUSDT post-reclaim squeeze: targeting $0.220The Macro Picture ๐บ๏ธ
The June 15 reclaim thesis has held its key levels but stalled short of its target. Price tagged $0.200 cleanly, the predicted consolidation window opened between $0.180 and $0.200, and the $0.190 invalidation has been defended on every test since. The bullish base is intact โ but the next leg toward $0.220 has refused to fire, and the local structure has compressed into a tight squeeze between the stall floor at $0.190 and the unfinished business at the supply edge. This is the resolution window: either the squeeze breaks upward and reaches the original target, or it bleeds out laterally and reopens the deeper retest.
The Setup โ๏ธ
The Stall: Price has spent five sessions oscillating between $0.190 and $0.205 without a single decisive close in either direction. The $0.200 wall has capped every push, but the $0.190 floor has absorbed every flush โ a classic compression pattern that resolves with conviction once one side gives way.
The Reclaimed Floor: The $0.165 level that anchored the June 13 reversal still sits well below price as the structural backstop. As long as the broader recovery sequence stays above $0.165, the post-sweep base remains intact โ even if the local squeeze resolves with a deeper retest first.
The Reaction: RSI has drifted from the upper 50s into the low 50s, sitting right on the midline. Momentum is neutral, not weak โ which means the next directional break is more likely to come from price action than from indicator exhaustion.
The Roadmap: Primary target sits at $0.220 โ the lower edge of the May overhead supply zone, where the June 15 thesis was originally pointed. Invalidation: a sustained 1D close below $0.190 would invalidate the squeeze thesis and reopen the $0.165 reclaimed floor as the next downside magnet, where the broader recovery base would face its first real stress test.
Jupiter JUP-BOOM!Beautiful altcoins, beautiful market, beautiful Bitcoin...
Good afternoon my fellow Cryptocurrency trader, I hope you are having a very nice (great-awesome) weekend, I truly hope you do.
If you do, great because everything is about to get better than better already better things will get with the Cryptocurrency market turning hyper-bullish next week.
We are talking bullish as in growth. Bullish we are already for months based on technicals, the chart structure; higher lows.
JUPUSDT is very similar to many projects right now, the downtrend ended more than four months ago. Now, after some bullish action we get a retrace and this retrace ended as a higher low. What happens next?
Higher lows will always lead into new highs, higher highs and this reveals a massive bullish wave coming to JUP, Jupiter, the altcoins and the Cryptocurrency market.
We have perfect timing. Countless opportunities are available for us. The market is trading at the bottom now but this is only the startโeverything will heat up.
Thanks a lot for your continued support.
Namaste.
JUP USDT SHORT SIGNALJUP/USDT โ Trade Setup (SHORT)
๐ Position Type: SHORT
๐ Timeframe: 15M
๐ Market: Futures
๐ฐ Entry Zone:
0.1885
๐ Stop-Loss:
0.1940
๐ฏ Take-Profit Targets:
โข TP1:ย 0.1850
โข TP2:ย 0.1780
โข TP3:ย 0.1748
โข TP4:ย 0.1695
TP5:
โ๏ธ Leverage:
5โ
โ ๏ธ After reaching TP1, move Stop-Loss to Entry Price.
๐ Risk Management:
Risk only 1โ2% of your capital per trade.
Always confirm the setup on your chart before entry
JUPUSDT 1D#JUP has broken above the bullish flag on the daily chart and is currently facing resistance at the daily SMA50.
A retest of the breakout zone (which aligns with the daily SMA100 area) is still possible before continuation of the next bullish leg.
If structure holds, the following upside targets remain valid:
๐ฏ $0.2246
๐ฏ $0.2516
๐ฏ $0.2785
๐ฏ $0.3168
๐ฏ $0.3656
โ ๏ธ Always remember to use a tight stop-loss and maintain proper risk management.
JUP USDT LONG SIGNALJUP/USDT โ Trade Setup (LONG)
๐ Position Type: LONG
๐ Timeframe: 15M
๐ Market: Futures
๐ฐ Entry Zone:
0.1917
0.1875
๐ Stop-Loss:
0.1820
๐ฏ Take-Profit Targets:
โข TP1:ย 0.2010
โข TP2:ย 0.2096
โข TP3:ย 0.2230
โข TP4:ย
TP5:
โ๏ธ Leverage:
5โ
โ ๏ธ After reaching TP1, move Stop-Loss to Entry Price.
๐ Risk Management:
Risk only 1โ2% of your capital per trade.
Always confirm the setup on your chart before entry