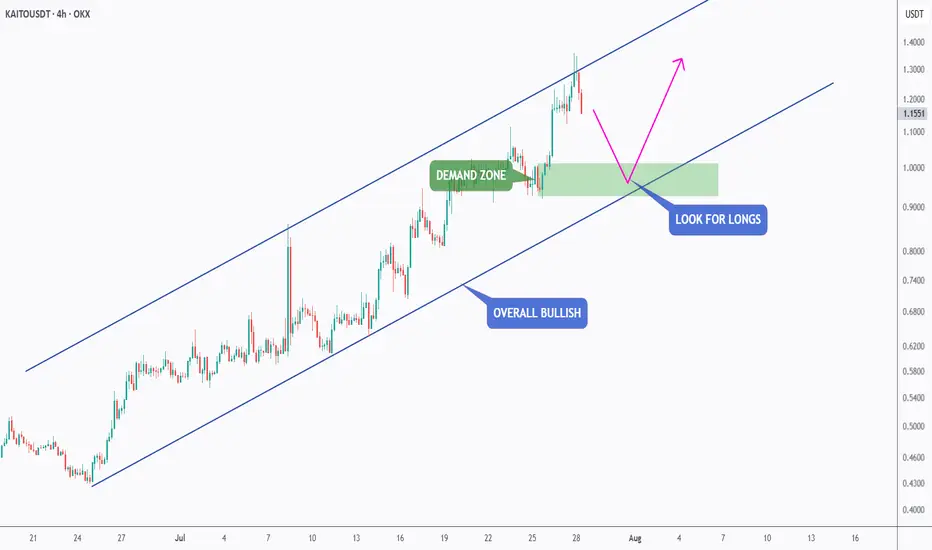
KAITO - Demand Zone Meets Trendline SupportKAITO is approaching a high-confluence support area, where the lower blue trendline intersects with the green demand zone. 📊
📌 As long as this intersection continues to hold, the broader bullish structure remains intact, and we will be looking for trend-following long setups.
This confluence repre
I've been watching $KAITO for weeks, and it's finally starting tI've been watching CRYPTOCAP:KAITO for weeks, and it's finally starting to play out.
The downtrend is broken, momentum is building, and buyers are stepping back in.
As long as price holds this demand zone, I still believe this move has more room to run. A clean hold here could send price toward
KAITO: local squeeze with $1.3566 destinationThe Macro Picture 🗺️
KAITO exploded out of its spring base near $0.45 and has run all the way to $1.1936, now pressing the $1.3566 macro ceiling. This is a full trend reversal — buyers firmly in control and driving price into the top of the range.
The Setup ⚙️
The Range Floor 🟢
$0.9520 (Local Low)
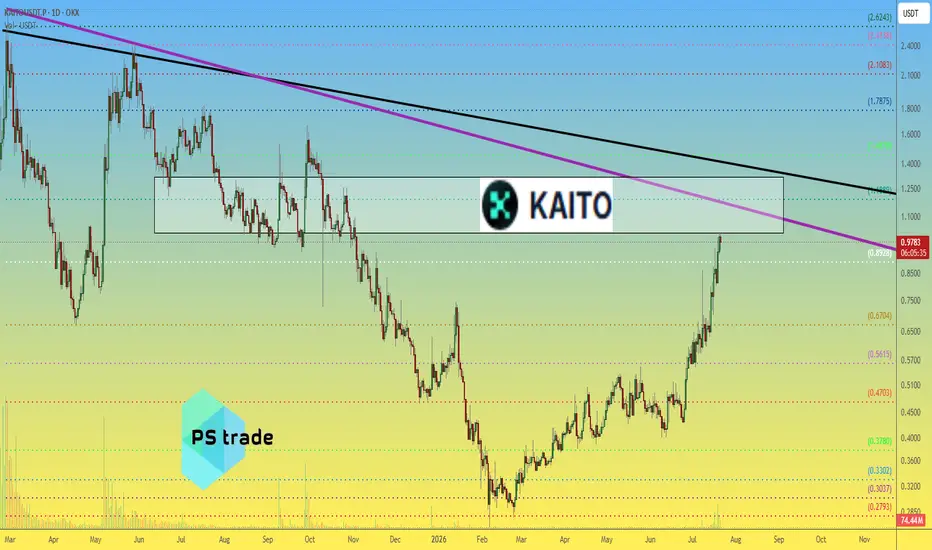
KAITO price analysis👨💻 Those who have been holding CRYPTOCAP:KAITO since our previous analysis may want to start watching the chart more closely.
▪️ OKX:KAITOUSDT has now entered an interesting and highly liquid zone between $1.02 and $1.32. The $1.19 level is particularly noteworthy, as buyers struggled to brea
KAITOUSDT - $14.5m Token Unlock + Bearish DivergenceKAITOUSDT was printing a series of HH and HL in an uptrend, however, a strong bearish divergence formed on the 1hr may let it correct to the 0.5 fib. Fundamentally there is a token Unlock today, which may cause high sell pressure. Therefore, putting a sell stop below the previous HL to enter on the
KAITOUSDT Forming Bullish MomentumKAITOUSDT is forming a clear bullish momentum pattern, a classic bullish wave signal that often indicates an upcoming breakout. The price has been consolidating within a narrowing range, suggesting that selling pressure is gradually weakening while buyers are beginning to regain control. With consis
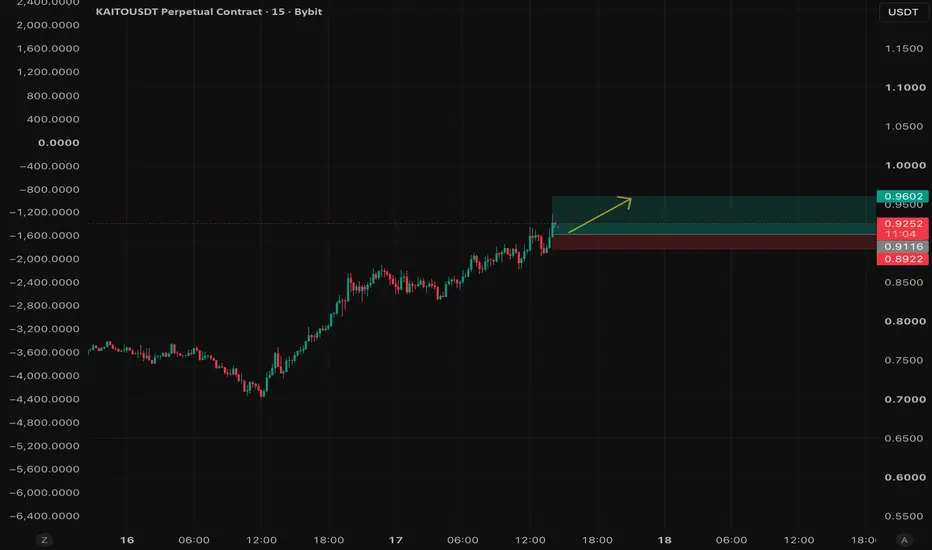
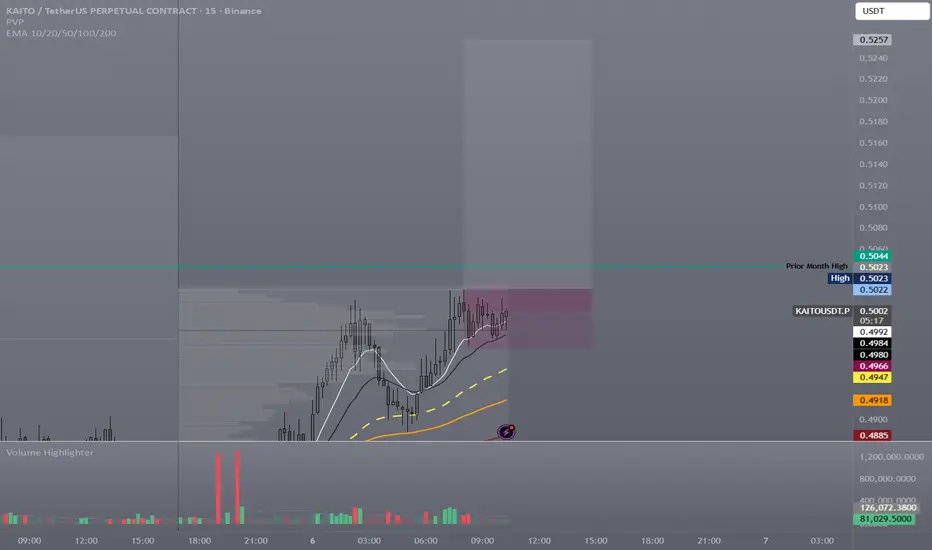
KAITOUSDT Long Setup | 15mKAITOUSDT is currently trading above recent support after establishing a short-term bullish structure on the 15-minute timeframe.
Technical Overview
• Bullish market structure remains intact.
• Higher highs and higher lows continue to develop.
• Momentum is currently favoring buyers.
• The previou
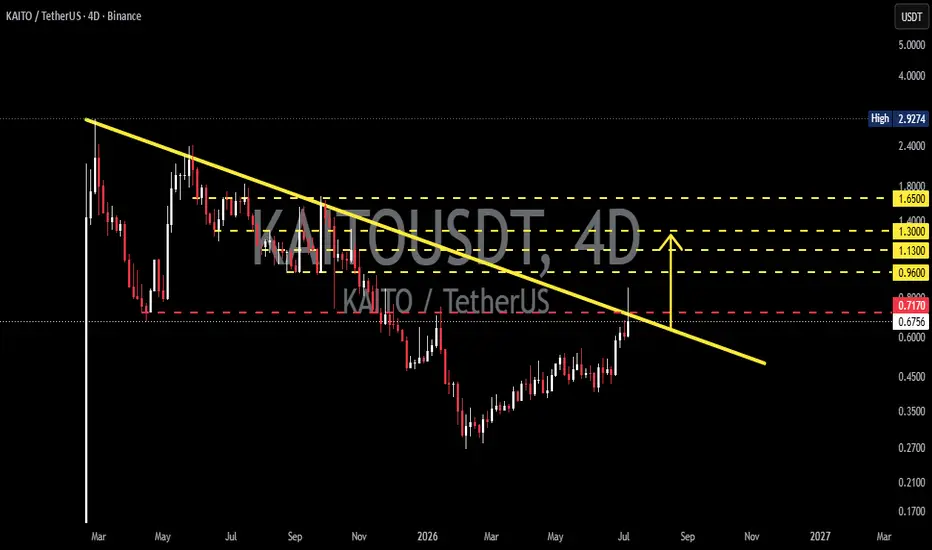
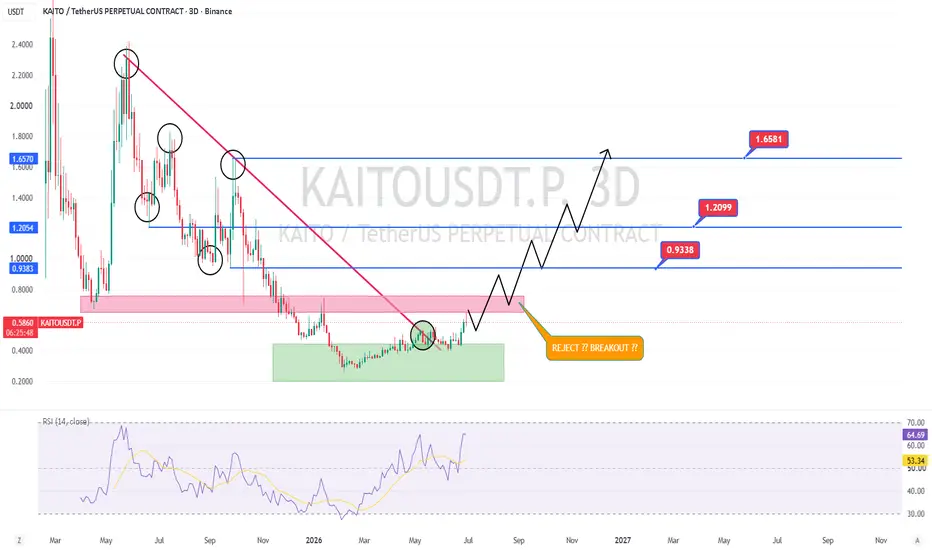
KAITO - Descending Trendline, Will Bullish Momentum Continue?This chart shows that KAITO is currently testing a major resistance in the form of a Descending Trendline 📉 that has capped price action for several months. After forming a series of Higher Lows 📈, buying pressure is gradually increasing, and the price is now approaching a crucial decision zone. ⚠️
KAITOUSD Is Finally Waking Up ??🚨 KAITO Is Finally Waking Up ??
After months of trading inside a strong downtrend, CRYPTOCAP:KAITO is now testing a major supply zone. This is the first area where sellers could become active again, so rushing into a long here doesn't offer the best risk-to-reward.
If price breaks above this res
KAITO Holding PWPOC After PWH Break
KAITO has broken above prior week high and is now holding the prior week POC on the retest. Price remains above the 10/20 EMA, keeping the higher-timeframe structure constructive.
The key now is whether this acceptance can turn into another expansion leg.
HTF Context:
The important higher-tim
See all ideas
Summarizing what the indicators are suggesting.
Oscillators
Neutral
SellBuy
Strong sellStrong buy
Strong sellSellNeutralBuyStrong buy
Oscillators
Neutral
SellBuy
Strong sellStrong buy
Strong sellSellNeutralBuyStrong buy
Summary
Neutral
SellBuy
Strong sellStrong buy
Strong sellSellNeutralBuyStrong buy
Summary
Neutral
SellBuy
Strong sellStrong buy
Strong sellSellNeutralBuyStrong buy
Summary
Neutral
SellBuy
Strong sellStrong buy
Strong sellSellNeutralBuyStrong buy
Moving Averages
Neutral
SellBuy
Strong sellStrong buy
Strong sellSellNeutralBuyStrong buy
Moving Averages
Neutral
SellBuy
Strong sellStrong buy
Strong sellSellNeutralBuyStrong buy
Displays a symbol's price movements over previous years to identify recurring trends.