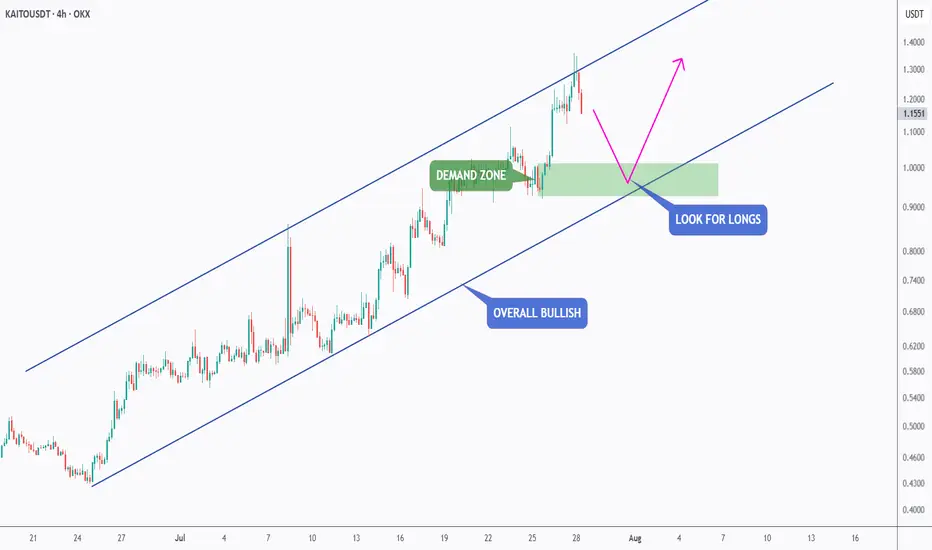
KAITO - Demand Zone Meets Trendline SupportKAITO is approaching a high-confluence support area, where the lower blue trendline intersects with the green demand zone. 📊
📌 As long as this intersection continues to hold, the broader bullish structure remains intact, and we will be looking for trend-following long setups.
This confluence represents an important decision area where buyers may step in and potentially trigger the next bullish impulse. However, rather than anticipating the bounce, we will wait for price action to confirm that buyers are defending the zone before considering any positions.
Will this high-confluence support fuel the next leg higher, or will sellers finally break the trend? 🤔
⚠️ Disclaimer: This is not financial advice. Always do your own research and manage risk properly.
📚 Stick to your trading plan regarding entries, risk, and management.
Good luck! 🍀
All Strategies Are Good; If Managed Properly!
~Richard Nasr
In-depth trading ideas
KAITO: local squeeze with $1.3566 destinationThe Macro Picture 🗺️
KAITO exploded out of its spring base near $0.45 and has run all the way to $1.1936, now pressing the $1.3566 macro ceiling. This is a full trend reversal — buyers firmly in control and driving price into the top of the range.
The Setup ⚙️
The Range Floor 🟢
$0.9520 (Local Low) is the breakout shelf the move is built on, with $0.3797 (Macro Support) as the deeper structural base far below. As long as $0.9520 holds on pullbacks, the uptrend stays intact.
The Decision Point 🔴
$1.3566 (Macro Resistance) is the gate. A daily close above it clears the ceiling and confirms continuation; it's also the measured-move target for this leg.
The Roadmap 🛣️
Hold above $0.9520 → break $1.3566 → continuation higher. Invalidation is a clean daily close back below $0.9520 — that ends the breakout.
This is a GRID Range Play: rotate the $0.9520–1.3566 band, buying pullbacks toward the floor and scaling out into the ceiling.
#KAITO #crypto #trading #TA #3Commas #GRID
I've been watching $KAITO for weeks, and it's finally starting tI've been watching CRYPTOCAP:KAITO for weeks, and it's finally starting to play out.
The downtrend is broken, momentum is building, and buyers are stepping back in.
As long as price holds this demand zone, I still believe this move has more room to run. A clean hold here could send price toward the $2+ region in the coming weeks.
I'm staying bullish on this one until the chart tells me otherwise. 🚀📈
KAITO price analysis👨💻 Those who have been holding CRYPTOCAP:KAITO since our previous analysis may want to start watching the chart more closely.
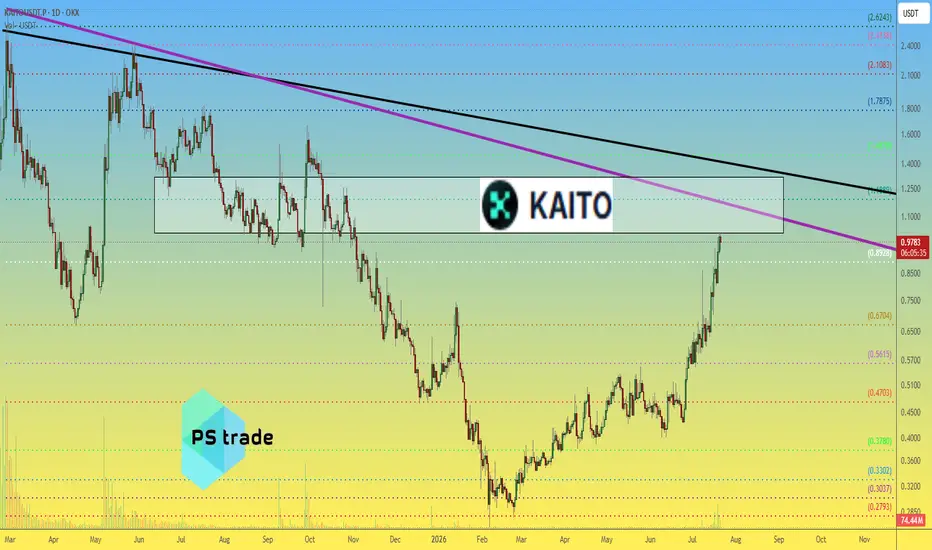
▪️ OKX:KAITOUSDT has now entered an interesting and highly liquid zone between $1.02 and $1.32. The $1.19 level is particularly noteworthy, as buyers struggled to break through it, and that battle is clearly visible on the chart.
▪️ There are a few other things that catch our attention. Price is approaching major trendlines, the current rally has unfolded with almost no meaningful pullbacks, and most importantly, the move has not been supported by a noticeable increase in trading volume.
▪️ For now, our conclusion is fairly straightforward. The market may still push CRYPTOCAP:KAITO a little higher, but every additional cent is likely to become more difficult to gain. On the other hand, sending the price back down would probably require much less effort.
Of course, we could be missing something.
💬 So tell us: what fundamental reasons do you see that could justify a significantly higher valuation for CRYPTOCAP:KAITO ?
______________
◆ Follow us ❤️ for daily crypto insights & updates!
🚀 Don’t miss out on important market moves
🧠 DYOR | This is not financial advice, just thinking out loud
KAITOUSDT - $14.5m Token Unlock + Bearish DivergenceKAITOUSDT was printing a series of HH and HL in an uptrend, however, a strong bearish divergence formed on the 1hr may let it correct to the 0.5 fib. Fundamentally there is a token Unlock today, which may cause high sell pressure. Therefore, putting a sell stop below the previous HL to enter on the break of structure reversing the trend.
KAITOUSDT Forming Bullish MomentumKAITOUSDT is forming a clear bullish momentum pattern, a classic bullish wave signal that often indicates an upcoming breakout. The price has been consolidating within a narrowing range, suggesting that selling pressure is gradually weakening while buyers are beginning to regain control. With consistent trading volume confirming accumulation at lower levels, the current setup hints at a potential bullish breakout in the near future. The projected move could lead to an impressive gain of around 90% to 100% once the price breaks above the key resistance level.
This bullish momentum pattern is typically seen at the end of downtrends or corrective phases, representing a potential shift in market sentiment from bearish to bullish. Traders closely watching KAITOUSDT are noticing strengthening momentum as the price approaches a critical breakout zone. Strong trading volume adds confidence to this setup, showing that market participants are positioning early in anticipation of a sustained upward move.
Growing investor interest in KAITOUSDT reflects increasing confidence in the project's long-term fundamentals and its improving technical outlook. If the breakout is confirmed with sustained buying volume, it could mark the beginning of a fresh bullish leg. The ongoing consolidation phase suggests steady accumulation, creating favorable conditions for a strong continuation rally once the resistance level is cleared.
Traders may find this an attractive medium-term opportunity, especially as the bullish momentum pattern nears completion and buying pressure continues to build. A confirmed breakout could attract additional market participation and accelerate the move toward the projected upside target.
✅ Show your support by hitting the like button.
✅ Leaving a comment below! (What is You opinion about this Coin)
Your feedback and engagement keep me inspired to share more insightful market analysis with you!
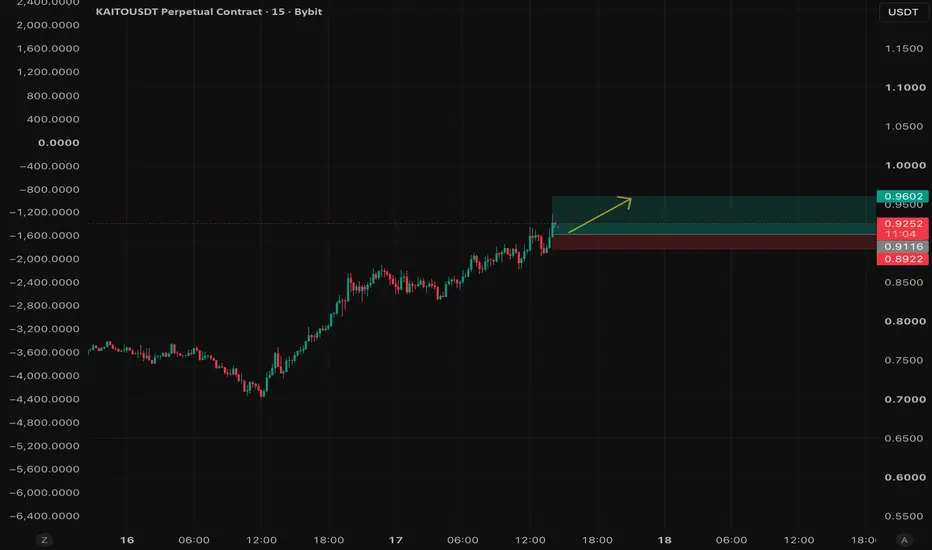
KAITOUSDT Long Setup | 15mKAITOUSDT is currently trading above recent support after establishing a short-term bullish structure on the 15-minute timeframe.
Technical Overview
• Bullish market structure remains intact.
• Higher highs and higher lows continue to develop.
• Momentum is currently favoring buyers.
• The previous resistance zone may now act as support.
Trade Idea
Entry: 0.9116
Take Profit: 0.9602
Stop Loss: 0.8922
Risk/Reward: approximately 2.5 : 1
What I'll Watch
Strong buying volume above the entry area.
A successful retest of support.
Rejection below the stop-loss level would invalidate this setup.
As always, wait for confirmation and manage your risk accordingly.
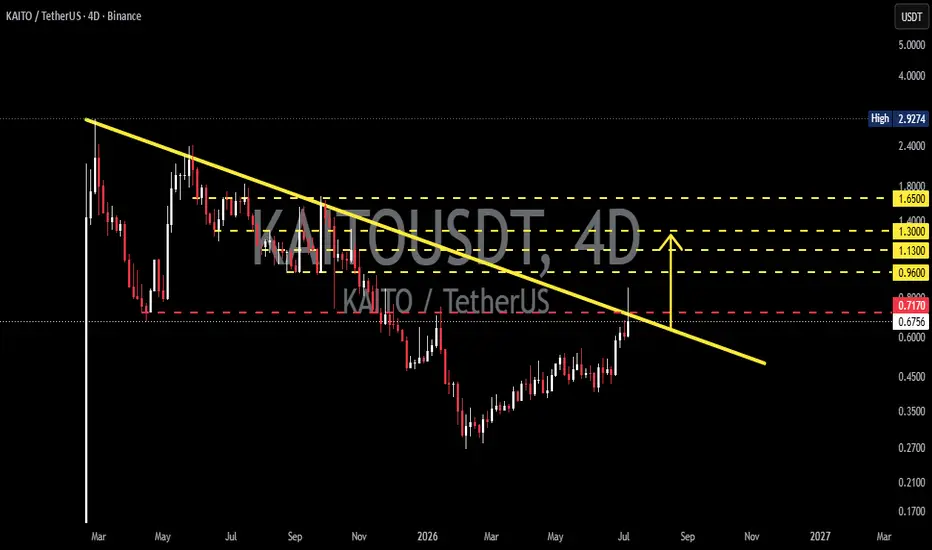
KAITO - Descending Trendline, Will Bullish Momentum Continue?This chart shows that KAITO is currently testing a major resistance in the form of a Descending Trendline 📉 that has capped price action for several months. After forming a series of Higher Lows 📈, buying pressure is gradually increasing, and the price is now approaching a crucial decision zone. ⚠️
If buyers can maintain their momentum and deliver a valid breakout supported by strong trading volume 📊, the probability of a Trend Reversal will increase significantly. 🚀
━━━━━━━━━━━━━━━━━━━━
📊🔍 Pattern Formation: Descending Trendline Breakout Attempt
The chart is dominated by a Descending Trendline, connecting a series of Lower Highs from previous peaks.
✨ Pattern Characteristics:
🔸 Indicates seller dominance throughout the downtrend. 📉
🔸 The more frequently the resistance is tested, the greater the probability of a successful breakout. 💥
🔸 A valid breakout is typically confirmed by a candle close above the trendline accompanied by increasing trading volume. 📊
📍 At the moment, price is sitting right at this key confirmation area, making the next move extremely important for determining the future trend.
━━━━━━━━━━━━━━━━━━━━
🟢🚀 Bullish Scenario
The bullish outlook becomes stronger if:
✅ A 4D candle closes above the Descending Trendline.
✅ The resistance around 0.71 USDT successfully flips into support (successful retest).
If the breakout is confirmed, the next upside targets are:
🎯 Target 1: 0.96 USDT
🎯 Target 2: 1.13 USDT
🎯 Target 3: 1.30 USDT
🎯 Target 4: 1.65 USDT
📈 If the overall cryptocurrency market remains bullish, the probability of reaching these targets increases significantly.
━━━━━━━━━━━━━━━━━━━━
🔴📉 Bearish Scenario
A bearish scenario may develop if:
❌ Price fails to break above the Descending Trendline.
❌ Strong rejection occurs around the 0.71 USDT resistance level.
❌ The candle closes back below the breakout area, turning the move into a False Breakout (Bull Trap). ⚠️🐂
If this occurs, the price could revisit previous support levels and continue its consolidation phase or even resume the broader downtrend.
━━━━━━━━━━━━━━━━━━━━
📍🧭 Key Levels to Watch
🟡 Major Resistance Levels
🔸 0.71 USDT (Breakout Level)
🔸 0.96 USDT
🔸 1.13 USDT
🔸 1.30 USDT
🔸 1.65 USDT
🟢 Bullish Confirmation
✅ Breakout with a candle close above the trendline.
✅ Successful retest holding the breakout area as support.
✅ Increasing trading volume during the breakout. 📊
🔴 Bearish Confirmation
❌ Rejection from the Descending Trendline.
❌ False Breakout (Bull Trap). ⚠️
❌ Price moves back below the primary resistance level.
━━━━━━━━━━━━━━━━━━━━
📌💡 Conclusion
KAITO is currently at a Critical Decision Zone. ⚖️
The long-term Descending Trendline, which has capped price action for months, is now being tested once again. If a breakout is confirmed with a strong candle close and high trading volume, the market structure could shift from Bearish ➜ Bullish, opening the door for a potential rally toward 0.96–1.65 USDT. 🚀📈
However, traders should wait for proper breakout confirmation before making trading decisions, as the risk of a False Breakout remains high without a convincing close and sufficient volume. ⚠️
━━━━━━━━━━━━━━━━━━━━
> ⚠️ Disclaimer: This analysis is based solely on technical analysis and should not be considered financial advice. Always DYOR (Do Your Own Research) 🧐 and practice proper risk management 🛡️ before making any investment or trading decisions.
#KAITO #KAITOUSDT #Crypto #Cryptocurrency #Altcoin #Binance #TechnicalAnalysis #TradingView #PriceAction #Trendline #Breakout #Bullish #Bearish #Support #Resistance #CryptoTrading #SwingTrading #ChartAnalysis #DYOR #RiskManagement #TrendReversal #VolumeAnalysis #SmartMoney #CryptoInvestor 📈💎
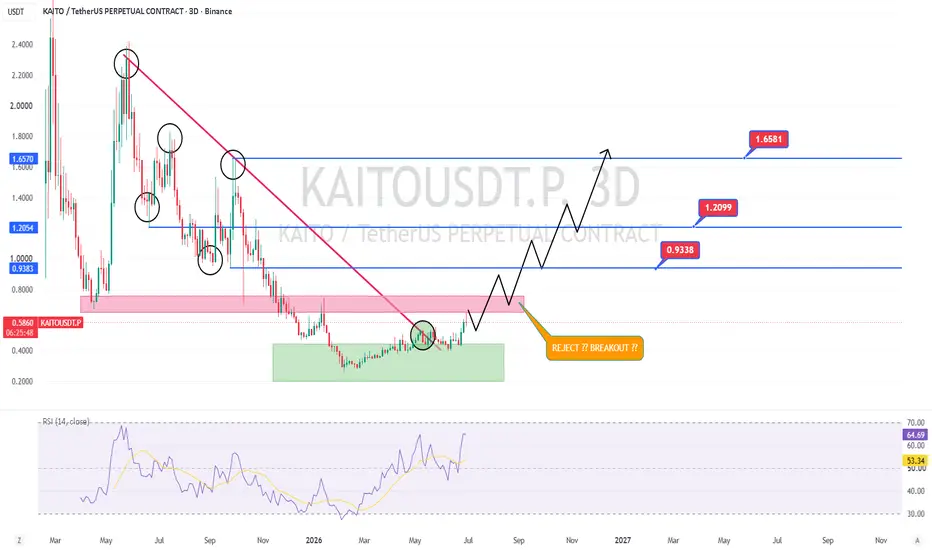
KAITOUSD Is Finally Waking Up ??🚨 KAITO Is Finally Waking Up ??
After months of trading inside a strong downtrend, CRYPTOCAP:KAITO is now testing a major supply zone. This is the first area where sellers could become active again, so rushing into a long here doesn't offer the best risk-to-reward.
If price breaks above this resistance and turns it into support, the next upside targets come into focus around 0.93, 1.20, and potentially 1.65 over the higher timeframe. A clean breakout with strong volume would be a much healthier signal than buying directly into resistance.
On the other hand, if this zone rejects price, I'll be watching for a pullback into demand before looking for another opportunity. The trend is improving, but confirmation always comes before conviction. Patience is what separates good trades from expensive ones. 📈
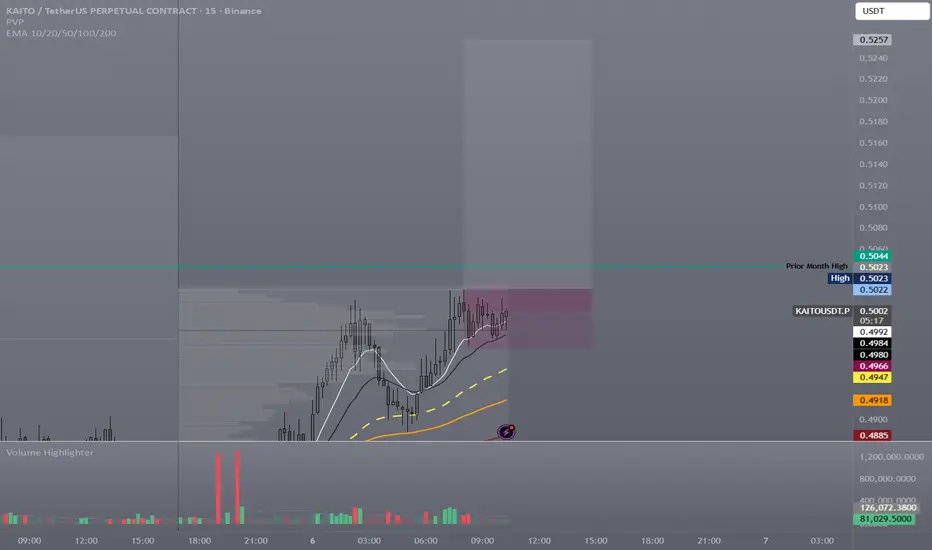
KAITO Holding PWPOC After PWH Break
KAITO has broken above prior week high and is now holding the prior week POC on the retest. Price remains above the 10/20 EMA, keeping the higher-timeframe structure constructive.
The key now is whether this acceptance can turn into another expansion leg.
HTF Context:
The important higher-timeframe shift came when KAITO broke above PWH and started accepting above prior weekly structure.
After that breakout, price pulled back into PWPOC and held the retest. That matters because it shows participants are defending prior weekly value instead of allowing price to rotate back through it.
As long as price remains above PWPOC and the rising 10/20 EMA, the HTF read stays constructive.
LTF Structure:
On the lower timeframe, KAITO is compressing near the highs after reclaiming the EMA stack. Price is not aggressively rejecting from the upper range. Instead, it is tightening under the next key level while holding higher-lows.
That compression is important. It shows the market is building time and value instead of immediately giving back the prior expansion.
Cycle Position:
This is a potential **Base & Break continuation** after the HTF reclaim.
The break above PWH was the structure shift. The PWPOC retest was the acceptance check. Now the lower timeframe is deciding whether that acceptance turns into expansion.
Scenarios:
🟢 Continuation
If KAITO breaks out of the current compression and accepts above the prior month high zone around 0.5044, I would look for continuation into the recent high area around 0.5165–0.5189.
The clean version would be volume expansion, strong closes near the highs, and LTF structure holding above the breakout level.
🔴 Failure
If price loses the compression lows and starts accepting back below the short EMA stack, the setup weakens.
A deeper warning would be a loss of PWPOC, because that would show the market failed to hold the prior weekly value retest after breaking above PWH.
Execution Mindset:
I am not trying to predict the breakout. I am watching whether participants continue defending the PWH/PWPOC reclaim.
The ideal long setup comes from either clean acceptance above the current compression, or a controlled pullback that holds above PWPOC and the rising 10/20.
KAITO has the HTF structure shift. Now the trade is about whether acceptance above prior weekly value can turn into expansion.
**Disclaimer:**
Not a signal. Just how I’m reading structure and participation.
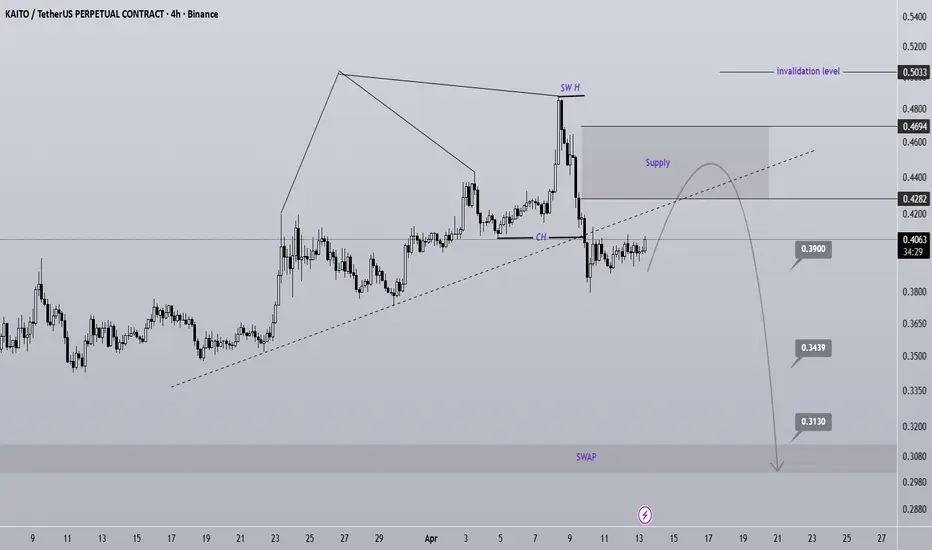
KAITO Turns Bearish | Short Setup in PlayA key bullish trendline has been broken to the downside, and we now have a bearish CH on the chart.
A three-drive pattern is also visible, which may indicate buyer exhaustion and the presence of sellers.
Price is currently pulling back to the order zone before potentially dropping further.
We are looking for sell/short positions within the supply zone.
Targets are marked on the chart move your stop to breakeven at the first target.
A daily candle close above the invalidation level will invalidate this analysis
If you would like us to analyze a coin or altcoin for you, first like this post, then comment the name of your altcoin below.
What is your opinion about KAITO?
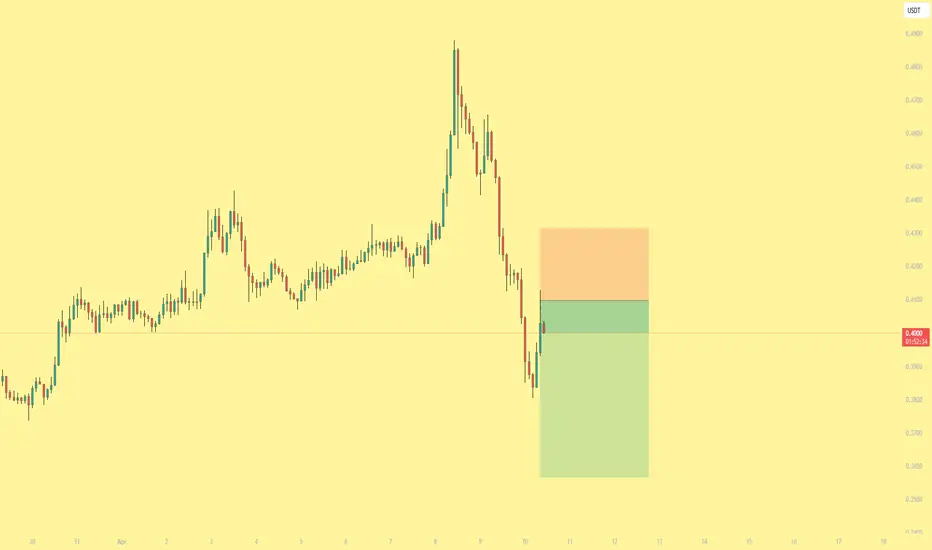
KAITO/USDT — Short After Parabolic Rejection, Targeting the Gap KAITOUSDT Perpetual
KAITO went parabolic from 0.38 to 0.49 — a 30% move in a few days. That kind of vertical rally rarely holds. Price has already given back most of the move, dropping from 0.49 to 0.40 in a sharp sell-off. The structure is broken.
A signal flagged this short at 0.4010. The logic is straightforward: parabolic moves retrace aggressively, and price is now below the level where the rally accelerated. The buyers who chased the top are trapped — and trapped longs fuel the next leg down.
Entry: 0.4010
Stop Loss: 0.4280 — above the consolidation zone and the last lower high
TP1: 0.3900 — the pre-rally support where price consolidated before the spike
TP2: 0.3600 — the full retracement target back to the base of the move
Exit strategy:
Partial exit at TP1, stop to breakeven. If the selloff continues, TP2 captures the full round trip back to where the rally started. That's the nature of parabolic moves — they tend to retrace 70-100% of the impulse.
R:R: ~1:0.4 to TP1, ~1:1.5 to TP2. The real edge is in the TP2 target — parabolic retracements have a strong tendency to fill the entire move.
Invalidation: Close above 0.4280 — that would mean buyers are defending and a new higher low is forming.
Signal fired. We took it. Update coming.
KAITO/USDT Near Key Resistance | Rejection Setup FormingKAITO/USDT is currently trading near a key resistance zone within a descending parallel channel.
Price action suggests weakness at resistance, increasing the probability of a downside move if the structure holds.
Trade Setup
BINANCE:KAITOUSDT | Short
Current price: 0.41
Target: 0.333
Potential downside: 20%
Structure invalidation: A move above 0.45 would invalidate the current setup.
Technical Context
• Price is moving inside a descending channel
• Repeated rejection near trendline resistance
• Lack of strength as price approaches upper boundary
Kaito has a lot to prove. KAITO is still trading within a broader downtrend, sitting below its descending trendline and short-term averages. Price has started to stabilize near recent lows, suggesting sellers are losing momentum rather than pressing lower.
The main area to watch is the highlighted horizontal level. This zone previously acted as support and has now flipped into resistance, lining up with a heavy volume area. A reclaim and hold above it would be the first sign of a potential relief move back into higher ranges.
Momentum has cooled even as price pushed lower, showing a clear loss of downside strength near oversold conditions. While this alone doesn’t signal a trend reversal, it does point to growing balance between buyers and sellers.
Key scenarios:
Hold above resistance - opens the door for a relief rally
Rejection - keeps the downtrend intact
Breakdown from the base - continuation into lower demand
KAITO is approaching a decision point. Let price confirm the next move before committing.
$KAITO - Bearish OutlookKAITO’s recent performance underscores the growing momentum in AI-driven blockchain projects, signaling robust market potential. The integration of advanced AI tools and increasing adoption are driving bullish sentiment. Similarly, Faith Protocol is carving a niche with its innovative yield farming, NFT offerings, and expanding DeFi ecosystem. Both projects exemplify the synergy of utility and community engagement in fueling growth.
KAITO has surged ~80% from its daily support at $1.04, propelled by over $170M in launchpad pledges and heightened anticipation for upcoming airdrop rewards. Key catalysts include record-breaking Launchpad presales, 31.99m tokens staked, ongoing airdrops for projects.
MARKET ANALYSIS:
On the 2-day chart, $KAITO is testing a critical diagonal resistance at $1.66 but faced strong rejection, indicating potential consolidation. Key support lies between $1.20–$1.06, a zone that has historically held firm. A breach below this could trigger a deeper correction toward $0.80 for a proper bottoming formation. Conversely, a decisive break above $1.66 may signal continuation toward higher resistance levels, with momentum supported by strong fundamentals and market interest.
KEY LEVELS:
Support: $1.20–$1.06 (critical), $0.80 (secondary)
Resistance: $1.66 (immediate)
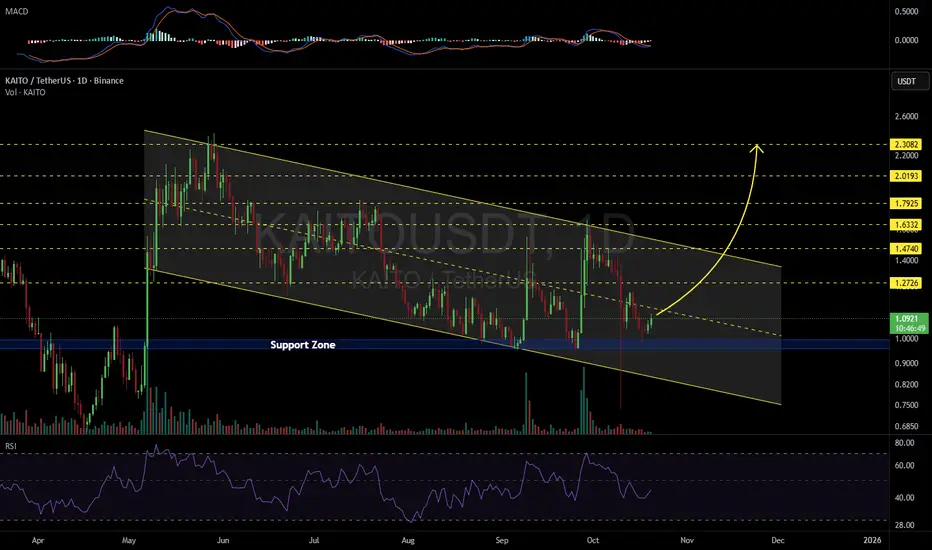
KAITOUSDT 1D#KAITO is moving inside a falling wedge pattern on the daily chart. Volume has increased and RSI and MACD are turning bullish. #KAITO is on the verge of breaking out. If that happens, the potential targets are:
🎯 $1.2726
🎯 $1.4740
🎯 $1.6332
🎯 $1.7925
🎯 $2.0193
🎯 $2.3082
⚠️ Always remember to use a tight stop-loss and follow proper risk management.
KAITO/USDT – Strong Structure + Community Trend LeaderKAITO continues to form a clean and technically sound structure. After a solid rebound from the ~$0.70 zone and several successful retests, we might be witnessing the beginning of a larger accumulation-to-expansion phase.
🔍 Technical Highlights:
Price is holding above the key support zone ($1.00–$1.05)
A higher low has formed, suggesting the market is preparing for a move
Potential breakout target lies in the $2.30–$2.50 region (previous imbalance and resistance)
📣 But KAITO is not just a chart play — it’s a trendsetter.
It has become one of the most discussed tokens among CT influencers on Twitter
The staking program constantly rewards active users with new airdrops
The project demonstrates clear team engagement, ongoing development, and growing brand visibility
🧠 From a fundamentals + price action view, KAITO is a rare combination of:
Real utility (community + staking + airdrops)
Technical strength
Social traction
🎯 If momentum sustains, $2.5 is not just possible it's logical.
KAITO/USDT | Low-Risk Setup with 125%+ Upside Potential🚀 Trade Setup Details:
🕯 #KAITO/USDT 🔼 Buy | Long 🔼
⌛️ TimeFrame: 1D
--------------------
🛡 Risk Management (Example):
🛡 Based on $10,000 Balance
🛡 Loss-Limit: 1% (Conservative)
🛡 The Signal Margin: $634.52
--------------------
☄️ En1: 1.2173 (Amount: $63.45)
☄️ En2: 1.149 (Amount: $222.08)
☄️ En3: 1.1027 (Amount: $285.53)
☄️ En4: 1.0583 (Amount: $63.45)
--------------------
☄️ If All Entries Are Activated, Then:
☄️ Average.En: 1.1257 ($634.52)
--------------------
☑️ TP1: 1.4002 (+24.38%) (RR:1.55)
☑️ TP2: 1.5549 (+38.13%) (RR:2.42)
☑️ TP3: 1.7764 (+57.8%) (RR:3.67)
☑️ TP4: 2.1042 (+86.92%) (RR:5.52)
☑️ TP5: 2.537 (+125.37%) (RR:7.95)
☑️ TP6: Open 🔝
--------------------
❌ SL: 0.9483 (-15.76%) (-$100)
--------------------
💯 Maximum.Lev: 3X
⌛️ Trading Type: Swing Trading
‼️ Signal Risk: 🙂 Low-Risk! 🙂
--------------------
🔗 www.tradingview.com
❤️ Your Like & Comments are valuable to us ❤️