KASUSD Multi Collateral Perpetual Futures Contract
No trades
No trades
Open interest
Open interest
Price
Liquidations
Long
Short
Price
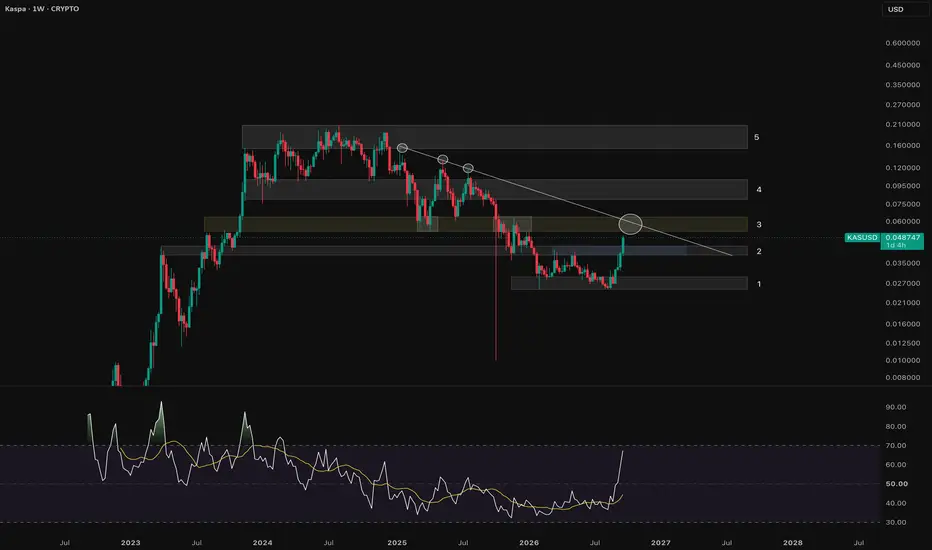
KAS: 5 Key Levels I’m Watching1 — ~$0.025–$0.030: Major support / accumulation area
This is the bottom gray box.
KAS spent quite a bit of time consolidating here after the decline. Price repeatedly held roughly $0.026–$0.028, and the recent rally appears to have launched from this area.
The implication is that Zone 1 is the cur
$KAS , Cycle Structure & Asymmetric Paths IdeaKAS is currently sitting inside a long-term accumulation range after the 2024 cycle high.
The immediate structure points to the $0.15–$0.22 liquidity zone as the first major upside objective. From the current area, that represents roughly +426%.
There are two main possibilities from here:
Path 1:
KAS | May, 2026 | The time to go long has come- Timeframe: Weekly
- Trade type: Buy stop order
- Price: 0.035723
- Take Profit: Open
- Stop Loss: 0.032415 (-9.20 %)
Idea: Long on a breakout above last week's high — bullish momentum continuation.
Entry: Buy stop above last week’s high.
Stop-loss: Below the low of the same candle.
If the weekly
Kaspa holding $0.033 support as traders eye breakout this weekCurrent Price: 0.03321
Direction: LONG
Confidence level: 62%(X sentiment leans bullish with multiple buy signals and price sits directly on repeatedly referenced $0.033 support while upgrade narrative builds, though lack of YouTube trader data reduces conviction.)
Targets
Target 1: 0.0345
Target
Kaspa KAS/USD have now flipped bullish on 4hrly.Kaspa KAS/USD have now flipped bullish on 4hrly, and is now sitting above the red 21 EMA, with a bullish cross of the red 21 EMA now back above the green 50 SMA line; after it had turned bearish on the 23rd March.
The FG histogram had also turned green and has flipped positive as well on the 4hrly.
KAS: Cycle in the Build-upAfter its cycle from mid-2023 to its ATH in mid-2024, #Kaspa has been in a corrective phase. Still lacking bullish strength, the correction continues.
Breaking $0.028 leads to new lows while passing $0.042 invalidates this view. On the HTF, passing $0.131 targets a new ATH.
Kaspa Signals Bullish Continuation After Complex CorrectionKaspa rebounds from 0.04 support after a WXY correction, signaling a potential bullish move toward 0.09–0.10 if 0.05 resistance breaks.
Kaspa (KASUSD) is showing a constructive rebound on the daily chart following a completed complex WXY correction within wave B/2. After revisiting the key suppor
See all ideas
Summarizing what the indicators are suggesting.
Oscillators
Neutral
Oscillators
Neutral
Summary
Neutral
Summary
Neutral
Summary
Neutral
Moving Averages
Neutral
Moving Averages
Neutral
Displays a symbol's price movements over previous years to identify recurring trends.