In-depth trading ideas
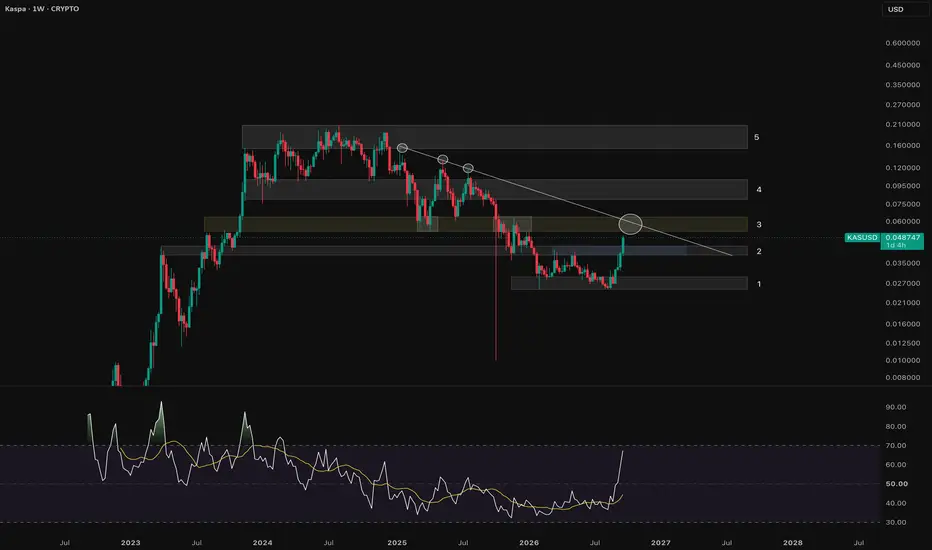
KAS: 5 Key Levels I’m Watching1 — ~$0.025–$0.030: Major support / accumulation area
This is the bottom gray box.
KAS spent quite a bit of time consolidating here after the decline. Price repeatedly held roughly $0.026–$0.028, and the recent rally appears to have launched from this area.
The implication is that Zone 1 is the current structural floor. If this rally completely fails, this is the major area you'd watch for buyers to step back in.
2 — ~$0.039–$0.045: First resistance — now being broken
This is particularly im
$KAS , Cycle Structure & Asymmetric Paths IdeaKAS is currently sitting inside a long-term accumulation range after the 2024 cycle high.
The immediate structure points to the $0.15–$0.22 liquidity zone as the first major upside objective. From the current area, that represents roughly +426%.
There are two main possibilities from here:
Path 1: The current accumulation develops into a new cycle expansion, with $0.15–$0.22 as the first major target.
Path 2: The current range fails and price searches for the lower liquidity around $0.0011–$0
KAS | May, 2026 | The time to go long has come- Timeframe: Weekly
- Trade type: Buy stop order
- Price: 0.035723
- Take Profit: Open
- Stop Loss: 0.032415 (-9.20 %)
Idea: Long on a breakout above last week's high — bullish momentum continuation.
Entry: Buy stop above last week’s high.
Stop-loss: Below the low of the same candle.
If the weekly candle closes below this level, the trade is invalidated.
Take Profit: Trailing stop following the lows of new weekly candles.
Feel free to like and share your thoughts in the comments.
Kaspa holding $0.033 support as traders eye breakout this weekCurrent Price: 0.03321
Direction: LONG
Confidence level: 62%(X sentiment leans bullish with multiple buy signals and price sits directly on repeatedly referenced $0.033 support while upgrade narrative builds, though lack of YouTube trader data reduces conviction.)
Targets
Target 1: 0.0345
Target 2: 0.0358
Stop Levels
Stop 1: 0.0330
Stop 2: 0.0319
Wisdom of Professional Traders:
This analysis synthesizes insights from thousands of professional traders and market experts, combining what tra
Kaspa KAS/USD have now flipped bullish on 4hrly.Kaspa KAS/USD have now flipped bullish on 4hrly, and is now sitting above the red 21 EMA, with a bullish cross of the red 21 EMA now back above the green 50 SMA line; after it had turned bearish on the 23rd March.
The FG histogram had also turned green and has flipped positive as well on the 4hrly.
However for Kaspa to confirm a longer term bullish trend, it will need to break out above the orange 200 SMA line as well; which it had got rejected on the 8thApr.
KAS: Cycle in the Build-upAfter its cycle from mid-2023 to its ATH in mid-2024, #Kaspa has been in a corrective phase. Still lacking bullish strength, the correction continues.
Breaking $0.028 leads to new lows while passing $0.042 invalidates this view. On the HTF, passing $0.131 targets a new ATH.
Kaspa Signals Bullish Continuation After Complex CorrectionKaspa rebounds from 0.04 support after a WXY correction, signaling a potential bullish move toward 0.09–0.10 if 0.05 resistance breaks.
Kaspa (KASUSD) is showing a constructive rebound on the daily chart following a completed complex WXY correction within wave B/2. After revisiting the key support zone around 0.04, price action suggests that a new impulsive phase—either wave C or wave 3—is now underway.
A sustained move above the 0.05 bullish confirmation level, combined with a breakout from
KASPA Is Compressing Into a Macro Coil — Big Move Approaching?📉➡️📈 KASPA Weekly Falling Wedge – Compression Before a Larger Move
_______________________________________________________________________________
KASPA (KASUSD) – Weekly Falling Wedge Analysis
Kaspa has been forming a large falling wedge on the weekly timeframe, a structure often associated with decreasing selling pressure and potential bullish reversal setups. The trendlines have held for months, and price continues to compress as it approaches the apex of the pattern. Confidence is medium at
Kaspa Completes A Correction After A Huge SpikeKaspa Completes A Correction After A Huge Spike that can be supportive, as we see a corrective structure within the uptrend by Elliott wave theory.
Kaspa is a proof-of-work (PoW) cryptocurrency that uses the novel GHOSTDAG protocol (a block-DAG consensus rather than a single linear chain) to allow many blocks to be produced more rapidly and co-exist. It was launched without an ICO / pre-mine (fair launch) and positions itself as more scalable than many PoW chains. Because of this, it has attr
Kaspa (KAS) Price Prediction – Stuck Between $0.085 and $0.10 KAS is stuck in a sideways grind just above its 200-day SMA. $0.10 remains the wall to beat — can bulls break through or will $0.085 give way first?
Kaspa (KAS) price remains trapped in a tight range, holding just above the 200-day SMA...
Kaspa (KAS) price remains trapped in a tight range, holding just above the 200-day SMA but repeatedly failing to clear the $0.10–$0.105 resistance zone. Since peaking at $0.118 in July, KAS has been stuck between key support and resistance levels, now trading
KAS - world of pain incomingKAS slowly loosing momentum. It kept breaking supports and then pushed higher but each push higher had less and less slope (aka power). We once again broke support which is almost horizontal, tried to climb back above it but were rejected. Trend has reversed and now we start sloping supports downward. Once we loose fibb 0.236 horizontal support I expect move down to speed up (like OM did). Have no interests in it till we hit fibb 0.886 range...
Kaspa 2025 possible peak PA projectionsKaspa price action has been a heated subject over the last 12 or so months and now that we are getting closer to the end of this 4 year cycle we need to delve into possible scenarios. With all the great future points coming for kaspa it is hard not to see this asset climb within the 6 months that we have until the end of year for 2025. Kaspa is about to roll out smart contracts, tier 1 exchanges like Binance, Coinbase, OKX, Robinhood and a few tier 2's for listings, stabel tokens like USDC and U
Kaspa - game over?Weekly TF
Chart inverted
Looking at this chart - what would you do here? Kaspa has been unable to exceed the $0.19 - 0.20 high. And has broken below 2 x key trend lines.
I seem to be missing some historical data on this chart but if we use the lowest price point and use a fibbonahi retracement tool, the 0.5 puts is roughly $0.010 - 0.012. Equal to a 80-90% drop.
If KAS sees continuation to the downside I believe this is where price could head next 📉
This coin had a good run for c.700 days, f
KASUSD is heating up the engine!About KASUSD:
1. Both RSI and MACD indicate a breakout, with MACD showing a divergence.
2. The price has reached the historical trendline.
3. According to the Elliott Wave theory, the price appears to be in a corrective phase, potentially reaching around the 61% retracement level (approximately $0.08). This price can be a good level for entry.
Kaspa on Its Path to Glory (TA + Trading Plan) + UPDATETechnical Analysis for KASPA (KAS)
Current Price: 0.11268 USD
Timeframe: 4-Hour Chart
Indicators and Key Observations:
Price Action: Kaspa is currently in an ascending triangle pattern, with price action approaching the resistance line, which has been tested multiple times without a clear break. This pattern indicates the possibility of a breakout if the price moves above the resistance line.
Support Zone: The support level has been consistent, forming a base near 0.1070 USD. This is a crucia