KAS / KASUSDT Long Setup | Breaker Block ReclaimMARKET ANALYSIS
KAS is currently reacting from a key technical area highlighted on the chart.
As long as the protected support zone remains intact, the bullish market structure remains valid and higher liquidity targets may continue to attract price action.
A breakdown below the invalidation level would weaken the current bullish scenario and require a reassessment of market conditions.
📍 Entry, Stop Loss and Take Profit levels are marked directly on the chart.
━━━━━━━━━━━━━━
⚠️ DISCLAIMER
This publication is provided solely for educational and market observation purposes.
Nothing contained in this analysis should be considered financial advice, investment advice, or a recommendation to buy or sell any financial instrument.
All trading and investment decisions remain solely the responsibility of the individual trader.
Always conduct your own research and apply proper risk management before entering any position.
━━━━━━━━━━━━━━
🎯 PARALOG
▪️Crypto Market Analysis
▪️BTC Futures Signals
▪️Bitcoin & Altcoin Market Analysis
Precision • Momentum • Timing
━━━━━━━━━━━━━━
Exchange: #MEXC Futures
#bitcoin #btc #crypto #futures #technicalanalysis
In-depth trading ideas
$KAS is trading around $0.0299, and most traders are watching...MEXC:KASUSDT is trading around $0.0299, and most traders are watching $0.0305.
The crowd is focused on the target, but the only level that matters right now is $0.0295.
📰 24H NEWS SNAPSHOT
No major Kaspa ecosystem announcement, whale transaction, or on-chain catalyst has emerged over the past 24 hours. Price action remains the primary signal, with the setup driven by technical structure rather than news.
For official ecosystem updates, follow @KaspaCurrency.
📊 MARKET BIAS
🟢 Bullish — Price continues to respect its bullish market structure and is pulling back into a high-probability demand zone.
🎯 TRADE LEVELS
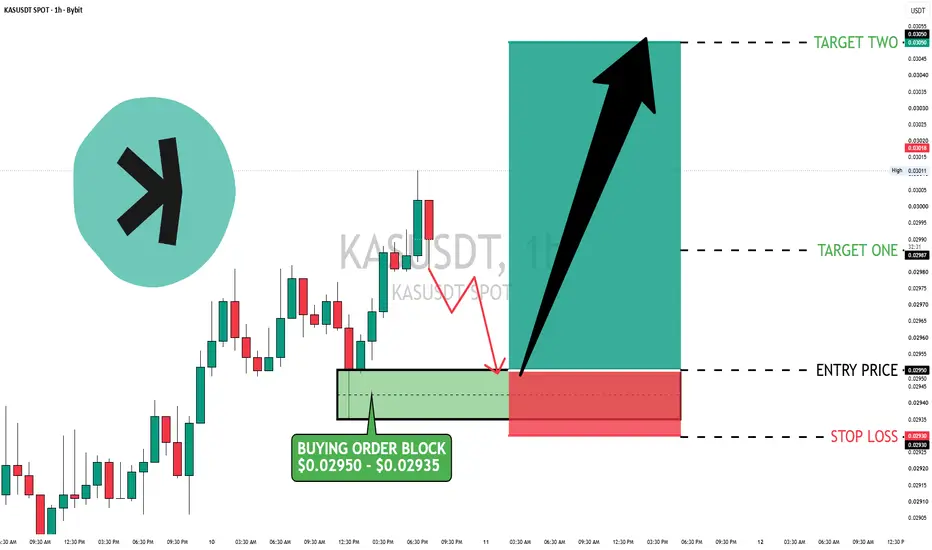
📍 Entry Zone: $0.02950 – $0.02935
🛑 Stop Loss: $0.02930
Loss: -0.68%
Portfolio Risk: Risk 1% or less per trade.
🎯 TP1: $0.02987
+1.25%
1.84:1 RR
🎯 TP2: $0.03050
+3.39%
5.00:1 RR
🎯 TP3: Trail above $0.03050 if price closes above resistance with strong volume.
📐 Overall R:R: ≈5:1
🧠 CHART ANALYSIS
The 1H chart shows a clean bullish impulse followed by a controlled retracement into a buy-side order block between $0.02950–$0.02935.
This zone previously acted as the origin of the latest expansion, making it a logical area for buyers to defend.
As long as $0.02930 holds, the bullish structure remains valid. A strong reaction from the order block could send price toward $0.02987, with $0.03050 as the next upside objective.
A 1H close below $0.02930 would invalidate the setup.
🛡️ RISK MANAGEMENT TIP
Avoid chasing green candles. Let price revisit the order block and wait for bullish confirmation before entering. Always size your position so a stopped-out trade costs no more than 1% of your portfolio.
📚 EDUCATIONAL NUGGET
One of the biggest mistakes newer traders make is buying after momentum has already expanded. Professional traders often wait for the order block retest, where downside risk is clearly defined and the reward-to-risk ratio is significantly better.
Remember the opening?
The next move isn't decided at $0.0305—it starts at $0.0295.
The chart has already revealed where buyers are most likely to step in. Don't ignore the level that matters most.
💬 Would you set a limit order at $0.0295 or wait for a bullish confirmation candle? Share your strategy below.
#Kaspa #KAS #CryptoTrading #TechnicalAnalysis #CryptoSignals #PriceAction #Altcoins #Crypto
KAS USDT LONG SIGNAL#40. KAS/USDT – Trade Setup (LONG)
📈 Position Type: LONG
🕒 Timeframe: 1 H
📊 Market: Futures
💰 Entry Zone:
0.02981
0.02934
🛑 Stop-Loss:
0.02895
🎯 Take-Profit Targets:
• TP1: 0.03030
• TP2: 0.03084
• TP3: 0.03155
• TP4:
TP5:
TP6:
⚙️ Leverage:
5- 10
⚠️ After reaching TP1, move Stop-Loss to Entry Price.
📌 Risk Management:
Risk only 1–2% of your capital per trade.
Always confirm the setup on your chart before entry
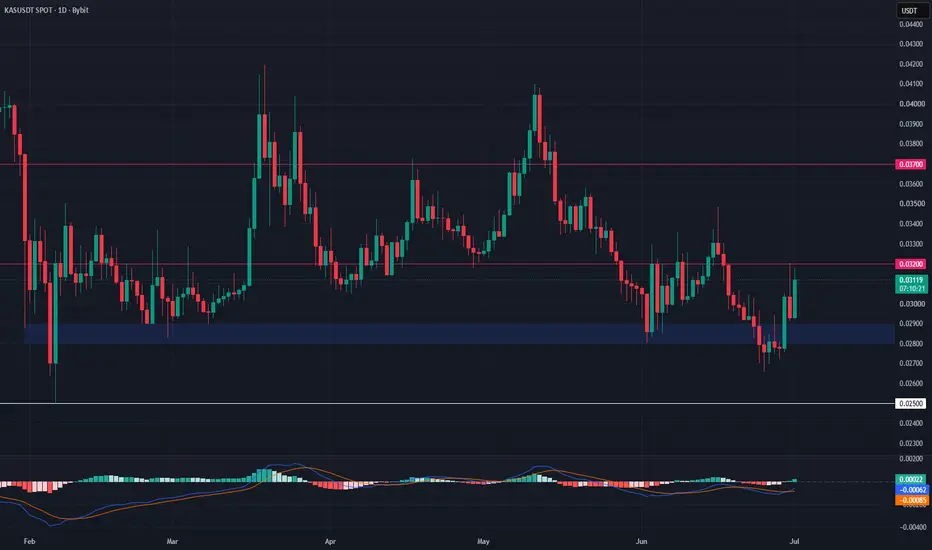
KAS: range coil toward the $0.032 capThe Macro Picture 🗺️
KAS corrected steadily from its $0.044 May peak, but that downtrend has flattened into a base. Since June, price has carved a range between the $0.027 macro floor and the $0.032 local cap, coiling around the $0.0295 equilibrium. RSI hovers near neutral, confirming the market has moved from trend to balance. After an orderly decline, this kind of horizontal compression above a defended floor is the accumulation phase — rotation between the boundaries is the base case until one edge breaks.
The Setup ⚙️
The Floor: The $0.027 macro support (solid green) absorbed the June sell-off and has held every retest since, stacking with the $0.028 local low to form a high-confluence demand shelf. This is the line bulls keep defending to preserve the base.
The Ceiling: The $0.032 local decision (red dashed) caps every bounce. A decisive daily close above it would break the range and put the heavier $0.038 supply band back in view.
The Range Play: The $0.028–$0.0295 band creates a structural playground for grid-based accumulation — mechanical entries stacked across the range while price coils, no directional call required until the break confirms.
The Roadmap: Primary target sits at $0.032 — the green roadmap points toward a rotation to the range ceiling as buyers hold the floor. Invalidation: a sustained 1D close below $0.027 would break the base and reopen the downtrend toward fresh lows.
More setups in profile.
KAS Holding Support — Watching for ContinuationKAS is showing strong relative strength and continues to hold above its key support zone.
A successful retest of this level could offer a solid entry opportunity for a potential move toward the next major resistance area.
For now, the plan is to wait for confirmation that support is holding instead of chasing the move too early.
Trade Levels:
Entry Zone: $0.028 – $0.029
Take Profit Targets: $0.032, $0.037
Stop Loss: $0.025
KASUSD is starting to look interestingCSE:KAS is starting to look interesting.
After several failed attempts, buyers are finally defending the trendline, and that's the first bullish sign I've been waiting for.
Now the price is pushing into the 0.0290–0.0300 resistance zone. This is where the market will decide whether this move has real strength or not.I'm not chasing this pump. I'd rather wait for confirmation than buy into FOMO.
Here's what I need before opening a long:
✅ Price holds above the trendline after any pullback.
✅ The 0.0286–0.0292 area flips into support.
✅ A strong 4H bullish candle closes above 0.0300.
✅ After the breakout, price stays above support and doesn't close back below it on the 4H chart.
If these conditions are met, I'll be much more confident that KAS is ready for the next leg higher.
KAS/USDT - Bear Flag, Breakdown or Major Rebound Ahead?On the 1D timeframe, KAS/USDT is currently trading within a well-defined Bear Flag structure following a sharp decline. 📉
This pattern has developed through a consolidation phase inside an ascending channel (flag) that moves against the primary bearish trend.
At the moment, price is testing a critical support area around 0.0285 USDT, which represents the lower boundary of the flag structure and a level that has previously acted as a strong reaction zone. 🎯
From a technical perspective, as long as price remains below the channel resistance and fails to establish a new Higher High (HH), bearish pressure continues to dominate the market structure. 🐻
---
🐻 Bear Flag Pattern Overview
A Bear Flag is a bearish continuation pattern consisting of:
📉 Flagpole
A strong and aggressive sell-off that forms the initial downward move.
📈 Flag
A temporary corrective phase where price moves gradually higher within an ascending channel.
⚠️ Breakdown
Bearish confirmation occurs when price breaks below the lower support of the channel and closes below it on the daily timeframe.
🎯 Downside targets are typically calculated by projecting the length of the flagpole from the breakdown point.
---
🐂 Bullish Scenario
The bullish case remains valid if the major support level continues to hold. 💪
✅ Bullish Confirmation:
✔️ Price holds above 0.0285 USDT
✔️ Strong buyer reaction emerges from support
✔️ Breakout above the internal resistance trendline (red trendline)
✔️ Increasing buying volume 📊
🎯 Bullish Targets:
🚀 0.0320 USDT
🚀 0.0345 USDT (Mid-Channel)
🚀 0.0380 USDT
🚀 0.0400 – 0.0420 USDT (Upper Channel Resistance)
As long as support remains intact, a rebound toward the upper boundary of the channel remains possible. 📈
---
🐻 Bearish Scenario
The primary outlook remains bearish since the overall structure is still a Bear Flag. ⚠️
❌ Bearish Confirmation:
🔻 Breakdown below 0.0285 USDT support
🔻 Daily candle closes beneath support
🔻 Selling volume increases during the breakdown 📉
🎯 Bearish Targets:
🎯 0.0272 USDT (Minor Support)
🎯 0.0249 USDT (Highlighted Target Zone)
🎯 0.0228 – 0.0230 USDT if selling pressure accelerates
A confirmed breakdown below the lower boundary of the channel could activate the full Bear Flag target and continue the broader downtrend. 📉🐻
---
🔍 Conclusion
KAS/USDT is currently trading at a critical decision point. ⚡
The Bear Flag structure remains valid and continues to favor sellers as long as price cannot break out of the ascending channel and reclaim key resistance levels.
📍 The 0.0285 USDT area is the most important level to watch.
🟢 A strong rebound from this zone could trigger a short-term recovery.
🔴 However, if support fails, the probability of a decline toward 0.0249 USDT and potentially lower levels will increase significantly.
At this stage, the market is waiting for confirmation, making price action around support the key factor for the next major move. 📊
---
📌 Key Levels
🟢 Resistance:
• 0.0320 USDT
• 0.0345 USDT
• 0.0380 USDT
• 0.0400 – 0.0420 USDT
🔴 Support:
• 0.0285 USDT
• 0.0272 USDT
• 0.0249 USDT
• 0.0228 USDT
---
#KASUSDT #KASPA #Crypto #Cryptocurrency #TechnicalAnalysis #TradingView #BearFlag #BearishPattern #PriceAction #SupportResistance #Altcoin #KuCoin #CryptoTrading #SwingTrading #Breakdown #BullishScenario #BearishScenario #ChartAnalysis #MarketStructure #CryptoMarket
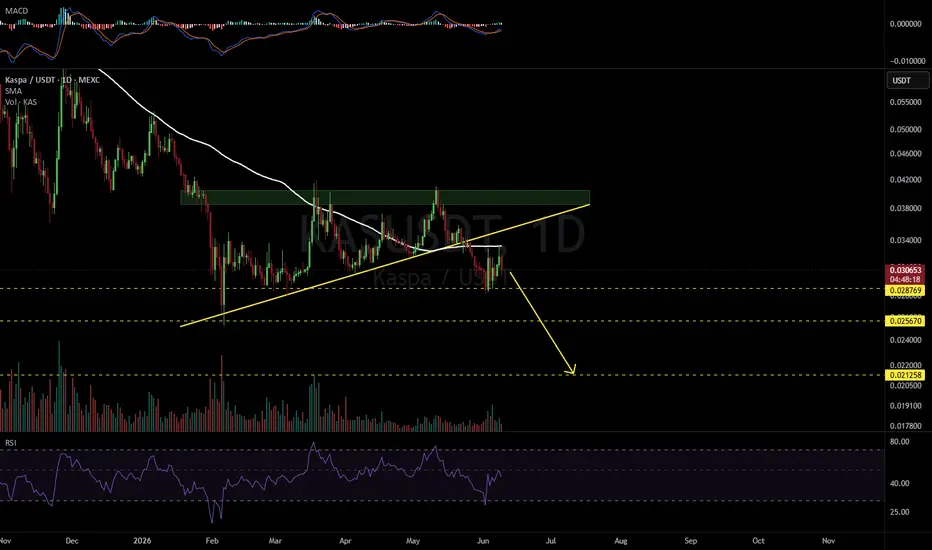
KASUSDT 1DAs long as #KAS remains below the broken ascending triangle support and the 100-day SMA, bears remain in control.
Downside targets:
🎯 $0.028769
🎯 $0.025670
🎯 $0.021258
A reclaim of the triangle support would invalidate this bearish scenario.
⚠️ Always remember to use a tight stop-loss and maintain proper risk management.
KASPA - Accumulation Zone, Major Reversal or Further Breakdown?On the 1-Week (1W) timeframe, KASPA is currently undergoing a prolonged correction after experiencing a powerful bullish trend throughout 2023 and into mid-2024. Price has declined by more than 80% from its peak and is now revisiting a critical historical demand zone. ⚠️
🟨 The $0.0180 – $0.0125 area previously served as the accumulation base before KAS launched its massive rally toward its All-Time High.
From a technical perspective, this zone is highly attractive as it may represent a potential accumulation area for institutions and smart money participants. 🏦💰
---
🟨 Major Demand Zone
📍 Historical Support:
🔸 $0.0180
🔸 $0.0125
This zone represents:
✅ The major breakout area from 2023
✅ Former resistance that turned into support
✅ A zone with significant historical price reactions
✅ A valid weekly demand area
✅ An attractive long-term accumulation zone
As long as this area remains intact, the possibility of forming a long-term bottom remains open. 📈
---
📐 Pattern Currently Developing
🔻 Falling Wedge / Long-Term Compression
Structurally, KAS appears to be forming a:
🔻 Large Falling Wedge
Key characteristics:
📉 Lower highs have been forming since the ATH
📉 Selling pressure is gradually weakening
📉 Volatility continues to contract
📉 Price is approaching a strong historical support zone
A Falling Wedge is widely considered a bullish reversal pattern when a breakout occurs above the descending trendline, accompanied by increasing volume. 🚀
In addition, the current structure also suggests a:
🏦 Re-Accumulation Phase
This phase typically includes:
1️⃣ Retail investor capitulation
2️⃣ Distribution phase completion
3️⃣ Smart money beginning to accumulate at discounted prices
This is often the stage that precedes the beginning of a new bullish cycle. 📈
---
🟢 Bullish Scenario
✅ Key Requirement:
🟩 The $0.0180 – $0.0125 zone must hold as support.
If this support remains intact, the potential upside targets are:
🎯 Target 1: $0.0500
🎯 Target 2: $0.0800
🎯 Target 3: $0.1200
🎯 Target 4: $0.1800 – $0.2100
Ideal bullish confirmations:
✅ Break of the weekly lower-high structure
✅ Weekly close above major resistance
✅ Increased volume during breakout
✅ Formation of a new higher low
🚀 If this scenario unfolds, the current zone could offer one of the most attractive risk-to-reward opportunities for the next market cycle.
---
🔴 Bearish Scenario
⚠️ Risks to Monitor:
If price loses:
❌ $0.0180
and especially
❌ $0.0125
then the long-term bullish structure would begin to weaken significantly.
Potential downside targets:
📉 $0.0100
📉 $0.0080
📉 $0.0050
A breakdown below this historical demand zone would indicate that sellers remain in control and that the market may require more time to establish a new long-term bottom. 🐻
---
🎯 Conclusion
📌 KASPA is currently trading at one of the most important technical zones since the beginning of its major bullish trend.
🟨 The $0.0180 – $0.0125 region serves as both a historical support area and a potential long-term accumulation zone.
🚀 As long as this support remains intact, the probability of a major reversal remains on the table.
⚠️ However, if the zone is broken decisively, traders should be prepared for further downside risk.
At this stage, KAS stands at a critical crossroads between:
🟢 Continuing its accumulation phase toward a new bullish cycle
or
🔴 Losing a key support level that has sustained the market structure for more than two years.
#KAS #KASPA #KASUSDT #Crypto 🚀 #Cryptocurrency #Altcoin #TechnicalAnalysis #TradingView #PriceAction #MarketStructure #SupportAndResistance #Accumulation #SmartMoney #FallingWedge #BullishReversal #CryptoTrading #AltcoinSeason #Investing #ChartAnalysis #WeeklyChart #CryptoMarket #LongTermInvestment #TrendReversal #RiskReward #CryptoAnalysis 📈
Kaspa LONG opportunity with low lev (PP: 1,300-1,500%)Here is a very strong chart setup for a LONG trade, KASUSDT. This setup can be approached with 4-5X leverage aiming to hit a very nice 1,300% to 1,500% profits potential. This would be a mild wave with a time window of three months.
I will give you just one signal to support a bullish wave on this chart setup. Bitcoin is crashing and Kaspa remains sideways with zero change, not even a shakeout on the chart. This shows that all sellers on KASUSDT are gone. With sellers gone, it is only a matter of time before buyers show up.
If KASUSDT can remain absolutely stable, peaceful, quiet as Bitcoin challenges support, what will happen when Bitcoin reverses its course? A major bullish cycle.
Thanks a lot for your continued support.
Namaste.
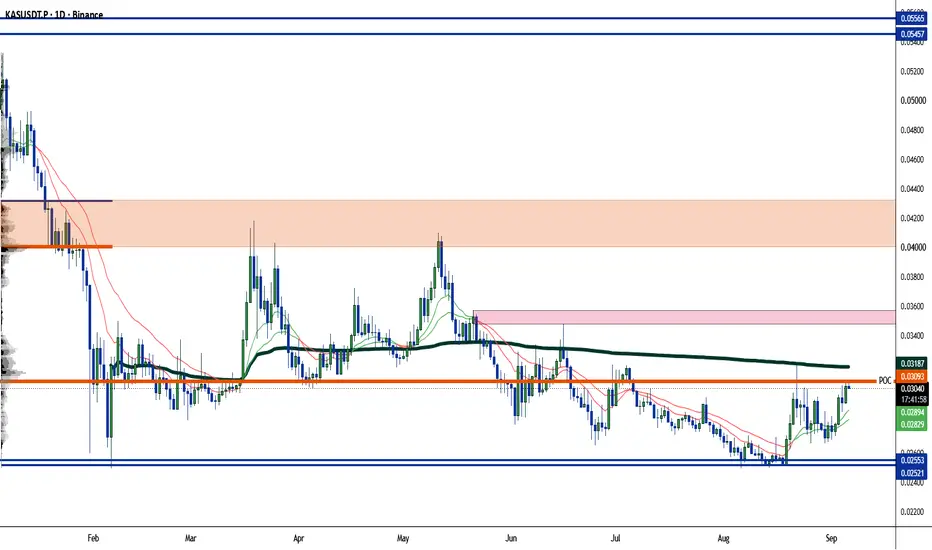
Kaspa is hitting a bottom.... can it change its market structureKaspa is showing early signs of a potential reversal after months of downside pressure. Price continues holding a key support zone while building a base near the lows.
The main level to watch is the local range high. A clean break above this area would confirm a Change of Character (CHoCH) and signal the first meaningful bullish shift in structure.
Key observations:
• Support continues to hold despite repeated tests.
• Selling momentum appears to be fading.
• Volume profile shows lighter resistance above current price.
• A breakout could target the next major resistance zone near $0.057.
Bulls still need confirmation. Until resistance is reclaimed, Kaspa remains range-bound and vulnerable to another liquidity sweep. That said, this is one of the more interesting accumulation-style setups developing in the market right now.
Is CSE:KAS building a long-term bottom, or is this just another pause before the next move lower?
Kaspa active within bottom accumulation rangeThe same pattern and the same chart we've seen on hundreds of projects... KASUSDT is no different. What happens next should also be the same.
Kaspa has been moving sideways almost four months and this is creating an interesting chart setup. I should say, active within the opportunity buy-zone.
I am using the linear chart to better grasp the actual state of this trading pair.
Notice the size of the candles as the market reaches a major high followed by a correction. As the bearish period losses momentum, the candles become smaller and smaller. By the time the bearish impulse ends, we have very small candles with a lack of new lows, sideways instead.
From this bottom, KASUSDT can grow.
This chart setup is interesting. Can be approached with leverage. Spot is extremely easy.
Some things to consider: We are likely looking at true bottom prices which makes the current situation highly desirable. Entries now can be held long-term and I am talking about years. A leveraged position should ignore low targets while aiming high... The market offers endless opportunities but this type of setup doesn't repeat very often.
Right now we have this situation with many projects trading at the bottom but you know how that works. Once the bottom is gone, it is gone forever. While it is active, it tends to remain active for a long while as it is happening now.
Good chart, good opportunity, great growth potential, good project. The market will take care of the rest.
Thank you for reading.
Namaste.
$KAS Still Respecting HTF Demand And Rising Trendline CSE:KAS Still Respecting HTF Demand And Rising Trendline ⚡️
KAS continues holding the 0.030 –0.034 demand zone while respecting the rising HTF trendline that has supported price since February. The recent pullback into support looked more like a liquidity sweep than real bearish continuation, with buyers stepping back in quickly after every deeper dip. Current structure still favors gradual accumulation as long as the market keeps holding above the reclaimed support cluster.
The chart also shows repeated higher lows forming around the trendline, which usually signals strengthening demand rather than weakness. Momentum cooled after the recent rejection near 0.040, but sellers still failed to break the major support zone cleanly. For the SAFE MODEL setup, the best longs still come after a sweep into demand followed by bullish reclaim, displacement, RSI MA strength, and strong hold above the trendline before continuation toward 0.037–0.040 liquidity zones.
Analysis by Leo524.
#KAS #KASUSDT #Crypto #Leo524
KAS Breaking Out of Long-Term Downtrend StructureKAS is showing strong momentum after respecting the lower trendline of the macro descending channel and pushing upward into key resistance.
Price has now reclaimed the short-term ascending support and is attempting to break above the major descending trendline that has controlled the market for months.
What’s happening:
Higher lows continue to form
Bullish pressure increasing near resistance
Price testing the key breakout zone around 0.036 – 0.039
Bullish scenario:
A confirmed breakout and hold above the descending resistance could trigger a strong expansion toward 0.045, followed by a potential move into the 0.06+ region.
Bearish scenario:
If price gets rejected from this resistance zone, a pullback toward 0.033 – 0.030 support is possible before another breakout attempt.
Right now, KAS is sitting at a major decision point, and the structure is starting to shift bullish after months of downtrend compression.
KASUSDT - Completed Bearish Shark Pattern + Sharp RejectionTechnical Analysis:
A clean Bearish Shark Harmonic Pattern has completed on the 1H timeframe.
Pattern points: X → A → B → C → D
Strong rejection from point D
Price is already breaking down sharply after the pattern completion (classic Shark behavior — aggressive counter-trend move)
The structure respected key Fibonacci ratios typical for the Shark (88.6% & 113% zones). Momentum is currently favoring the downside.
Current Price: ~0.03386
Bias: Short-term Bearish
Potential Targets: 0.0320 – 0.0315 zone first, then possibly lower if selling pressure continues.
Invalidation: Strong reclaim above point D (~0.0344) with volume.
Fundamental / News Catalyst:
Kaspa is approaching one of its biggest upgrades — the Toccata Hard Fork (expected mainnet activation window: June 5–20, 2026).
Key features:
Native smart contracts & covenants (SilverScript)
KRC-20 tokens at base layer
ZK verification support
Transition toward a fully programmable Layer-1
Additionally, ~95%+ of total KAS supply is already in circulation, with emissions approaching zero by late 2026 → strong scarcity narrative ahead.
KAS/USDT - Descending Trendline: Breakout or Further Downside?On the 1D timeframe, KAS/USDT is still clearly in a downtrend since its previous peak. This is confirmed by the descending trendline (yellow line) acting as dynamic resistance.
Currently, price is consolidating right below this trendline, signaling a critical decision zone between a potential breakout or another rejection.
---
📉 Structure & Pattern
🔻 Main Pattern: Descending Trendline / Bearish Structure
Price is forming lower highs & lower lows → classic downtrend structure.
The trendline acts as a dynamic resistance tested multiple times.
A small consolidation / mini pennant is forming near resistance.
🔍 Pattern Insight:
As long as price stays below the trendline → bearish pressure remains dominant.
The more times resistance is tested → the higher the probability of a breakout (weakening resistance).
---
🔑 Key Levels
Nearest Resistance:
0.0365
0.0396
Major Resistance (Breakout Targets):
0.0485 – 0.0515
Key Support:
0.0310
0.0280
0.0250 (low area)
---
🚀 Bullish Scenario
Main confirmation: Breakout of trendline + close above 0.0365
If price:
Breaks and holds above the trendline
Supported by increasing volume
Potential targets:
Target 1 → 0.0396
Target 2 → 0.0485
Target 3 → 0.0515
Insight: This breakout could signal an early trend reversal from bearish to bullish.
---
📉 Bearish Scenario
If price fails to break the trendline and gets rejected
Possible outcome:
Price moves back down to lower support
Continues forming lower lows
Downside targets:
0.0310
0.0280
Extreme → 0.0250
Warning: As long as there is no valid breakout, the market remains under seller control.
---
⚖️ Conclusion
The market is currently in a critical decision zone.
Breakout = potential bullish reversal.
Rejection = continuation of the downtrend.
📌 This is a wait & confirm phase, not an aggressive entry zone without confirmation.
#KASUSDT #CryptoAnalysis #TechnicalAnalysis #Altcoins #CryptoTrading #BreakoutSetup #BearishTrend #BullishReversal #SupportResistance #Trendline #PriceAction
Kaspa: A ~300% bullish wave can happen easilyKaspa's all-time high happened July 2024. The orthodox end of the bear market happened April 2025. The lower low ending February 2026 looks like an ending diagonal. This phase can be considered the transition period. A period where the market wasn't bullish nor sideways but neither strongly bearish. A new bullish phase can start now.
Trading volume has been dropping since December 2024. Around this date the bearish cycle started to unfold in all its glory. After more than a year of bearish action, this cycle is dying down or already died out. The market is bullish now.
Change is already present on this chart. The stochastic hit bottom and is now curving up with full momentum. The RSI hit bottom November 2025 and has been recovering, now rising with a perfect up-line. The MACD hit bottom March 2025 and as it rises, it just produced a bullish cross. All these signals support a bullish cycle. Kaspa is going up.
Two targets are shown on the chart and these are active mid-term: $0.095 (160%) and $0.138 (278%). You can go LONG now on this trading pair. Crypto is going up.
Namaste.
Kaspa (KAS): Approaching Zone of Decision | Good Trade FormingKAS is approaching the zone of decision, where the moment of truth will unfold. Either we see buy-side dominance and a proper MSB form, or we break down and get a good downside move from there.
Until then, we wait for price to reach this zone and give us more clarity. A good trade is coming — all we need is a clean MSB or a breakdown.
Swallow Academy
Kaspa (KAS): If Buyers Don't Secure This Zone We Are DoomedKAS pulled back into the last support zone we marked, and this is the spot where buyers need to take back dominance. The reaction isn’t strong yet, but the zone is holding, so the long idea still makes sense as long as price stays above it.
For continuation, we need to see buyers reclaim that small resistance above the “ideal entry” zone. That becomes the trigger that confirms the build-up and opens the move toward the major target area. Until that reclaim, we’re just watching how price behaves in this support and whether buyers manage to step back in.
Swallow Academy
$KAS About to Trap Buyers Again? KASUSDT Analysis
KAS is currently trading inside a broader bearish structure on the higher timeframe, with price consistently forming lower highs after a strong breakdown. Even though we’re seeing short-term stabilization, the overall trend still remains weak and positioned closer to a premium area within the local range.
Liquidity above the recent highs has already been taken, and the reaction from that zone was immediate rejection. Instead of continuation, price showed weakness, which is often a sign that the move was more of a stop hunt rather than real buying strength.
Looking at positioning, open interest increased during the push into highs, but price failed to sustain momentum. This usually indicates that longs were building into resistance and are now likely trapped, which adds pressure for a potential downside move.
I’m mainly watching how price behaves on any bounce back into the 0.038–0.040 region. If rejection continues and strength fails to return, the bearish continuation becomes the more probable path from here.
Analysis by Leo524.
#KAS #Crypto #Leo524
Kaspa: rebound or retreat? key levels and targets for todayKaspa, dip buyers still awake here or already rage-quit? Lately the project’s been in the news as one of the “fast L1s,” but price has been nuked together with the broader alt market as traders de-risk on macro fears. Today we’re parked right on a big 4H demand block where previous rallies launched, while sentiment is still washed out according to the market.
On the 4H chart I see a grind down into a green demand zone around the 0.03 area with RSI lingering near oversold and starting to curl up. That combo plus clear volume pockets above makes me lean long, looking for a relief bounce rather than a fresh breakdown. If buyers defend this base, a squeeze back into the red supply band and then toward the mid 0.03s is on the table.
My game plan: I like staggered longs inside this green box with invalidation just under the recent low. ✅ Base case for me is a mean-reversion move toward the 0.034–0.036 area, where I’d start taking profit and let a runner ride if momentum explodes. If price closes decisively below demand, I step aside and look for a deeper reload lower – I might be wrong, but I’d rather miss a move than babysit a falling knife.
Kaspa (KAS): Expecting Bounce From Current Support ZoneKAS is holding its current support zone well, giving buyers a chance to defend structure. As long as this area doesn’t break, we could see another push into the EMAs, which stand as the first target. From there, a successful break of structure will be the key step for continuation toward higher levels, with the final target sitting at $0.092.
Swallow Academy