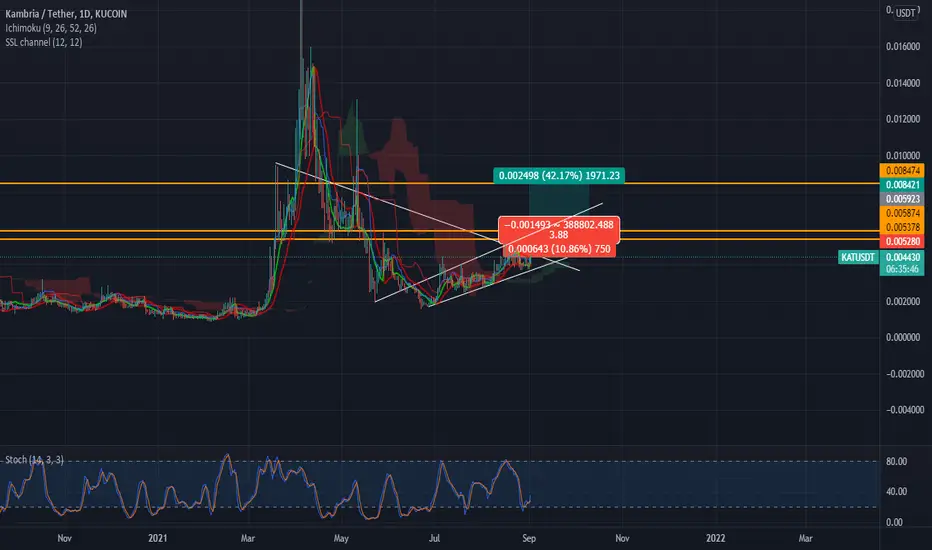
KATUSDT Forming Falling wedgeKATUSDT is forming a clear falling wedge pattern, a classic bullish wave signal that often indicates an upcoming breakout. The price has been consolidating within a narrowing range, suggesting that selling pressure is weakening while buyers are beginning to regain control. With consistent trading volume confirming accumulation at lower levels, the current setup hints at a potential bullish breakout in the near future. If the breakout is confirmed, the projected move could lead to an impressive gain of around 90% to 100%.
This falling wedge pattern is commonly seen at the end of downtrends or corrective phases, signaling a potential shift in market sentiment from bearish to bullish. Traders closely watching KATUSDT are noticing strengthening momentum as the price approaches a key breakout zone. Healthy trading volume further reinforces this setup, indicating that market participants are positioning early in anticipation of a sustained upward move.
Growing investor interest in KATUSDT reflects increasing confidence in the project's long-term potential and its current technical structure. If buyers successfully push the price above the wedge resistance with sustained volume, it could mark the beginning of a fresh bullish leg. The ongoing consolidation phase suggests steady accumulation, creating favorable conditions for a strong continuation rally once the breakout is confirmed.
Traders may find this an attractive medium-term opportunity, especially as the falling wedge pattern nears completion and buying pressure continues to build. A confirmed breakout could attract additional market participation and accelerate the move toward the projected upside target.
✅ Show your support by hitting the like button.
✅ Leaving a comment below! (What is You opinion about this Coin)
Your feedback and engagement keep me inspired to share more insightful market analysis with you!
Katana/USDT
No trades
No trades
In-depth trading ideas
KAT Extreme Bull Signal Carrying a Futures-Only Trap WarningSpot at 0.01599, futures at 0.01483 — spot is trading 7.8% above futures, a significant premium inversion. Backwardation reads -7.26% at a Z-score of -6.7 sigma, one of the most extreme negative premium readings the yield model can produce. Yield at -7949% APY confirms this is not a minor discrepancy — the futures market is pricing this asset nearly 8% below spot at this moment. Extreme Bull headline at 95.09% edge, 39.75x weight, 97.5% green looks extraordinary on the surface. The trap is buried in the squeeze divergence row.
38 green to 2 red out of 112 is near-total bull dominance. EMA 5 green to 0 red, Candle 13 green to 0 red, Ichi TK 9 green to 0 red — structural alignment is complete and genuine. C>T 9 green to 2 red, SS/DD 2 green to 0 red. Spread at 95.1% Extreme. BW at 48.74% Blowoff with bull momentum rising. 5-bar measured move targets 33.5% extension. The signal panel is as clean as it gets — the problem is not in the signal count.
Futures Z at 1.45 Elevated, F+S Z at 1.12 Elevated, but Spot Z at -0.12 Steady. Futures dollar at 103.7M versus spot dollar at 36.13M gives a ratio of roughly 2.87x — not extreme on its own, Spot:Fut reads Normal. But SpotZ 1:5 at -0.12 rising slowly while futures volume leads. Bull:Bear Z at 1.56 versus -0.89 Bull Lean, OBV Z at 0.33 Inflow Rising — accumulation signal is present but mild. The chart shows a single vertical price spike on the current bar, volume bar spiking to 124M on the VolZ panel.
Leverage at 2.66x Normal, percentile 10.3% Floor — AT Min printed just 1 bar ago at 0.81x. Leverage has been at historical lows and is beginning to rebuild. This is the structural backdrop that makes squeeze moves legitimate when they fire on both sides. The problem is the squeeze fired on futures only.
Sqz Div reads Fut Only Trap. This is the most important signal on the entire panel. The futures squeeze fired without spot squeeze confirmation. This pattern is the system's primary manipulation detection flag — futures participants drove the squeeze trigger while spot volume remained subdued. The -6.7 sigma backwardation compounds this: futures are priced far below spot, meaning futures traders are not paying premium to be long. Combined with a futures-only squeeze and a sudden vertical price spike on the chart, this matches the ghost pump pattern precisely.
The honest read: KAT is printing a textbook futures-only trap into an extreme bull signal backdrop. The structural alignment across EMA, Candle, and Ichi is real — this is not a weak ticker being manipulated from flat ground. But the futures squeeze firing without spot confirmation, backwardation at -6.7 sigma, spot volume not participating in the spike, and leverage just hitting all-time low one bar before the move creates a high-probability wash pattern. The price spike on the chart is the visual confirmation of exactly this sequence. Spot buyers chasing this candle are the exit liquidity. Wait for spot volume to confirm and backwardation to normalise before treating this as a genuine breakout.
Is That Crypto Pump Real? Data Says No. Here's Why.
Stop Losing Money to Fake Volume. Find Real Moves Now.
Trade the REAL Crypto Volume. Stop Getting Faked Out.