$KERNEL Analysis
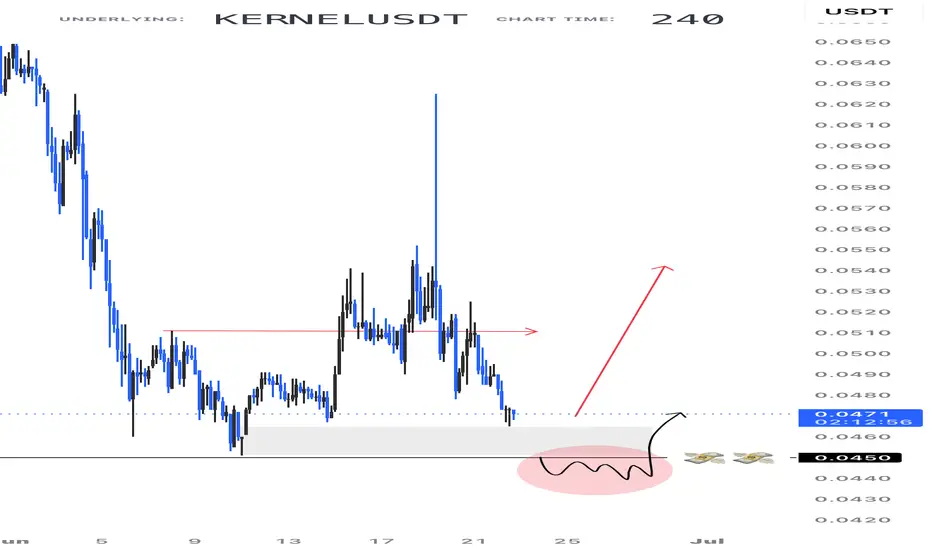
At first glance, the chart looks good. 📈
The only thing that’s a bit confusing is that price still hasn’t swept the liquidity around the 0.0450 level. 👀
There is still a chance of a pump from the current price, but a quick move down to take that liquidity first is also possible.
Reason I’m slightly bullish is bcoz both 4H and 12H trends are bullish for now.
For me, that 0.0450 area remains an important level to watch. 🎯
Follow @HamzaTheInsider for more analysis. 🔥📈
In-depth trading ideas
KERNELUSDT Potential Breakout Setup
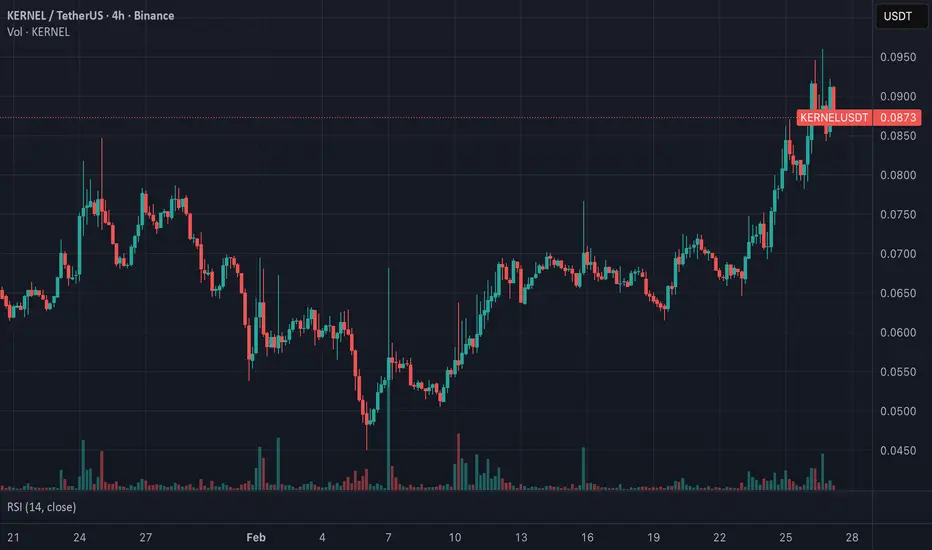
CRYPTOCAP:KERNEL is showing signs of a possible bullish reversal on the 4H timeframe after forming a falling wedge pattern — a classic breakout structure.
🔹 Current Price: 0.06056
🔹 Key Support Zone: 0.0590 – 0.0600
🔹 Resistance Levels: 0.0710 / 0.0850 / 0.1159
📊 What stands out:
✅ Falling wedge breakout attempt
✅ Volume profile building near support
✅ Multiple long entries appearing around demand zone
✅ Strong upside targets if momentum confirms
🎯 Targets:
* TP1: 0.0710
* TP2: 0.0850
* TP3: 0.1159
⚠️ Invalidation: A clean breakdown below 0.0550 could weaken the bullish setup.
Patience is key — wait for confirmation and proper risk management before entering.
#Crypto #Bitcoin #Altcoins #Binance #TradingView #CryptoTrading #KERNEL #USDT #TechnicalAnalysis
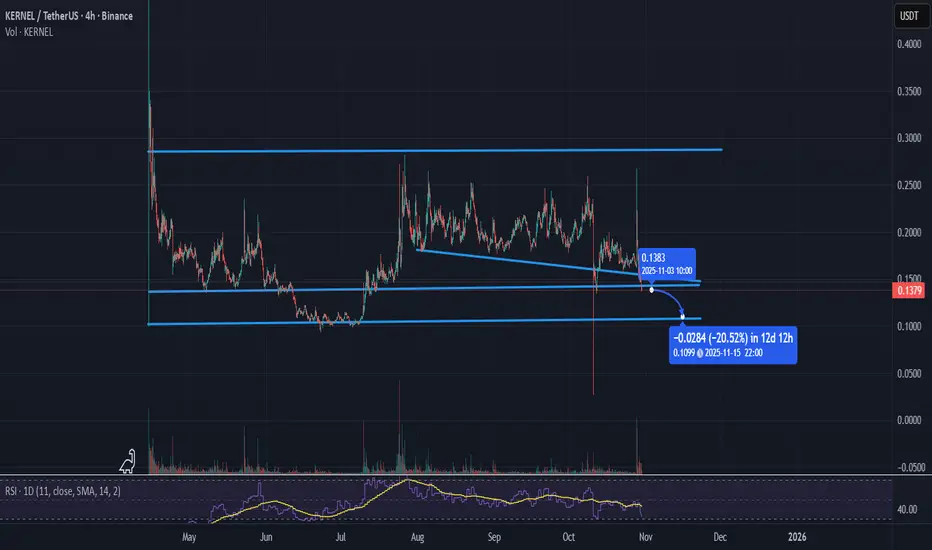
Kernel Bottom of the range. CRYPTOCAP:KERNEL remains trapped in a compression range after the broader downtrend, but price action is beginning to stabilize around a key high volume area.
Momentum on the sell side has weakened, while buyers continue defending support despite multiple breakdown attempts. At the same time, price is still trading below major trend resistance, so bulls have not fully regained control yet.
Key takeaways:
• Momentum is flattening after extended weakness
• Volume profile shows strong activity around the current range
• Structure remains range bound until a breakout confirms direction
• Volatility compression is building for a larger move ahead
Bullish case:
A breakout above resistance could shift short term structure and trigger continuation momentum.
Bearish case:
Failure to hold the current base would likely continue the broader downtrend.
Right now, CRYPTOCAP:KERNEL looks like a market preparing for expansion after a long period of compression.
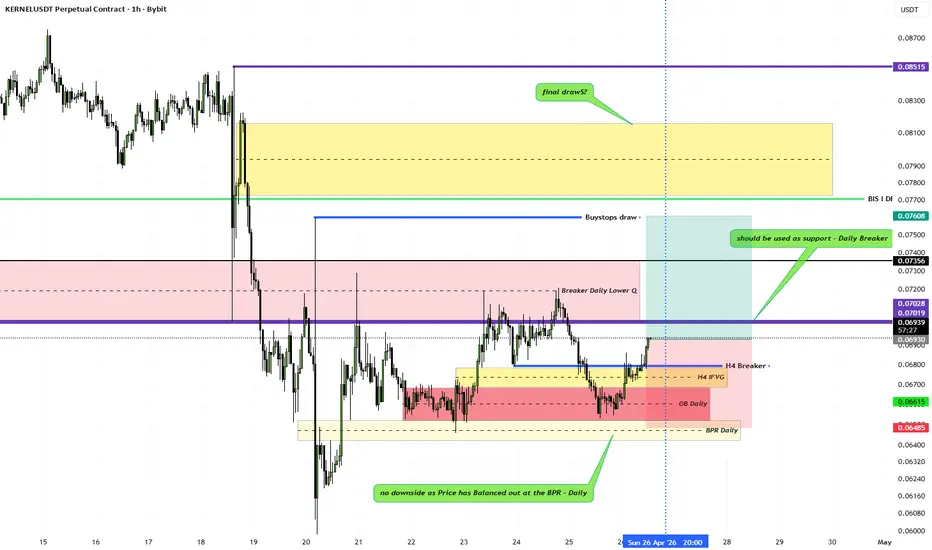
BUY KERNELDAO1. Price has no downside draws as all imbalances have been filled denoted by the BPR
2. Price has closed above the H4 IFVG and Daily OB
3. Tomorrow 20:00 NY Time we might have more volatility
4. Funding rates are negative = good
5. We can retest the breaker for more upside
6. Premium Draws to fill the turtlesoup wick and probably higher
THE KERNEL COLLAPSEThe daily chart for KERNEL/USDT reveals a drastic deterioration of the bullish structure. After a failed attempt to consolidate within an ascending channel, price action suffered a violent rejection at the confluence of the long-term moving averages and the psychological resistance at the $0.10$ mark. The decisive breakout below the lower boundary of the channel, characterized by an impulsive candle with strong downward expansion, confirms that sellers have seized full control of the market momentum.
This reversal is fueled by a systemic crisis triggered by a severe exploit of the cross-chain bridge utilizing LayerZero technology. Attackers exploited a configuration vulnerability in the decentralized verification nodes (DVNs) to forge validation messages, effectively minting massive quantities of synthetic assets without collateral backing. This liquidity black hole shattered the reserves' peg, forcing the protocol into a catastrophic stress test that exposed structural fragilities and led to a massive flight of capital from the KernelDAO vaults.
The final blow came from the protocol's interconnection with lending platforms, where the accumulation of bad debt prompted markets to freeze, causing residual liquidity to evaporate instantly. The failure of the $0.10$ support level triggered a cascade of forced liquidations on long positions, transforming a standard retracement into a structural collapse. Given the absence of significant buy orders in the book and the ongoing panic surrounding the hack, the bearish pressure appears far from exhausted.
The trade setup involves a short entry targeting the historical lows near the $0.0280$ area. Risk is managed by placing a technical stop loss above the channel breakdown level at $0.0907$, maintaining a highly favorable risk-to-reward ratio. As long as the price remains traded below the moving averages and the former channel base, any bounce should be considered purely technical and a prime opportunity for the distribution of further bearish positions.
KernelDAO Looks Better Now · 400% - 695% Profits PotentialKERNELUSDT completed an inverted head and shoulders pattern on its chart and this in turn alerted us of strong bullish potential. This is a classic reversal signal.
I reviewed this chart recently for you and I am happy to say that the project looks much better now. This is because there was a small retrace and this retrace allows for an even better entry. I drew a green box where the best entry is possible on this chart.
It can move lower, or it can start to grow right away. The market can create unpredictable swings short-term. Small down, fast up followed by back down... Noise, price fluctuations. None of this would change the bigger picture. The bigger picture is a major advance with much to offer.
The first target is not highlighted on the chart, some 140% around $0.19. I like to aim high because these opportunities do not present themselves very often, only once or twice per year. When they show up, we have to make the most of them. Not necessarily the final target but at least halfway through.
In some projects/charts, we aim all the way up. On other charts, we can aim for a fast gain. While on still others we focus on the mid-range.
What you choose to do depends on your own trading style, risk tolerance, your goals, your capital and which trading pairs and projects are available to you. It is a big world out there.
I hope you find this information useful, I truly do.
You saw some hints of what is possible this week, recently. This isn't it, it gets many times better.
The Cryptocurrency market is about to blow up with major force. It will be something spectacular... You can bet on it. Just watch! (and take action) it will be great.
Thank you for reading.
Namaste.
KernelDAO inverted H&S opens 465% profits potentialThe completion of the inverted Head & Shoulders pattern confirms the end of the bearish cycle for KERNELUSDT. It is over and done.
The pattern has been completed and the neckline broken—the bulls won.
After the breakout there is also a classic retrace and this too is already reaching its end. What follows? A bullish continuation; higher prices and higher targets, a bullish wave.
I would like to keep this one simple & short, KernelDAO is going up .
The chart looks good for a bullish move to develop next. No waiting period because of the retrace and bottom confirmation, it is already moving.
Namaste.
KERNELUSDT 📈 KERNELUSDT — High Bias, But Lower TF Damage
KERNEL shows strong upward probability alignment (≈88%).
4H structure: intact
1H structure: broken
1D trend base: below MA200
Mixed higher timeframe regime.
This is not clean momentum —
this is higher-timeframe strength with short-term damage.
💡 What This Means
As long as 4H structure holds, bullish continuation remains valid.
However, broken 1H structure suggests:
• Pullback risk
• Volatility expansion
• Fake continuation attempts
Plan: Hold strength.
No averaging.
Risk managed if support breaks (hard)
or if price closes below MA200 (soft invalidation).
⚠️ Where traders usually fail
• Ignore lower timeframe breakdowns
• Add into short-term weakness
• Confuse probability with confirmation
High bias ≠ immediate upside.
🧠 System Perspective
When higher TF is intact but lower TF breaks,
position control matters more than entry timing.
Structure first.
Expansion second.
Patience protects edge.
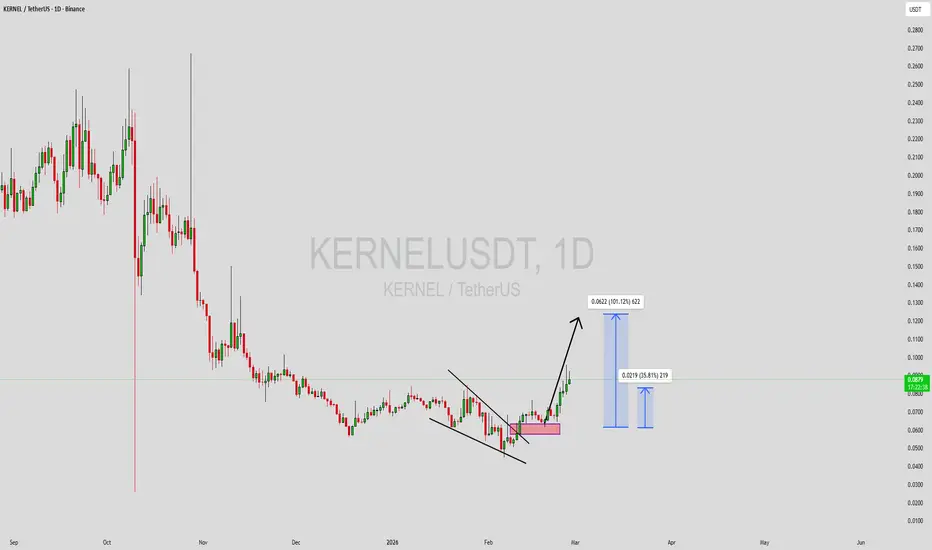
KERNELUSDT Forming Bullish MomentumKERNELUSDT is forming a clear bullish momentum pattern, a classic bullish reversal signal that often indicates an upcoming breakout. The price has been consolidating within a narrowing range, suggesting that selling pressure is weakening while buyers are beginning to regain control. With consistent volume confirming accumulation at lower levels, the setup hints at a potential bullish breakout soon. The projected move could lead to an impressive gain of around 90% to 100% once the price breaks above the wedge resistance.
This bullish momentum pattern is typically seen at the end of downtrends or corrective phases, and it represents a potential shift in market sentiment from bearish to bullish. Traders closely watching KERNELUSDT are noting the strengthening momentum as it nears a breakout zone. The good trading volume adds confidence to this pattern, showing that market participants are positioning early in anticipation of a reversal.
Investors’ growing interest in KERNELUSDT reflects rising confidence in the project’s long-term fundamentals and current technical strength. If the breakout confirms with sustained volume, this could mark the start of a fresh bullish leg. Traders might find this a valuable setup for medium-term gains, especially as the pattern completes and buying momentum accelerates.
✅ Show your support by hitting the like button and
✅ Leaving a comment below! (What is your opinion about this Coin?)
Your feedback and engagement keep me inspired to share more insightful market analysis with you!
KERNELUSDT Forming Bullish MomentumKERNELUSDT is forming a clear bullish momentum pattern, a classic bullish reversal signal that often indicates an upcoming breakout. The price has been consolidating within a narrowing range, suggesting that selling pressure is weakening while buyers are beginning to regain control. With consistent volume confirming accumulation at lower levels, the setup hints at a potential bullish breakout soon. The projected move could lead to an impressive gain of around 90% to 100% once the price breaks above the wedge resistance.
This bullish momentum pattern is typically seen at the end of downtrends or corrective phases, and it represents a potential shift in market sentiment from bearish to bullish. Traders closely watching KERNELUSDT are noting the strengthening momentum as it nears a breakout zone. The good trading volume adds confidence to this pattern, showing that market participants are positioning early in anticipation of a reversal.
Investors’ growing interest in KERNELUSDT reflects rising confidence in the project’s long-term fundamentals and current technical strength. If the breakout confirms with sustained volume, this could mark the start of a fresh bullish leg. Traders might find this a valuable setup for medium-term gains, especially as the pattern completes and buying momentum accelerates.
✅ Show your support by hitting the like button and
✅ Leaving a comment below! (What is your opinion about this Coin?)
Your feedback and engagement keep me inspired to share more insightful market analysis with you!
KERNELUSDT Forming Falling WedgeKERNELUSDT is forming a clear falling wedge pattern, a classic bullish reversal signal that often indicates an upcoming breakout. The price has been consolidating within a narrowing range, suggesting that selling pressure is weakening while buyers are beginning to regain control. With consistent volume confirming accumulation at lower levels, the setup hints at a potential bullish breakout soon. The projected move could lead to an impressive gain of around 90% to 100% once the price breaks above the wedge resistance.
This falling wedge pattern is typically seen at the end of downtrends or corrective phases, and it represents a potential shift in market sentiment from bearish to bullish. Traders closely watching KERNELUSDT are noting the strengthening momentum as it nears a breakout zone. The good trading volume adds confidence to this pattern, showing that market participants are positioning early in anticipation of a reversal.
Investors’ growing interest in KERNELUSDT reflects rising confidence in the project’s long-term fundamentals and current technical strength. If the breakout confirms with sustained volume, this could mark the start of a fresh bullish leg. Traders might find this a valuable setup for medium-term gains, especially as the wedge pattern completes and buying momentum accelerates.
✅ Show your support by hitting the like button and
✅ Leaving a comment below! (What is your opinion about this Coin?)
Your feedback and engagement keep me inspired to share more insightful market analysis with you!
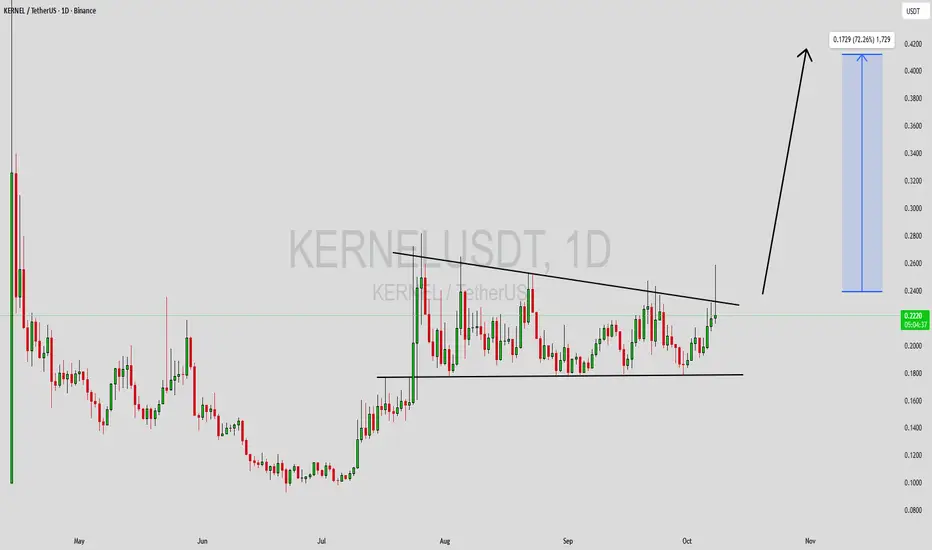
KERNELUSDT 1D#KERNEL is forming a symmetrical triangle on the daily chart. The recent increase in volume suggests a potential breakout to the upside. Consider buying around the current level and near the support at $0.1798. If a breakout occurs above the triangle resistance, the potential targets are:
🎯 $0.2367
🎯 $0.2758
🎯 $0.3255
🎯 $0.3849
🎯 $0.4416
⚠️ Always use a tight stop-loss and maintain proper risk management.
KERNELUSDT Forming Falling WedgeKERNELUSDT is currently displaying a falling wedge pattern, a highly reliable bullish reversal signal that often marks the end of a downtrend and the start of a strong upward move. After a period of consolidation and declining volatility, the price action appears to be compressing, suggesting a potential breakout on the horizon. The wedge structure indicates that sellers are losing strength while buyers are gradually stepping in, preparing for a trend reversal that could lead to a significant rally.
Trading volume remains*good, confirming growing interest and participation from traders who are positioning early for the expected breakout. Once price closes decisively above the upper wedge boundary, KERNELUSDT could trigger a bullish wave with an anticipated gain of around 60% to 70%, supported by renewed momentum and confidence across the market. This aligns well with the broader recovery in altcoins, where similar reversal setups are beginning to play out.
Investors are showing increasing optimism about this project as market sentiment improves and liquidity returns. With its pattern structure and volume confirmation, KERNELUSDT stands out as a strong technical setup that could attract both short-term traders and long-term holders looking for solid upside potential.
✅ Show your support by hitting the like button and
✅ Leaving a comment below! (What is You opinion about this Coin)
Your feedback and engagement keep me inspired to share more insightful market analysis with you!
KERNELUSDT UPDATE#KERNEL
UPDATE
KERNEL Technical Setup
Pattern: Bullish ascending triangle pattern
Current Price: $0.221
Target Price: $0.304
Target % Gain: 35.83%
$KERNEL is breaking out of an ascending triangle pattern on the 1D timeframe. Current price is $0.221 with a target near $0.304, showing about 36% potential upside. The breakout highlights growing bullish pressure and suggests potential continuation if momentum holds. Always use proper risk management.
Time Frame: 1D
Risk Management Tip: Always use proper risk management.