$KGENUSDT THIS SETUP LOOKS BULLISHTHIS SETUP LOOKS BULLISH 🔥
SET:KGEN is still holding the same demand zone that has stopped every major sell-off. At the same time, price is trading inside a long-term falling channel. Every touch of this trendline has brought sellers back, so this level is very important.
My bullish idea stays valid only if buyers break this falling resistance with strong volume. A breakout without volume is not enough. I want to see real buying pressure before expecting a big move.
The RSI is close to the middle level, showing momentum is still neutral. It is not overbought, which leaves room for upside if buyers take control. A clear RSI push above 50 with rising volume would be another strong confirmation.
What could cancel this long idea? If price loses the green demand zone, closes below it, or volume increases during the sell-off, buyers will lose control. A fake breakout with weak volume is another warning sign. In that case, I would avoid long positions until the market gives a new confirmation.
In-depth trading ideas
KGEN USDT LONG SIGNAL#100. KGEN/USDT – Trade Setup (LONG)
📈 Position Type: LONG
🕒 Timeframe: 1H
📊 Market: Futures
💰 Entry Zone:
0.1646
0.1583
🛑 Stop-Loss:
0.1549
🎯 Take-Profit Targets:
• TP1: 0.1725
• TP2: 0.1810
• TP3: 0.19
• TP4: 0.1982
⚙️ Leverage:
5
▫️ After TP1, move SL to Entry + 0.2%.
▪️ Exit Plan:
• 40% at TP1
• 20% at TP2
• 20% at TP3
20% at. TP4
📌 Risk Management:
Risk only 1–2% of your capital per trade.
⚠️ Always check and confirm the setup on your chart before entering the trade.
⚠️
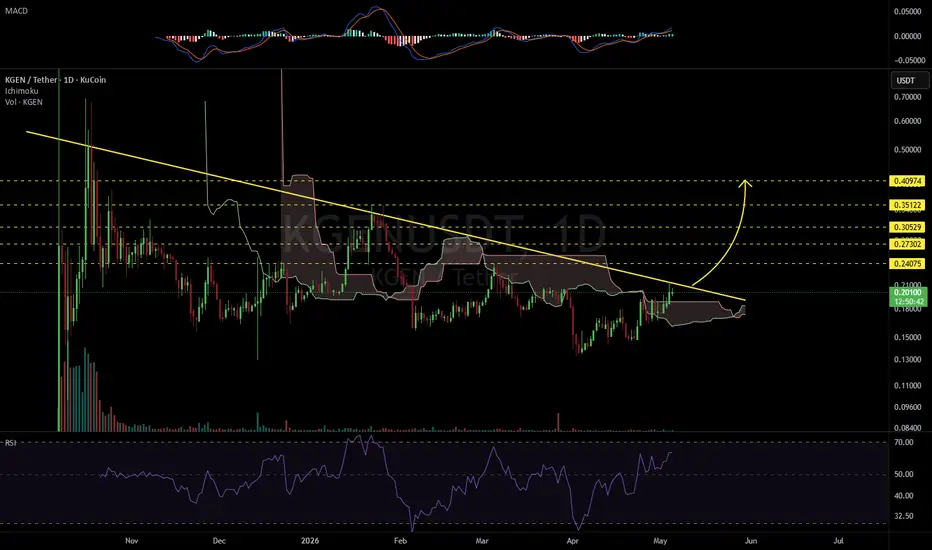
KGENUSDT 1D#KGEN is trading above the Ichimoku cloud and is on the verge of breaking above the descending resistance on the daily chart. If confirmed, the potential upside targets are:
🎯 $0.24075
🎯 $0.27302
🎯 $0.30529
🎯 $0.35122
🎯 $0.40974
⚠️ Always remember to use a tight stop-loss and maintain proper risk management.
KGENUSDT Bull Bias 61% But OBV Bear Divergence at Price FloorKGENUSDT Bull Bias 61% But OBV Bear Divergence at Price Floor
KGENUSDT
Overview
KGENUSDT shows a moderate bull bias at 61.5% with a 6.3x breakout plus recovery ratio and an 11-bar squeeze building at high. On the surface this looks constructive. But two signals underneath challenge the setup. OBV is flagging bear divergence, meaning price is rising while real accumulation is declining. And leverage just hit 22.37x all-time max only 3 bars ago before pulling back to 11.4x. The recent leverage spike combined with OBV divergence at a 13.7% price floor suggests the move higher was speculation-driven rather than organic. The squeeze resolution will determine which narrative wins.
Price
Spot prints 0.18372 with futures at 0.18337, a mild backwardation of negative 0.19%. The retrace from recent highs is just negative 2.3% with a 14.3% bounce, producing a 6.3x recovery ratio classified as breakout plus. The 200-bar range shows a high of 0.32938 and a low of 0.16065, with current price at 13.7% deep in the floor zone. Despite the strong recovery ratio, price remains near the bottom of its historical range. Mean Z data is unavailable, limiting the statistical context for price positioning.
Bias
The multi-timeframe grid reads moderate bull at 61.5% versus 38.5% with 46% clarity. Out of 112 signals, 32 are bullish against 20 bearish. EMA structure favors bulls 5 to 1. Candle patterns lean bear 5 to 9, the primary source of bearish weight showing reversal patterns are forming on the candlestick level even as trend indicators point up. Ichimoku crosses favor bulls 9 to 3. The three soldiers fired at 1 to 0 with star patterns at 2 to 1 and total patterns at 3 to 1. Deep timeframes lean bullish with close-over-trend at 9 to 4 and engulfing at 1 to 2 bearish. SS/DD reads 1 to 2 mildly bearish. The spread is 23.1%, classified as moderate. This is a directional lean, not a conviction call. The disagreement between candle patterns bearing and trend indicators bullish signals a market in transition where the direction is not yet settled.
Volume
Quiet and unremarkable. Spot Z-score is negative 0.45 steady, futures negative 0.36 steady, combined negative 0.37 steady. Momentum is negative 0.12 and falling, meaning volume is low and getting lower. Bull versus bear Z-scores read negative 0.12 against negative 0.37, essentially flat on both sides. Nobody is participating aggressively. No whale activity, no liquidations, clear. No squeeze building on either spot or futures volume. Spot squeeze momentum is contracting upward at 103.4%.
The critical warning is OBV. Z-score sits at negative 0.69 with outflow direction declining, and OBV divergence is flagged as bear divergence. This means price has been rising while spot accumulation has been declining. The 6.3x breakout recovery ratio happened without real money backing it. Buyers lifted price but did not accumulate underlying volume to support the move. This is the signature of a speculative push rather than organic demand.
Leverage
This tells the story. Leverage sits at 11.4x, classified as high. But the all-time max was 22.37x just 3 bars ago. Three bars. Leverage went parabolic and has already halved. The percentile reads 36.8% in the lower zone, meaning the pullback from 22.37x to 11.4x has already brought leverage back to the lower third of its range. The all-time min is 2.87x from 254 bars ago. Futures to spot dollar volume runs 13.21M against 1.16M with a ratio of 11.42x classified as high. The leverage spike 3 bars ago was the fuel behind the breakout recovery ratio. Now that leverage is unwinding, the question is whether price holds without it.
Premium
Futures trade at a 0.19% discount in mild backwardation. The premium Z-score is negative 0.6, moderately below average. Annualized yield reads negative 209% APY at negative 0.6 sigma, flagging as a contrarian bull signal. The backwardation is shallow and not extreme, suggesting the futures market is marginally less optimistic than spot but without strong conviction in either direction.
Squeeze
An 11-bar price squeeze sits at the high stage with bull momentum and upward direction. Bollinger bandwidth is at 10.93%, quite compressed. The squeeze is building toward the 15-bar imminent threshold and should reach it within the next few bars. Neither spot nor futures volume squeeze is active, and squeeze divergence reads normal. The price compression is genuine and the stored energy will produce a directional move. However the direction of that move is now in question given the OBV bear divergence and the fading leverage profile.
Scenarios
1. Squeeze fires upward on momentum carry, 35% probability. The 11-bar squeeze resolves upward consistent with the moderate bull bias and breakout recovery ratio. Price pushes out of the floor zone despite the OBV divergence. The leverage unwind stabilizes near current levels and does not trigger further selling. Volume activates from steady toward elevated on the breakout bar, retroactively justifying the move. Price targets the 25% lower zone around 0.20 as the first objective.
2. OBV divergence wins and squeeze fires down, 35% probability. The bear divergence proves to be the leading signal. Price rising without accumulation was a false move driven by the 22.37x leverage spike 3 bars ago. As leverage continues unwinding, the squeeze resolves downward. The candle patterns at 5 to 9 bearish were the correct read over the trend indicators. Price falls back toward the 200-bar low at 0.16065 as the speculative excess is flushed out.
3. Squeeze extends without resolution, 30% probability. The squeeze builds from high past imminent but does not fire immediately. Price consolidates as the market digests the leverage unwind. Volume stays quiet and OBV stabilizes around the negative 0.69 level without further deterioration. The moderate bull bias slowly weakens or strengthens depending on which signals start flipping. This is the wait-and-see outcome where patience determines the entry.
Watch List
1. OBV divergence resolution. Currently bear divergence with outflow declining. If OBV turns from outflow to inflow while price holds, the divergence is invalidated and the bull thesis strengthens. If OBV continues declining while price stalls, the divergence is confirmed and the downside scenario becomes more likely.
2. Leverage stabilization. Dropped from 22.37x to 11.4x in 3 bars. If leverage stabilizes between 8x and 12x, the unwind is orderly. If it drops below 5x, speculative interest has fully departed and any price support from leverage is gone.
3. Squeeze fire direction. At 11 bars high, approaching imminent. The breakout bar direction and volume response are the trade signal. Look for spot Z above 0.5 on the fire bar for conviction.
4. Candle versus trend resolution. Candle patterns at 5 to 9 bearish versus EMA at 5 to 1 bullish and Ichimoku at 9 to 3 bullish. Candles lead reversals while trends lag. If candle bearish signals increase, the trend indicators will eventually follow.
5. Price versus 200-bar low. Currently 13.7% above the floor. The low at 0.16065 is close. Any break below it would invalidate the entire bull setup and create a new structural low.
Risk
The combination of OBV bear divergence and a leverage spike just 3 bars ago is the highest concern. The 6.3x breakout recovery ratio looks impressive but it was built on 22.37x leverage that has already halved. Moves built on leverage unwind when leverage retreats. The bear divergence confirms that real accumulation did not back the price move. Entering long here means betting that the squeeze resolution can overcome the deteriorating volume structure, which is possible but not high conviction. If trading, size conservatively and set a hard stop below the 200-bar low at 0.16065. The risk reward from the floor zone is favorable if the squeeze fires up, but the probability is a coin flip between scenarios one and two. The smarter play may be to wait for the squeeze fire and enter only if OBV simultaneously flips from outflow to inflow on the breakout bar. Without that confirmation, the breakout is suspect.
More analysis on my profile.
Tags: KGENUSDT, KGEN, crypto, squeeze, OBV divergence, volume analysis, leverage, market structure, floor
KGEN TECHNICALS BULLISH🔥 Fortune AI Radar — SET:KGEN
Fresh activity detected on SET:KGEN today.
Data suggests increasing market interest & buyers stepping in.
Technicals currently lean bullish, with momentum trending upward.
Whales showing hints of accumulation and hype rising among traders.
This coin is flashing strong signals on short-term charts — worth keeping an eye on 👀
Not financial advice — always research before taking decisions
KGENUSDT Breaks Out of Parallel ChannelKGEN has broken above a well-defined consolidation range on the 4-hour timeframe, flipping prior resistance into support. After an extended period of accumulation between key demand and supply zones, price is now showing strong bullish displacement, indicating renewed momentum.
The breakout area aligns with a former high-timeframe resistance zone, now acting as a potential support on pullbacks. As long as price holds above this level, the structure favors continuation toward the upper liquidity zone.
Key points:
- Clear range expansion after prolonged accumulation
- Resistance → support flip at the breakout level
- Defined invalidation below demand zone
- Favorable risk-to-reward targeting higher supply
Continuation is favored while price remains above the breakout base. A loss of this level would suggest a failed breakout and potential return to range.
Cheers
Hexa
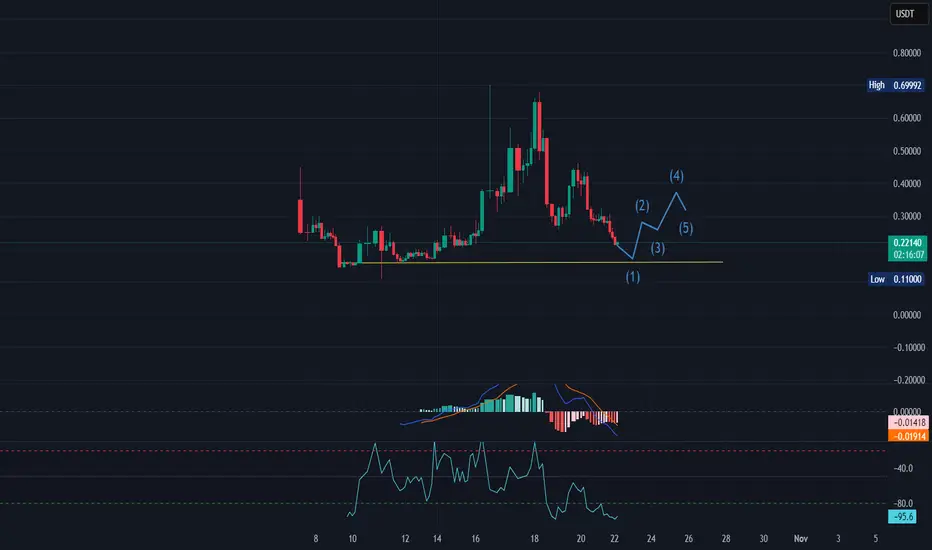
Classic Rectangle Formation — Breakout Defines DirectionPrice action is forming a classic rectangle (range), representing a consolidation phase after increased volatility. The market is compressing, building energy for the next impulsive move.
A key rule for this structure: the direction of the breakout defines the direction of the move.
Scenarios:
🔼 Bullish breakout:
– Break and acceptance above the upper range boundary
– Upside target: 🎯 $0.34
🔽 Bearish breakout:
– Break and acceptance below the lower range boundary
– Downside target: 🎯 $0.11
While price remains inside the rectangle, the market stays neutral. A confirmed breakout with volume is expected to trigger a strong directional move.
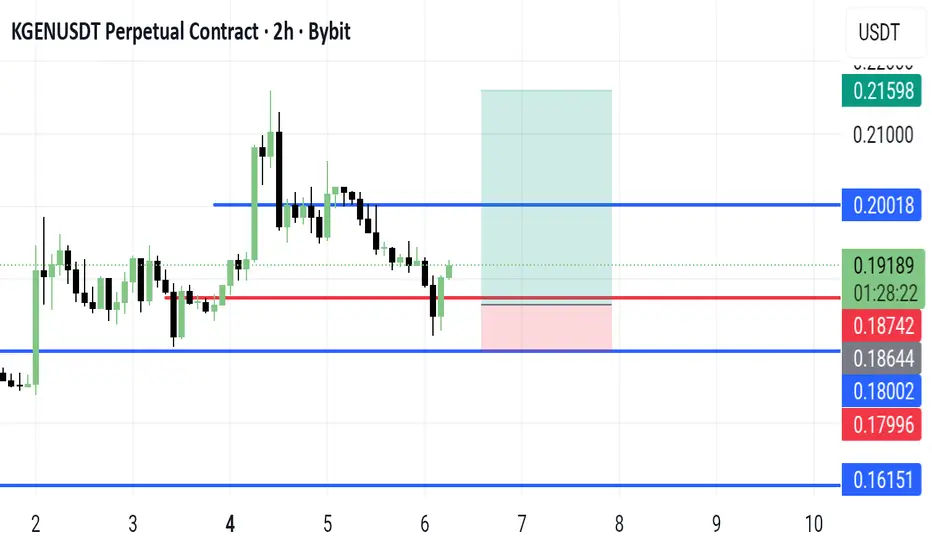
KGEN Buy/Long Setup (2H)Given the liquidity sweep at the bottom, the shift to a bullish market structure, and the formation of three iBOS signals, we can look for buy/long positions in the support zones.
Note that within the entry area, we have two points of interest, which we have marked.
The targets are also indicated on the chart.
If the stop at 0.16915 is touched, this signal will be stopped out.
Do not enter the position without capital management and stop setting
Comment if you have any questions
thank you
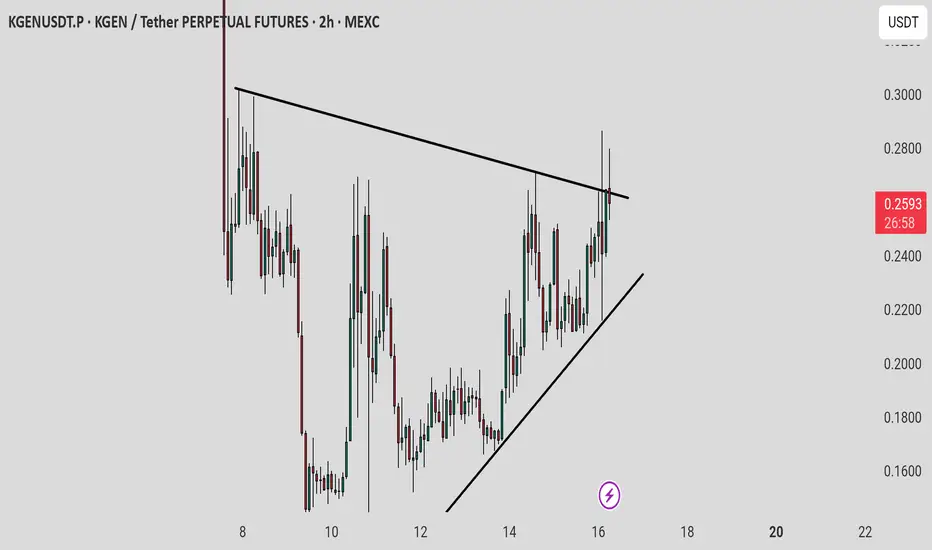
$KGEN Performing a symmetrical triangleA bullish symmetrical triangle is a continuation pattern that signals a potential resumption of an uptrend. The pattern forms during a period of market indecision, where the price consolidates between a descending upper trendline and an ascending lower trendline. A confirmed breakout above the upper trendline suggests that buyers have regained control and the upward momentum is likely to continue.
KGEN Analysis (1H)It is currently fluctuating within a range, and the range node has not yet been engulfed | it has rejected the price.
We labeled the range node as Supply, marked in red.
A liquidity pool is also shown on the chart, and unless the price stabilizes above this liquidity pool level, we expect a drop toward the TP line
Use low volume and leverage, as this is a new coin with high volatility
For risk management, please don't forget stop loss and capital management
When we reach the first target, save some profit and then change the stop to entry
Comment if you have any questions
Thank You