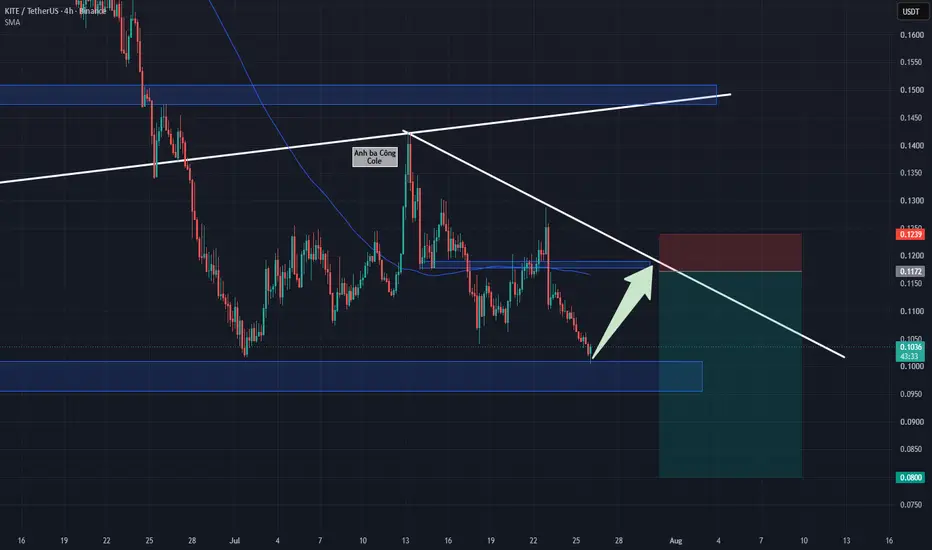
KITE — Bullish Breakout or Another Rejection?KITE/USDT appears to be moving under bearish pressure after forming a series of lower highs, with a descending trendline connecting previous swing highs.
🟡 The Descending Trendline on the chart acts as a dynamic resistance. As long as price remains below this trendline, selling pressure remains a f
KITE/USDT (1h) Forming a Bull Flag After a Strong ImpulseKITE/USDT is consolidating inside a descending parallel channel / bull flag on the 1H chart after a strong impulsive move from roughly $0.118 to $0.140. The pullback remains relatively controlled, with price continuing to respect the boundaries of the descending channel rather than fully reversing t
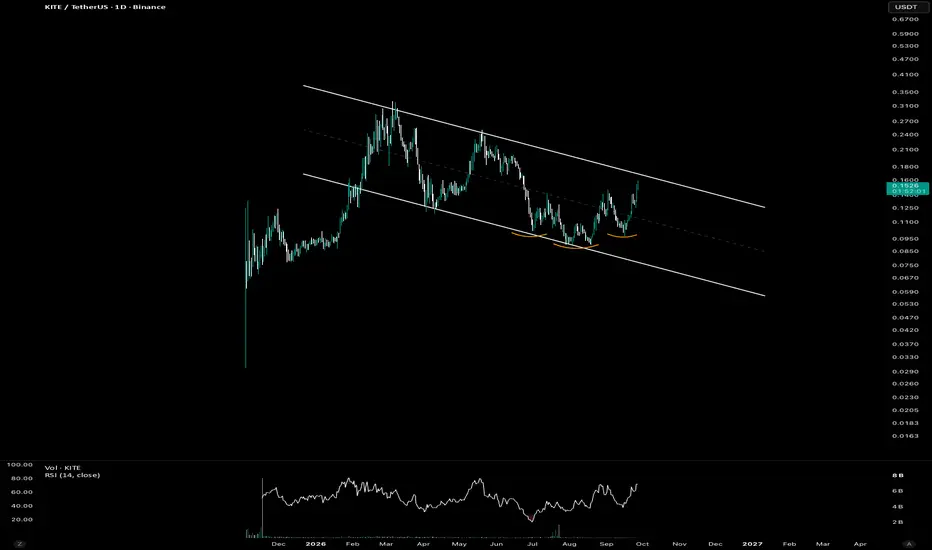
Kite Channel* Trend: KITE is still inside a descending channel, so the overall trend is not fully bullish yet.
* Current setup: Price is approaching the upper channel resistance.
* Momentum: RSI is rising and is around the mid-60s, showing improving buying momentum.
* Bullish confirmation: I’d want to see a dai
$KITE Just Broke the Trendline — Is the Next Move Starting ?
CRYPTOCAP:KITE has finally broken the long-term descending trendline, and the structure is starting to shift. Price is now pulling back into the rising support area around $0.11–$0.10, so this is the level I’m watching closely. If this area continues to hold and buyers step back in, the bullish
KITE — Falling Wedge Breakout Setup?📊 Technical Analysis — KITE/USDT
⏱️ Time Frame: 1D
💰 Current Price: ~0.1153 USDT
📐 Market Structure & Pattern
KITE/USDT is currently forming a Falling Wedge / Descending Wedge structure, characterized by two descending trendlines that gradually converge.
🔻 Upper Trendline:
Acts as dynamic resista
KITEUSDT 1D#KITE has broken above the falling wedge pattern on the daily timeframe and has entered the Ichimoku Cloud. The structure looks promising, and the potential upside targets are:
🎯 $0.1394
🎯 $0.1542
🎯 $0.1689
🎯 $0.1899
🎯 $0.2167
⚠️ Always remember to use a tight stop-loss and maintain proper risk ma
KITEUSDT Forming Bullish MomentumKITEUSDT is forming a clear bullish momentum pattern, a classic bullish wave signal that often indicates an upcoming breakout. The price has been consolidating within a narrowing range, suggesting that selling pressure is weakening while buyers are beginning to regain control. With consistent volume
KITE: Descending Triangle Pattern Taking ShapeKITE: Descending Triangle Pattern Taking Shape – Optimal Short Strategy at Key Resistance Confluence
KITE has officially concluded its prior macro uptrend, transitioning into a clearly defined corrective downward framework. The sequential formation of lower peaks alongside the psychological round
See all ideas
Summarizing what the indicators are suggesting.
Oscillators
Neutral
Oscillators
Neutral
Summary
Neutral
Summary
Neutral
Summary
Neutral
Moving Averages
Neutral
Moving Averages
Neutral
Displays a symbol's price movements over previous years to identify recurring trends.