KITE — Bullish Breakout or Another Rejection?KITE/USDT appears to be moving under bearish pressure after forming a series of lower highs, with a descending trendline connecting previous swing highs.
🟡 The Descending Trendline on the chart acts as a dynamic resistance. As long as price remains below this trendline, selling pressure remains a factor to watch.
🔥 However, price is now approaching an important area around the Descending Trendline, making the next reaction potentially important for determining the short-term direction.
---
🟡 KEY LEVELS
🔹 $0.1536 — Initial resistance
🔹 $0.1755 — Next resistance
🔹 $0.1970 — Important resistance
🔹 $0.2399 — Major resistance / next target
🔹 $0.3023 — Major resistance / extended target
🟢 $0.1317 — Current price area shown on the chart
🔴 $0.1100 – $0.0950 — Important support zone
🔴 $0.0868 — Major low / critical support
---
🟢 BULLISH SCENARIO — BREAKOUT
🚀 The bullish scenario becomes more relevant if KITE successfully breaks above the Descending Trendline and manages to hold above it.
📈 A breakout accompanied by a strong 2D candle close above the trendline could indicate that the dynamic resistance is being overcome.
🎯 If the breakout is confirmed, the next resistance areas to watch are:
➡️ $0.1536
➡️ $0.1755
➡️ $0.1970
➡️ $0.2399
➡️ $0.3023
🔄 After the breakout, a retest of the Descending Trendline should also be monitored. If the trendline turns into support and successfully holds, the bullish structure could receive additional confirmation.
---
🔴 BEARISH SCENARIO — REJECTION
⚠️ If KITE fails to break above the Descending Trendline and gets rejected, bearish pressure could continue.
📉 A rejection from the trendline could push price back toward the nearest support areas.
🔻 Key areas to watch:
➡️ $0.1100
➡️ $0.0950
➡️ $0.0868
💥 If $0.0868 is strongly broken, the price structure could show further weakness and the bearish setup may become more dominant.
---
📚 PATTERN EXPLANATION — DESCENDING TRENDLINE
📉 A Descending Trendline forms when price consistently creates lower highs, with those swing highs connected by a trendline sloping downward.
🟡 On the KITE/USDT chart, the yellow line represents dynamic resistance that has repeatedly limited upward price movement.
🔄 The pattern itself is not confirmation of a breakout. The next direction should be confirmed by how price reacts when it reaches the trendline.
🚀 Upside Breakout: Could indicate a shift in momentum and open the way toward the next resistance levels.
🔻 Rejection: Could maintain the bearish structure and increase the possibility of another test of lower support levels.
---
🎯 KEY CONFIRMATION
🟢 Bullish Confirmation: Breakout + 2D candle close above the Descending Trendline + successful retest.
🔴 Bearish Confirmation: Rejection from the Descending Trendline + formation of a new lower high + breakdown of the next support.
⚠️ Note: The levels above are technical areas based on the chart and do not guarantee future price movement.
#KITE #KITEUSDT #Crypto
In-depth trading ideas
KITE/USDT (1h) Forming a Bull Flag After a Strong ImpulseKITE/USDT is consolidating inside a descending parallel channel / bull flag on the 1H chart after a strong impulsive move from roughly $0.118 to $0.140. The pullback remains relatively controlled, with price continuing to respect the boundaries of the descending channel rather than fully reversing the previous move.
Price is currently trading near the upper part of the flag around $0.131–$0.133. A confirmed breakout and hold above the descending resistance could validate the bullish continuation setup and open the way toward the $0.155–$0.158 measured target area.
A rejection from the upper boundary would keep price inside the flag, while a breakdown below the lower channel support around $0.126–$0.127 would weaken the bullish continuation scenario.
Kite Channel* Trend: KITE is still inside a descending channel, so the overall trend is not fully bullish yet.
* Current setup: Price is approaching the upper channel resistance.
* Momentum: RSI is rising and is around the mid-60s, showing improving buying momentum.
* Bullish confirmation: I’d want to see a daily close above the channel, followed by a successful retest.
* If rejected: A pullback is possible before another attempt higher.
Bottom line: The setup is interesting for an upside move, but price is currently at an important resistance area. I’d prefer breakout confirmation or a clean retest rather than chasing the move.
$KITE Just Broke the Trendline — Is the Next Move Starting ?
CRYPTOCAP:KITE has finally broken the long-term descending trendline, and the structure is starting to shift. Price is now pulling back into the rising support area around $0.11–$0.10, so this is the level I’m watching closely. If this area continues to hold and buyers step back in, the bullish structure remains intact. The first major upside level is around $0.147, followed by $0.208 and potentially $0.251.
I wouldn’t chase the move here. The better confirmation is a clean reaction from the current support and continuation higher. If KITE loses the $0.1005 area with a strong daily close, the bullish setup is no longer valid and I’d expect a deeper correction instead.
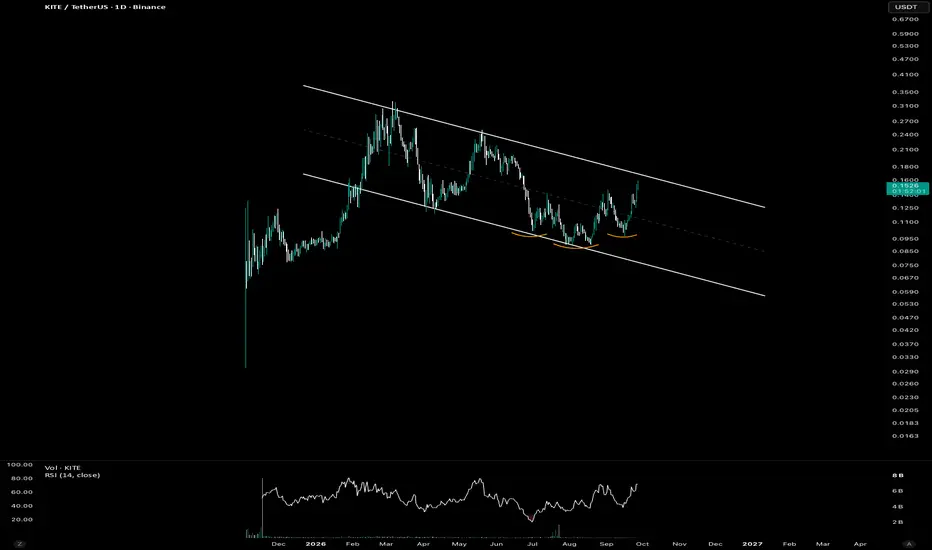
KITE — Falling Wedge Breakout Setup?📊 Technical Analysis — KITE/USDT
⏱️ Time Frame: 1D
💰 Current Price: ~0.1153 USDT
📐 Market Structure & Pattern
KITE/USDT is currently forming a Falling Wedge / Descending Wedge structure, characterized by two descending trendlines that gradually converge.
🔻 Upper Trendline:
Acts as dynamic resistance and has repeatedly rejected price during the broader downtrend.
🔻 Lower Trendline:
Acts as dynamic support and has helped price establish several important lows around the 0.089–0.095 area.
📌 The falling-wedge structure is generally considered a potential bullish reversal pattern, but the bullish thesis is only confirmed after a decisive breakout above the upper descending trendline.
Currently, price is approaching this major resistance area, making the next daily candles particularly important.
---
🟢 Bullish Scenario — Breakout Confirmation
🚀 Primary bullish trigger: A strong daily close above the descending yellow trendline, preferably followed by a successful retest as support.
If the breakout is confirmed, the falling-wedge structure could signal the beginning of a larger recovery.
🎯 Potential upside levels:
1. 🟢 0.120 — First breakout/confirmation area
2. 🎯 0.130 — First major resistance
3. 🎯 0.142 — Important horizontal resistance
4. 🎯 0.155 — Mid-range resistance
5. 🎯 0.167 — Major resistance zone
6. 🚀 0.195 — Major upside target / key breakout objective
A sustained move above 0.167 would significantly strengthen the bullish structure and could open the path toward 0.195.
---
🔴 Bearish Scenario — Rejection From Resistance
⚠️ If price fails to break the upper descending trendline and gets rejected, KITE could remain trapped inside the falling-wedge structure.
📉 A rejection around the 0.115–0.120 region could send price back toward the lower part of the structure.
🔻 Important downside area:
0.095 → 0.089
If the lower trendline/support around 0.089 is decisively broken with strong selling pressure, the falling-wedge bullish thesis would be weakened or invalidated.
❌ A confirmed breakdown below the lower support could indicate continuation of the broader bearish trend rather than a reversal.
---
🔑 Key Levels to Watch
🟢 0.120 — Initial breakout/confirmation zone
🟡 0.130 — Resistance
🟡 0.142 — Resistance
🟡 0.155 — Resistance
🟡 0.167 — Major resistance
🚀 0.195 — Major upside objective
🔴 0.095 — Important support
🔴 0.089 — Critical wedge support / bearish invalidation area
---
🧠 Market Interpretation
KITE is currently at a decision point.
The chart shows a prolonged decline followed by consolidation inside a contracting falling-wedge structure. Price is now approaching the upper boundary of the pattern.
🔥 The most important confirmation is not simply touching or breaking the trendline intraday. A daily candle close above the descending resistance would provide a much stronger bullish signal.
📈 Breakout + successful retest = bullish confirmation
📉 Rejection + breakdown of lower support = bearish continuation
Therefore, the next major move should be watched around the 0.115–0.120 resistance zone.
⚠️ Until a confirmed breakout occurs, the falling wedge remains a setup rather than a confirmed reversal.
---
📌 Conclusion
🚀 Bullish: Daily breakout above the descending trendline → potential move toward 0.130 → 0.142 → 0.155 → 0.167 → 0.195.
🔴 Bearish: Rejection from the upper trendline → potential retest of 0.095–0.089. A breakdown below the lower wedge support would invalidate the bullish reversal structure.
🎯 Key level: 0.120
🔥 KITE is approaching a critical breakout zone. The next confirmed daily close could determine whether this falling wedge becomes a bullish reversal or another rejection within the existing downtrend.
#KITE #KITEUSDT #Crypto #Cryptocurrency #TechnicalAnalysis #Altcoins #CryptoAnalysis #PriceAction #FallingWedge #BullishReversal #Breakout
KITEUSDT 1D#KITE has broken above the falling wedge pattern on the daily timeframe and has entered the Ichimoku Cloud. The structure looks promising, and the potential upside targets are:
🎯 $0.1394
🎯 $0.1542
🎯 $0.1689
🎯 $0.1899
🎯 $0.2167
⚠️ Always remember to use a tight stop-loss and maintain proper risk management.
KITEUSDT Forming Bullish MomentumKITEUSDT is forming a clear bullish momentum pattern, a classic bullish wave signal that often indicates an upcoming breakout. The price has been consolidating within a narrowing range, suggesting that selling pressure is weakening while buyers are beginning to regain control. With consistent volume confirming accumulation at lower levels, the setup hints at a potential bullish breakout soon. The projected move could lead to an impressive gain of around 90% to 100% once the price breaks above the wedge resistance.
This bullish momentum pattern is typically seen at the end of downtrends or corrective phases, and it represents a potential shift in market sentiment from bearish to bullish. Traders closely watching KITEUSDT are noting the strengthening momentum as it nears a breakout zone. The healthy trading volume adds confidence to this pattern, showing that market participants are positioning early in anticipation of a reversal.
Investors’ growing interest in KITEUSDT reflects rising confidence in the project's long-term fundamentals and current technical strength. If the breakout confirms with sustained buying volume, this could mark the start of a fresh bullish leg. Traders might find this a valuable setup for medium-term gains, especially as the momentum pattern completes and buying momentum accelerates.
✅ Show your support by hitting the like button and
✅ Leaving a comment below! (What is You opinion about this Coin)
Your feedback and engagement keep me inspired to share more insightful market analysis with you!
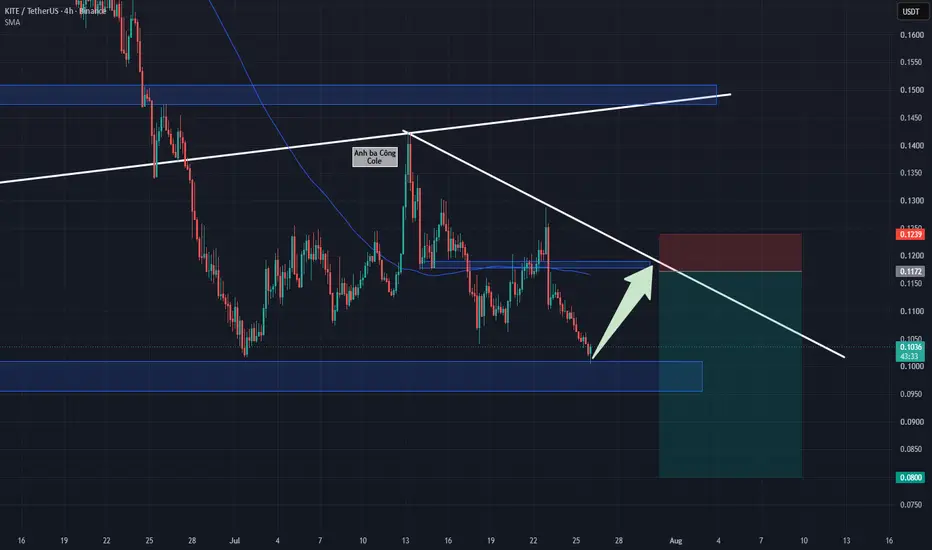
KITE: Descending Triangle Pattern Taking ShapeKITE: Descending Triangle Pattern Taking Shape – Optimal Short Strategy at Key Resistance Confluence
KITE has officially concluded its prior macro uptrend, transitioning into a clearly defined corrective downward framework. The sequential formation of lower peaks alongside the psychological round number support baseline at $0.10 below has formally established a classic descending triangle pattern. Currently, upon touching the $0.10 floor, the price action immediately triggered a brief technical relief bounce.
Based on the visual data from the 4-hour chart , this recovery wave represents a natural market reaction to flush out oversold conditions. The ongoing descending triangle consolidation requires one more short-term peak formation to fully complete the pattern before resuming its primary downward trajectory. This temporary push higher creates a prime window to align positions with the newly formed bearish trend.
Consequently, the smartest trading approach right now is to remain patient and wait for the price action to extend its technical bounce toward the $0.114–$0.117 resistance zone (where the descending trendline converges with the dynamic MA100 line). The technical alignment within this cluster provides an exceptionally secure Short execution trigger, optimizing a tight stop-loss placement just above the barrier while targeting deeper support floors below.
Disclaimer: This is not financial advice, DYOR.
KITE: Bearish Trend PersistsKITE: Bearish Trend Persists – Awaiting a Decisive Breakdown Signal Before Execution
KITE's trend structure continues to move completely in line with the long-term technical outlook we previously mapped out. Although a minor timing mismatch occurred—as the price retested the ascending support trendline earlier than anticipated, causing our prior entry setup to miss triggering—the subsequent price action has indeed plunged decisively. This once again confirms that the bears' selling pressure is firmly driving the market structure in tandem with the broader market trend.
Based on the visual data from the daily chart , the price candles are currently heading back to test the buying interest around the old consolidation support. With the bearish momentum maintaining a persistent grip, the smartest trading behavior right now is strictly to avoid chasing the market or attempting to catch the falling knife due to FOMO. Forcing an entry prematurely at this juncture carries high structural risks.
Instead, the most optimal strategy is to remain patient on the sidelines and await a clear technical confirmation. The safest trigger for a Short position will emerge once a daily candle closes completely below the psychological round number support of $0.10. This decisive breakdown will clear the path for a powerful downward extension, targeting our projected profit-taking milestone at the $0.05 mark.
Disclaimer: This is not financial advice, DYOR.
KITE: Waiting for a Technical Rebound to Set Up an Optimal ShortKITE: Waiting for a Technical Rebound to Set Up an Optimal Short Position
KITE's trend structure on the daily chart is clearly shifting into a bearish phase. Following a prolonged growth period since the beginning of the year, intense profit-taking pressure has fueled the bears to push the price below the long-term ascending support trendline. This structural breakdown occurred around the $0.13 - $0.14 range, marking a shift in market character from bullish to bearish.
Currently, the selling pressure shows signs of temporary exhaustion as the chart approaches the key psychological round number level at $0.10. This area also serves as a retest of the previous accumulation zone. Since short-term selling momentum has cooled down after a steep drop, a technical rebound from this support level is highly probable.
However, the dominant trend has now reversed. Therefore, the safest and most optimal strategy at this moment is to patiently observe and wait for a recovery wave to retest the old support turned new resistance at the $0.15 mark. This milestone perfectly aligns with the intersection of the previously broken trendline. If a price rejection occurs here, it will be the confirmation signal to open a Short position with a target towards the $0.05 zone.
Disclaimer: This is not financial advice, DYOR.
KITEUSDT Forming Falling WedgeKITEUSDT is forming a clear falling wedge pattern, a classic bullish wave signal that often indicates an upcoming breakout. The price has been consolidating within a narrowing range, suggesting that selling pressure is weakening while buyers are beginning to regain control. With consistent volume confirming accumulation at lower levels, the setup hints at a potential bullish breakout soon. The projected move could lead to an impressive gain of around **70% to 80%** once the price breaks above the wedge resistance.
This falling wedge pattern is typically seen at the end of downtrends or corrective phases, and it represents a potential shift in market sentiment from bearish to bullish. Traders closely watching KITEUSDT are noting the strengthening momentum as it approaches a critical breakout zone. The healthy trading volume adds confidence to this setup, showing that market participants may be positioning early in anticipation of a potential reversal.
Investors’ growing interest in KITEUSDT reflects increasing confidence in its current technical structure and future upside potential. If the breakout confirms with sustained volume, this could mark the beginning of a fresh bullish leg. Traders may find this an attractive setup for medium-term gains, especially as the falling wedge pattern nears completion and buying momentum continues to build.
✅ Show your support by hitting the like button!
✅ Leave a comment below: What is your opinion on KITEUSDT?
Your feedback and engagement keep me inspired to share more insightful market analysis with you!
KITEUSDT 1D#KITE has formed a symmetrical triangle pattern on the daily chart. The structure looks promising and is worth monitoring closely.
In case of a breakout above the triangle resistance, the following upside targets could come into play:
🎯 $0.2343
🎯 $0.2614
🎯 $0.3002
🎯 $0.3495
🎯 $0.4122
🎯 $0.4449
🎯 $0.4919
⚠️ Always remember to use a tight stop-loss and maintain proper risk management.
KITEUSDTKITE has formed a bearish FTR structure, suggesting the possibility of further downside.
We also received confirmation from the trendline on a lower timeframe, which strengthens the setup. Based on the current structure, we expect a minimum risk-to-reward ratio of 2.3.
This short trade is suitable with 5x leverage, but proper risk management is essential.
#KITEUSDT
KITE: Failure at the Accumulation TriangleKITE: Failure at the Accumulation Triangle – A Short Setup as the Downtrend Continues
KITE on the 4-hour (H4) timeframe is flashing highly decisive technical signals, confirming that overhead selling pressure holds absolute control over the market layout in 2026. Looking back at historical data, after enduring a heavy distribution wave that triggered a 25% plunge, the asset attempted to transition into a sideways consolidation phase inside an ascending triangle structure to rebuild a support floor. However, this pattern was merely a temporary pausing point for the bears before unleashing the next capital outflow.
Observing the visual chart , the current price action has completely shattered the bulls' hope of a recovery. Price candles have not only broken below the lower boundary support of the triangle but have also successfully completed a text-book retest of this newly established barrier. The complete exhaustion of buying power when the price re-approached the old support floor serves as solid evidence that the bears have locked in their dominance, clearing the path for a deeper downward expansion.
This structural confluence presents a highly potential trend-following sell (Short) entry with an excellent win probability. The disciplined strategy right now is to decisively trigger a Short position based on actual capital flow. You can enforce optimal risk management by placing an extremely tight strategic stop-loss right above the psychological round-number mark of 0.02 USD, while the expected take-profit target points directly toward the solid underlying support floor at 0.14 USD.
this is not investment advice, DYOR
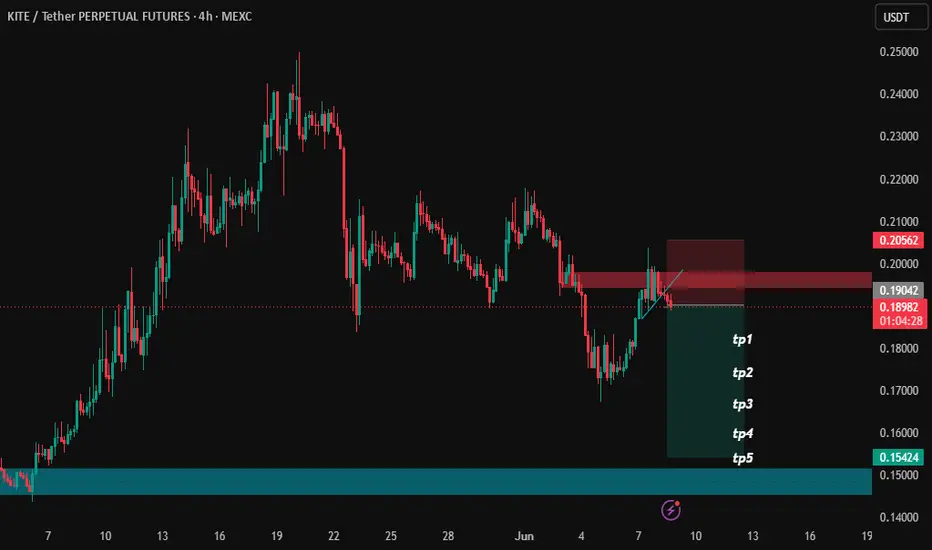
KITE/USDT 4H: QM Bearish Setup Forming#KITEUSDT 4H Chart Analysis
We are spotting a potential Quasimodo (QM) bearish setup on KITE. Here is the tactical game plan:
The Entry Strategy: If the price rallies into the designated Red Zones and prints a valid, high-probability lower-timeframe confirmation, we can execute a short position.
Risk Management: We are running this trade with a maximum of 10x leverage. All specific Take Profit targets and the Stop Loss level are fully mapped out on the chart.
We are keeping a close eye on the price action around these resistance levels to see if the trigger prints.
What is your bias on KITE here? Let me know in the comments below.
KITEUSDT Forming Bullish MomentumKITEUSDT is forming a clear bullish momentum pattern, a classic bullish wave signal that often indicates an upcoming breakout. The price has been consolidating within a narrowing range, suggesting that selling pressure is gradually weakening while buyers are beginning to regain control. With consistent volume confirming accumulation at lower levels, the setup hints at a potential bullish breakout in the near future. The projected move could lead to an impressive gain of around 60% to 70% once the price breaks above the key resistance zone.
This bullish momentum pattern is typically seen at the end of downtrends or corrective phases, representing a possible shift in market sentiment from bearish to bullish. Traders closely watching KITEUSDT are noting the strengthening momentum as it approaches a critical breakout area. Healthy trading volume adds confidence to the setup, indicating that market participants may be positioning themselves early in anticipation of a potential reversal.
Investors’ growing interest in KITEUSDT reflects increasing confidence in the project's long-term outlook and current technical strength. If the breakout confirms with sustained volume, it could mark the beginning of a fresh bullish leg. Traders may find this setup attractive for medium-term opportunities, especially as momentum continues to build and buying pressure accelerates.
✅ Show your support by hitting the like button!
✅ Leave a comment below! (What is your opinion about this coin?)
Your feedback and engagement keep me inspired to share more insightful market analysis with you! 📈🚀
$KITE Showing Weakness After HTF Premium Rejection ??🚨 KITE Showing Weakness After HTF Premium Rejection 👀
KITE pushed into major premium liquidity and immediately started losing momentum after rejection from the upper resistance region. The chart is also forming a potential inverse head-and-shoulders structure, but price still needs stronger confirmation before any clean breakout continuation becomes valid.
Right now current price sits in a difficult mid-range area where risk/reward for fresh longs still looks weak. The stronger setup comes from a deeper liquidity sweep into the 0.189–0.182 discount zone where previous demand and stronger buyer reactions appeared multiple times before.
If price flushes lower into that region and quickly reclaims support with strong bullish displacement, continuation toward higher premium liquidity becomes much more likely. Until then, current structure still looks more like compression after rejection rather than confirmed expansion.
Patience matters here because safer continuation setups usually appear after liquidity gets taken first — not during sideways compression near resistance.
Analysis by Leo524.
#KITE #KITEUSDT #Crypto #Trading #Leo524
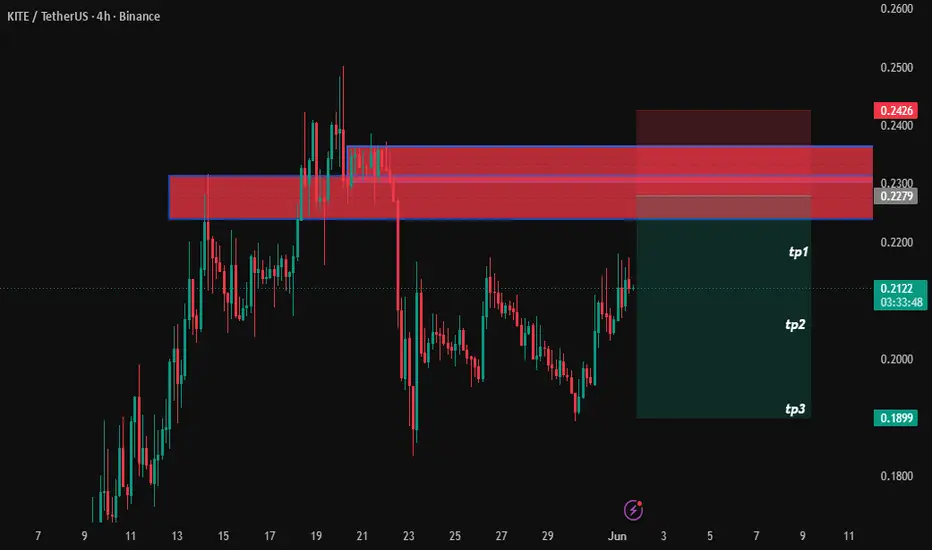
KITE / USDT Near Decision Zone — Breakout or Rejection Ahead?KITE / USDT, after a recent bearish move, is now approaching a critical key level that could decide the next major direction. If price gets rejected from this zone, an ideal short opportunity may appear below the $0.2075 level. On the other hand, if price breaks out with strength, a strong long opportunity could develop above $0.2426, potentially leading to new highs. Watch the price action closely, wait for proper confirmation, and always manage risk wisely before entering any trade. 📊
Kite price analysisCRYPTOCAP:KITE looks surprisingly interesting 👀
Still a relatively young asset, but the chart already shows a very clear structure.
The trend is well-defined, and OKX:KITEUSDT reacts to it quite technically.
Right now the logic feels simple:
the closer to $0.16 you manage to accumulate CRYPTOCAP:KITE , the more attractive the investment could become.
Or there’s another option 😏
Instead of trying to catch the perfect entry, you could simply launch a trading bot inside a ~60% range
and “forget” about it for 2–3 months.
Everyone chooses what fits them better:
▪️ manual accumulation
▪️ or letting the bot do the work.
📈 Overall, CRYPTOCAP:KITE price action still looks very technical:
breakout → retest → continuation of the uptrend.
And all this while the project already sits above a $500M market cap.
What do you think — is CRYPTOCAP:KITE still early or already too crowded?
______________
◆ Follow us ❤️ for daily crypto insights & updates!
🚀 Don’t miss out on important market moves
🧠 DYOR | This is not financial advice, just thinking out loud
KITE: Testing Psychological Barriers
KITE has recently executed an impressive push, accelerating from $0.16 to $0.24, bringing significant excitement to the investment community. However, from a professional analysis standpoint, we are approaching the "danger zone" of $0.24 - $0.255. This is a formidable historical resistance area, where selling pressure caused the price to halve down to $0.125 back in March. Price compression at this boundary is often followed by decisive corrections to neutralize supply; therefore, chasing the rally (FOMO) here poses a high risk to your capital.
Observing the chart , the most disciplined strategy currently is to patiently wait for a price retracement to the support levels below to optimize your position. The first potential zone lies at the psychological round-number threshold of $0.2 - $0.21. Should the downward impulse expand, the "steel foundation" at the MA100 moving average (the $0.18 - $0.19 area) will be the firmest spot to establish new buy orders. In professional investing, purchasing during technical pullbacks consistently yields superior risk-to-reward (RR) ratios. Long-term targets can realistically aim for KITE’s All-Time High (ATH) once macro liquidity returns decisively. Keep a cool head and adhere to the technical roadmap to preserve sustainable profits.
this is not investment advice, DYOR