KNCUSDT LONG Roddy01-SIGNALSPROVIDERInstructions:
Entry point: yellow
Stop loss: red
Take profit: green
👉Leverage x 5-10-20 for crypto
👉Leverage x 20-50-100 for commodities, stocks, indices, and forex
👉Margin 1-5% max.
Always practice risk and money management.
Invest a maximum of 5% on any trade or across all your trades.
Invest only what you can afford to lose, as no one is in control of the market.
👉Our analyses are primarily based on:
breakouts: two trend lines (ascending and descending) and a line indicating a horizontal breakout.
chart patterns: shoulders and head, triangle parttern, elliott impulse, etc etc.
We don't always have the time to track them at all times or to represent them visibly, given the numerous signals, the number of channels to manage, and especially because of the often rapid pace of market movements.
indicators: We associate at least two indicators with this technique.
👉Depending on the circumstances, we use specific indicators, often setting 3 or more take profit levels.
👉Indeed, there are good days in trading and also bad days. No one can promise to win every trade, and like all traders worldwide, we also experience stop-loss orders. However, we win more than we lose and remain positive.
👉You can close the position before or after the take profit orders indicated by the green lines if you are personally satisfied; the same applies to stop loss orders.
👉We must stay positive, clear-headed, and humble.
we cannot provide all instructions or all trades here on this channel.
Good luck to us all, and may God guide us. Amen
In-depth trading ideas
KNCUSDT SHORTInstructions:
Entry point: yellow
Stop loss: red
Take profit: green
👉Leverage x 5-10-20 for crypto
👉Leverage x 20-50-100 for commodities, stocks, indices, and forex
👉Margin 1-5% max.
Always practice risk and money management.
Invest a maximum of 5% on any trade or across all your trades.
Invest only what you can afford to lose, as no one is in control of the market.
👉Our analyses are primarily based on:
breakouts: two trend lines (ascending and descending) and a line indicating a horizontal breakout.
chart patterns: shoulders and head, triangle parttern, elliott impulse, etc etc.
We don't always have the time to track them at all times or to represent them visibly, given the numerous signals, the number of channels to manage, and especially because of the often rapid pace of market movements.
indicators: We associate at least two indicators with this technique.
👉Depending on the circumstances, we use specific indicators, often setting 3 or more take profit levels.
👉Indeed, there are good days in trading and also bad days. No one can promise to win every trade, and like all traders worldwide, we also experience stop-loss orders. However, we win more than we lose and remain positive.
👉You can close the position before or after the take profit orders indicated by the green lines if you are personally satisfied; the same applies to stop loss orders.
👉We must stay positive, clear-headed, and humble.
we cannot provide all instructions or all trades here on this channel.
Good luck to us all, and may God guide us. Amen.
Kncusdt longInstructions:
Entry point: yellow
Stop loss: red
Take profit: green
👉Leverage x 5-10-20 for crypto
👉Leverage x 20-50-100 for commodities, stocks, indices, and forex
👉Margin 1-5% max.
Always practice risk and money management.
Invest a maximum of 5% on any trade or across all your trades.
Invest only what you can afford to lose, as no one is in control of the market.
👉Our analyses are primarily based on:
breakouts: two trend lines (ascending and descending) and a line indicating a horizontal breakout.
chart patterns: shoulders and head, triangle parttern, elliott impulse, etc etc.
We don't always have the time to track them at all times or to represent them visibly, given the numerous signals, the number of channels to manage, and especially because of the often rapid pace of market movements.
indicators: We associate at least two indicators with this technique.
👉Depending on the circumstances, we use specific indicators, often setting 3 or more take profit levels.
👉Indeed, there are good days in trading and also bad days. No one can promise to win every trade, and like all traders worldwide, we also experience stop-loss orders. However, we win more than we lose and remain positive.
👉You can close the position before or after the take profit orders indicated by the green lines if you are personally satisfied; the same applies to stop loss orders.
👉We must stay positive, clear-headed, and humble.
we cannot provide all instructions or all trades here on this channel.
Good luck to us all, and may God guide us. Amen.
kncusdt longInstructions:
Entry point: yellow
Stop loss: red
Take profit: green
👉Leverage x 5-10-20 for crypto
👉Leverage x 20-50-100 for commodities, stocks, indices, and forex
👉Margin 1-5% max.
Always practice risk and money management.
Invest a maximum of 5% on any trade or across all your trades.
Invest only what you can afford to lose, as no one is in control of the market.
👉Our analyses are primarily based on:
breakouts: two trend lines (ascending and descending) and a line indicating a horizontal breakout.
chart patterns: shoulders and head, triangle parttern, elliott impulse, etc etc.
We don't always have the time to track them at all times or to represent them visibly, given the numerous signals, the number of channels to manage, and especially because of the often rapid pace of market movements.
indicators: We associate at least two indicators with this technique.
👉Depending on the circumstances, we use specific indicators, often setting 3 or more take profit levels.
👉Indeed, there are good days in trading and also bad days. No one can promise to win every trade, and like all traders worldwide, we also experience stop-loss orders. However, we win more than we lose and remain positive.
👉You can close the position before or after the take profit orders indicated by the green lines if you are personally satisfied; the same applies to stop loss orders.
👉We must stay positive, clear-headed, and humble.
we cannot provide all instructions or all trades here on this channel.
Good luck to us all, and may God guide us. Amen.
kncusdt longInstructions:
Entry point: yellow
Stop loss: red
Take profit: green
👉Leverage x 5-10-20 for crypto
👉Leverage x 20-50-100 for commodities, stocks, indices, and forex
👉Margin 1-5% max.
Always practice risk and money management.
Invest a maximum of 5% on any trade or across all your trades.
Invest only what you can afford to lose, as no one is in control of the market.
👉Our analyses are primarily based on:
breakouts: two trend lines (ascending and descending) and a line indicating a horizontal breakout.
chart patterns: shoulders and head, triangle parttern, elliott impulse, etc etc.
We don't always have the time to track them at all times or to represent them visibly, given the numerous signals, the number of channels to manage, and especially because of the often rapid pace of market movements.
indicators: We associate at least two indicators with this technique.
👉Depending on the circumstances, we use specific indicators, often setting 3 or more take profit levels.
👉Indeed, there are good days in trading and also bad days. No one can promise to win every trade, and like all traders worldwide, we also experience stop-loss orders. However, we win more than we lose and remain positive.
👉You can close the position before or after the take profit orders indicated by the green lines if you are personally satisfied; the same applies to stop loss orders.
👉We must stay positive, clear-headed, and humble.
we cannot provide all instructions or all trades here on this channel.
Good luck to us all, and may God guide us. Amen.
KNC Ascending Broadening Wedge | Expansion Phase at Key SupportKNC is forming an Ascending Broadening Wedge on the 4H timeframe, marked by expanding volatility and higher lows.
Price is currently reacting near the lower boundary of the structure. Holding this zone keeps the bullish expansion scenario active, with upside continuation toward upper resistance zones. A confirmed breakdown below support would invalidate the setup and open downside continuation.
This structure favors volatility expansion rather than range contraction.
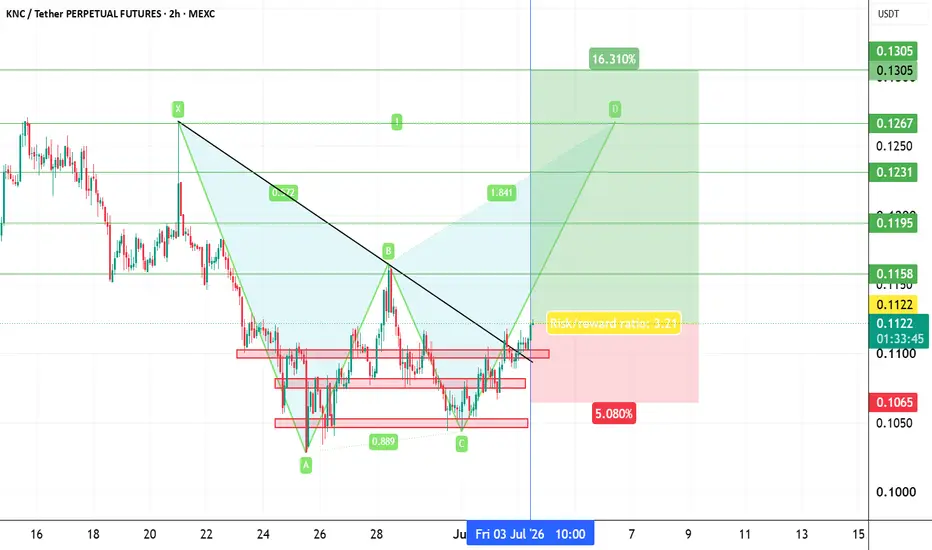
KNC Analysis (4H)Based on the point where we placed the green arrow on the chart, KNC has started forming a diametric pattern. This type of pattern is a complex corrective structure often seen in Elliott Wave analysis, indicating potential future price movements that traders should monitor closely.
Currently, it appears that we are in the middle of wave D. The chart highlights two green lines, which represent our preferred entry zones. Traders can enter long positions using a Dollar-Cost Averaging (DCA) strategy, gradually building their position within these zones to optimize risk management.
The target levels have been clearly marked on the chart. These targets correspond to the expected wave E of the diametric pattern, providing potential exit points for this bullish move. Monitoring the progression of this pattern is crucial, as it helps in managing trades and anticipating market behavior.
It is important to note that a daily candle closing below the invalidation level will negate this analysis and cancel the projected bullish scenario. Traders should always use proper risk management and stop-loss strategies to protect their positions.
If you have a coin or altcoin you want analyzed, first hit the like button and then comment its name so I can review it for you.
This is not a trade setup, as it has no precise stop-loss, stop, or target. I do not publish my trade setups here.
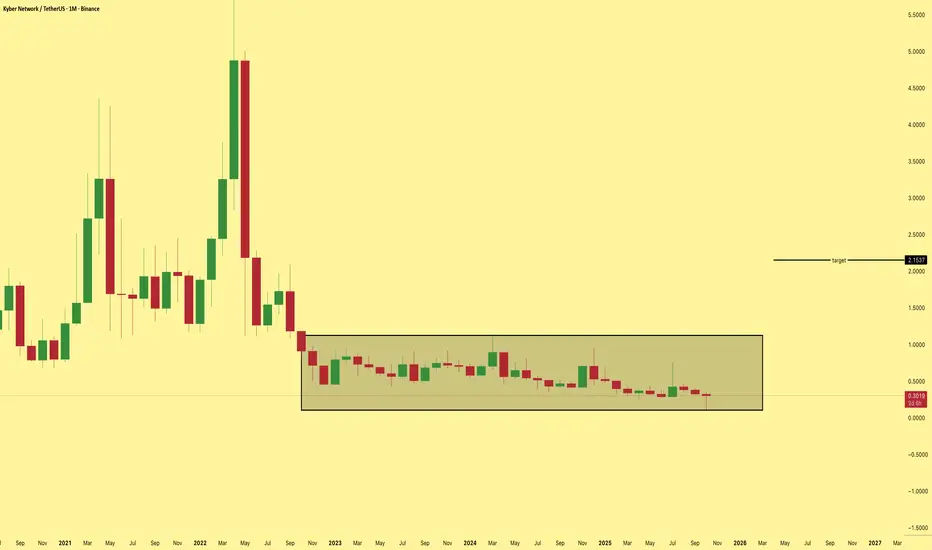
KNC At The Edge Of A Multi Year Break – Big Move LoadingKNC is currently trading inside a broad falling channel that has been developing for several years. Price is now approaching the lower boundary of the structure, an area that has historically produced strong reaction moves.
The recent breakdown on the lower timeframe aligns with the weekly falling wedge, which suggests that volatility may expand in the coming sessions. As long as price holds above the long term support zone, the possibility of a recovery wave remains active.
The market is at a decision point . A reclaim of the local trendline would support a bullish cycle toward the upper resistance band. Failure to hold this zone, however, may push price deeper into the macro support line before a larger reversal attempts to form.
Key Notes:
• Price is approaching multi year demand inside the falling channel
• Weekly timeframe supports the potential for a major reversal
• Lower timeframe shows a compression that can break either direction
• Volatility will expand once the structure resolves
• Trendline reclaim opens room for a bullish continuation
Invalidation : A clean breakdown below the macro lower trendline removes the bullish recovery scenario.
Simple View : KNC is sitting at a macro support zone. A bounce can trigger a meaningful recovery, but losing this area would expose deeper downside. This is a region to watch closely.
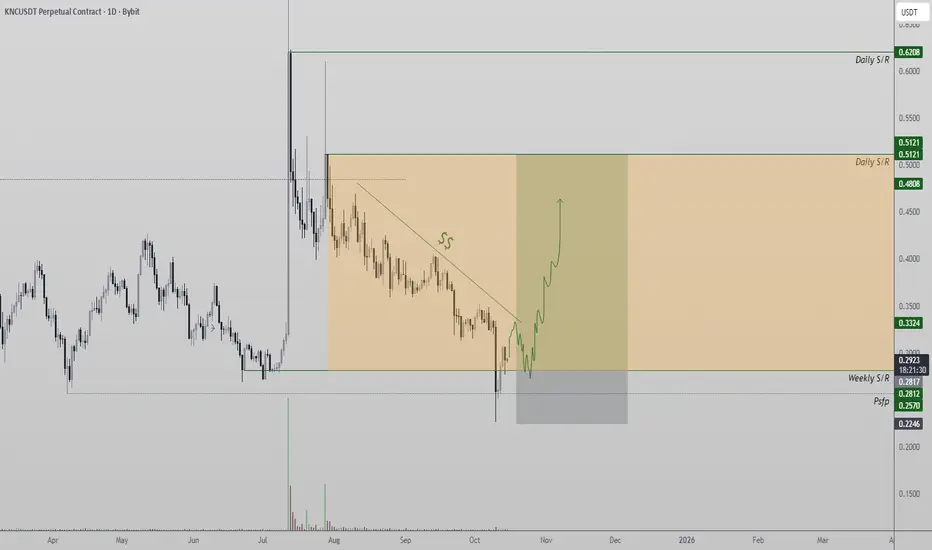
KNC Finds Support at $0.28 — Watching for a Potential ReversalKNC has been trading in an aggressive downtrend, consistently forming lower highs as bearish momentum continues to dominate. Despite this, price action is now showing signs of stabilization around the $0.28 region, which has acted as a firm support zone over recent days and weeks.
This $0.28 level represents a pivotal point in KNC’s current structure. Holding above this support could allow for a short-term rotation higher, though the overall market context remains bearish. Any potential upside from here should be treated cautiously, as the broader downtrend has not yet been invalidated.
Key Points:
- Persistent Downtrend: Price continues to print lower highs, confirming bearish control.
- Key Support: The $0.28 region has held consistently, showing near-term buyer defense.
- Potential Reversal Zone: A bounce from $0.28 could initiate a short-term recovery.
From a technical standpoint, this area is crucial for determining whether KNC can form a reversal structure or continue its downward trajectory.
What to Expect:
As long as $0.28 holds, KNC has room for a rotation toward higher levels. A breakdown below this zone, however, would invalidate the reversal setup and reassert the dominant bearish trend.
KNC (KNC/USDT) — Weekly Reclaim Signals Structural Shift KNC has posted a significant structural shift after sweeping its April 2025 low and reclaiming the weekly support zone on a closing basis. This move often marks a transition from distribution to reaccumulation.
Key Technical Points:
- Weekly Support Reclaimed: $0.41
- Target: $0.51
- Structure: Higher-timeframe reversal setup
A bullish retest of the reclaimed support could confirm a fresh accumulation base. If the structure holds and price breaks the series of lower highs, momentum could accelerate toward $0.51 — the next major resistance zone.
Volume behavior suggests stabilization, hinting that sellers are losing strength as the pair establishes footing. Maintaining the reclaimed weekly level is critical for confirming trend reversal potential.
As long as KNC holds above $0.41, the overall bias remains bullish, with continuation toward $0.51 becoming increasingly likely.
KNC/USDT — Multi-Year Decision Zone: Accumulation or Breakdown?🔎 Overview
Kyber Network (KNC) is standing at one of its most critical levels since 2019. After peaking in 2021, the price has consistently formed lower highs and is now retesting the legendary support zone at 0.28–0.34 USD.
This area isn’t just a random floor — it’s a multi-year accumulation base that has shaped KNC’s price cycle for over 5 years. As price enters this zone again, the market faces a decisive moment:
➡️ Will this be the start of a major rebound?
➡️ Or the beginning of a deeper breakdown into new lows?
---
🟢 Bullish Scenario (Reversal Potential)
1. Key trigger: A weekly close above 0.41 USD signals the first breakout.
2. Upside targets:
Target 1: 0.63 USD (classic resistance)
Target 2: 0.92 – 1.19 USD (major supply zone)
Target 3: 2.02 USD (long-term validation of reversal)
Extended bull cycle: 3.6 – 5.7 USD (historical highs)
3. Bullish confirmations: Rising volume, strong-bodied weekly candles, and successful retests of breakout levels.
📌 Translation: If the broader crypto market enters a new bull run, KNC could multiply several times from current levels.
---
🔴 Bearish Scenario (Historical Breakdown)
1. Key trigger: A weekly close below 0.28 USD validates the breakdown.
2. Implications: Failure of the multi-year accumulation base.
3. Downside targets:
Support zone: 0.20 – 0.14 USD
Historical low: 0.1126 USD
4. Consequences: A breakdown here could trigger panic selling and push KNC into downside price discovery.
📌 In short, if this support fails, KNC risks losing its long-term technical foundation.
---
📐 Structure & Pattern
Primary trend: Bearish since 2021 (consistent lower highs).
Current pattern: Range accumulation between 0.28–0.34 USD, with potential double/triple bottom formation.
Momentum: Price compression near major support → often precedes a strong breakout or breakdown.
---
🎯 Conclusion & Strategy
Long-term investors: The 0.28–0.34 USD zone could be a golden accumulation opportunity if it holds.
Conservative traders: Wait for a weekly close > 0.41 USD before entering to avoid false bounces.
Aggressive traders: Scale into longs near support with tight stops below 0.28 USD.
Risk management: Keep exposure low, risk max 1–3% per trade.
💡 Right now, KNC stands at a multi-year crossroads. Holding this base could trigger a trend reversal, while losing it could reopen the path to historical lows.
---
#KNCUSDT #KyberNetwork #CryptoAnalysis #Altcoin #SupportResistance
KNCUSDT — Critical Zone: Major Accumulation or Start of Breakdow🔎 Key Analysis
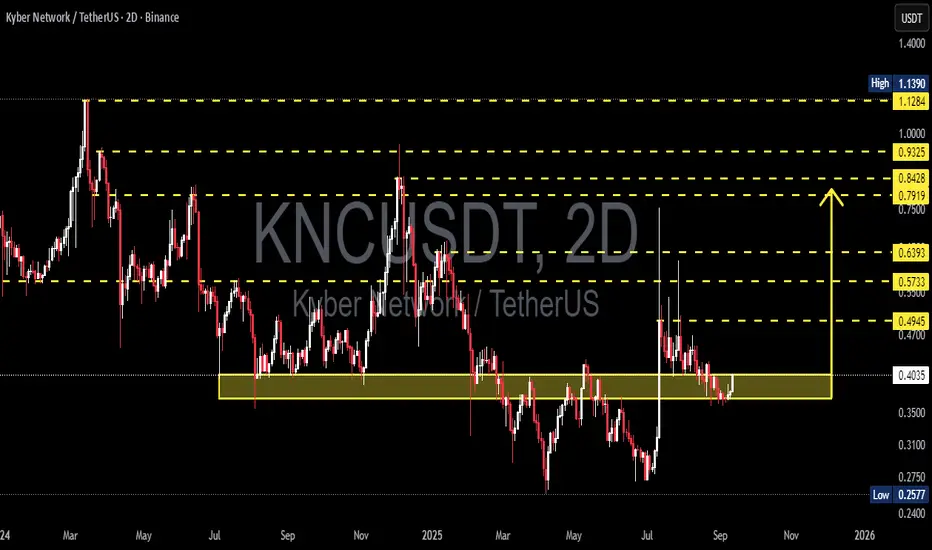
KNC is currently trading around 0.4034 USDT, sitting right inside the 0.32–0.40 demand zone (yellow box), a level that has acted as a key support-resistance flip for months. This area is crucial because:
1. It has previously served as the launchpad for strong rallies.
2. It has been tested multiple times, confirming its importance to both bulls and bears.
3. Each visit to this zone has triggered major reactions.
Above, we can see several resistance levels that may serve as bullish targets. Below, the chart leaves room for a retest of the major low. This puts price action in a “make or break” decision point.
---
📈 Bullish Scenario
Confirmation: Price must hold above 0.40 and close decisively above 0.4945 (2D timeframe).
Momentum: A strong breakout with volume could push KNC toward 0.5733 and 0.6393.
Extended Target: A larger move could revisit 0.79 – 0.93, the broader distribution zone.
Opportunity: From current levels, the upside potential (+58% to R3) outweighs the risk if breakout confirms.
---
📉 Bearish Scenario
Confirmation: Price fails to hold 0.32–0.40 and closes below the yellow zone.
Implication: This would flip demand into supply, opening the door for deeper sell-offs.
Target: First target near 0.30, then a retest of the 0.2577 major low.
Risk: Breakdown toward 0.2577 represents a ~36% downside from current levels.
---
📊 Current Structure
1. Extended Range: Multi-month sideways price action suggests accumulation or distribution.
2. Liquidity Sweeps: Long wicks show repeated stop-hunting and liquidity grabs.
3. Accumulation/Distribution Zone: The 0.32–0.40 area is the current battle zone.
4. Lower Highs Dominance: On higher timeframe, the trend still favors bears until a clear structure shift (higher high + higher low) occurs.
---
🎯 Conclusion
KNC is at a critical inflection point.
A breakout above 0.4945 could trigger bullish continuation toward 0.57 – 0.64.
A breakdown below 0.40 risks a return to 0.2577.
Best strategy: Wait for breakout or breakdown confirmation. Current levels may attract accumulation, but risk management is crucial as volatility could expand in either direction.
---
#KNC #KNCUSDT #KyberNetwork #CryptoAnalysis #Altcoin #TechnicalAnalysis #Breakout #SupportResistance #CryptoMarket
KNC Price Readies for Bullish Expansion Kyber Network (KNC) has been consolidating after a corrective pullback, holding key support at $0.28. With price trading in a bullish order block, traders are eyeing a potential rotation toward the $0.84 resistance if volume confirms the next move.
Kyber Network’s KNC token has been consolidating within a corrective phase after recently backtesting the point of control (POC). Price action suggests the correction is nearing completion as KNC trades in a bullish order block that may serve as the foundation for the next upward move. However, volume dynamics remain a critical factor, as momentum confirmation is necessary for a sustained bullish expansion.
Key Technical Points
- Critical Support at $0.28: A pivotal level that must hold to maintain bullish structure.
- Volume Weakness: Current decline in trading volume highlights the need for confirmation on the next move.
- Upside Target at $0.84: Resistance zone in focus if the bullish rotation is triggered.
After a volatile upward move earlier, KNC entered a correction phase, retesting the point of control before stabilizing. This corrective behavior aligns with broader market tendencies, where sharp expansions are often followed by consolidation or pullbacks before resuming trend direction. The presence of a bullish order block within this correction provides a structural base that could propel the next leg higher.
The $0.28 level has emerged as the most significant support. This region has already been tested and respected, suggesting active buyer interest at this price zone. Holding above $0.28 is essential for bullish traders, as a breakdown below this level would weaken the current structure and potentially extend the corrective cycle.
Volume, however, is the main missing piece at the moment. The decline in trading activity during the corrective move reflects reduced participation, which is common in consolidation phases. For KNC to rotate toward the highs, the next push upward must be backed by a noticeable increase in volume. Without this confirmation, any attempted breakout risks fading quickly, trapping early longs.
Should volume return and buyers reclaim momentum, the path toward $0.84 becomes increasingly probable. This resistance represents both a psychological barrier and a historical supply zone, making it a natural target for a bullish expansion. Breaking this level decisively could mark a trend continuation phase, opening up further upside opportunities.
What to Expect in the Coming Price Action
As long as KNC holds the $0.28 support, the technical bias remains bullish. If volume expansion accompanies the next move, traders can expect a rotation toward the $0.84 resistance in the short to medium term. A confirmed breakout from this zone would validate the broader bullish structure and likely attract stronger market participation.
KNC/USDT +100% KNC/USDT recently performed a liquidity sweep below the $0.40 zone, followed by a strong bounce from the $0.27–$0.28 area, delivering a +150% surge. It then aggressively reclaimed the $0.40 support/resistance flip zone. After a healthy 40% correction, the price is now stabilizing and forming a new base support, preparing for its next bullish leg.
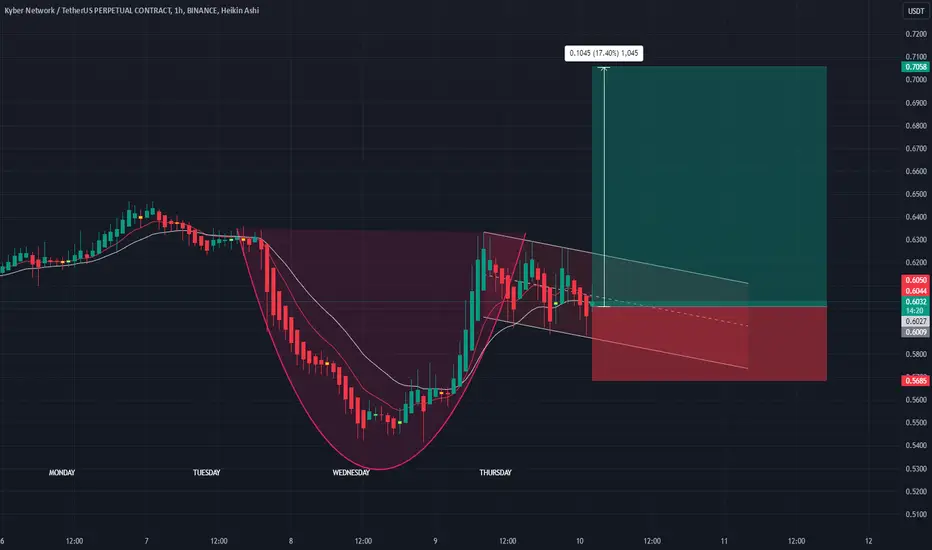
KNC/USDT Analysis - Potential Breakout SetupKNC/USDT Analysis - Potential Breakout Setup 🚀
Hello TradingView Family! 🌟
Here’s an exciting Kyber Network (KNC/USDT) trade setup I’ve been monitoring on the 1H timeframe:
🔹 Pattern: A clear Cup and Handle formation is in play, hinting at a bullish breakout.
🔹 Entry Zone: Positioned just as the price consolidates within the handle, aligning perfectly with a key support zone.
🔹 Target: A potential upside of 17.4% with a target at $0.7058.
🔹 Stop-Loss: Risk is tightly managed below $0.5685.
📌 Key Points to Watch:
Price needs to break and hold above the upper trendline of the handle to confirm the breakout.
Keep an eye on volume surges to validate the move!
Let me know your thoughts on this setup! Are you trading KNC or watching other pairs? Share your insights below. 👇
Happy Trading! 🚀✨
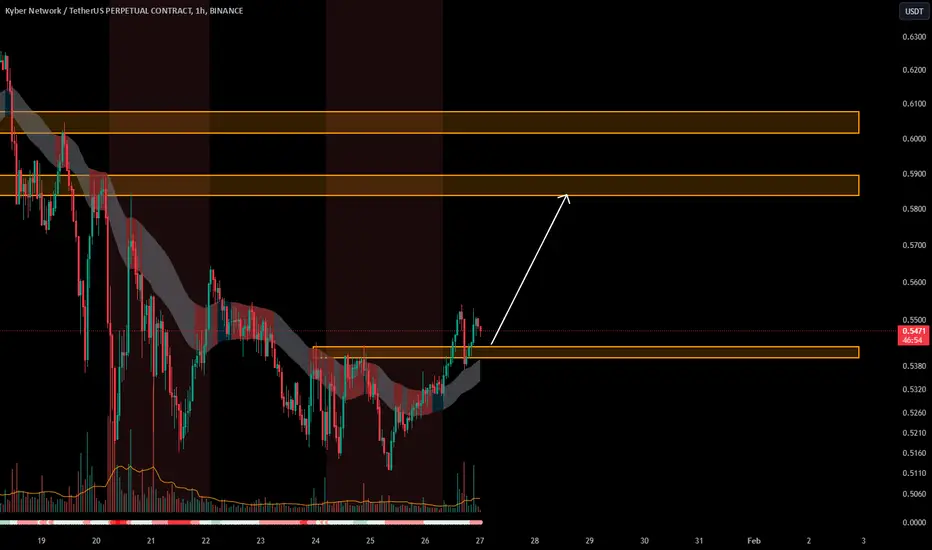
KNC/USDTKey Level Zone: 0.5400 - 0.5430
HMT v5 detected. The setup looks promising, supported by a previous upward/downward trend with increasing volume and momentum, presenting an excellent reward-to-risk opportunity.
HMT (High Momentum Trending):
HMT is based on trend, momentum, volume, and market structure across multiple timeframes. It highlights setups with strong potential for upward movement and higher rewards.
Whenever I spot a signal for my own trading, I’ll share it. Please note that conducting a comprehensive analysis on a single timeframe chart can be quite challenging and sometimes confusing. I appreciate your understanding of the effort involved.
Important Note :
Role of Key Levels:
- These zones are critical for analyzing price trends. If the key level zone holds, the price may continue trending in the expected direction. However, momentum may increase or decrease based on subsequent patterns.
- Breakouts: If the key level zone breaks, it signals a stop-out. For reversal traders, this presents an opportunity to consider switching direction, as the price often retests these zones, which may act as strong support-turned-resistance (or vice versa).
My Trading Rules
Risk Management
- Maximum risk per trade: 2.5%.
- Leverage: 5x.
Exit Strategy
Profit-Taking:
- Sell at least 70% on the 3rd wave up (LTF Wave 5).
- Typically, sell 50% during a high-volume spike.
- Adjust stop-loss to breakeven once the trade achieves a 1.5:1 reward-to-risk ratio.
- If the market shows signs of losing momentum or divergence, ill will exit at breakeven.
The market is highly dynamic and constantly changing. HMT signals and target profit (TP) levels are based on the current price and movement, but market conditions can shift instantly, so it is crucial to remain adaptable and follow the market's movement.
If you find this signal/analysis meaningful, kindly like and share it.
Thank you for your support~
Sharing this with love!
HMT v2.0:
- Major update to the Momentum indicator
- Reduced false signals from inaccurate momentum detection
- New screener with improved accuracy and fewer signals
HMT v3.0:
- Added liquidity factor to enhance trend continuation
- Improved potential for momentum-based plays
- Increased winning probability by reducing entries during peaks
HMT v3.1:
- Enhanced entry confirmation for improved reward-to-risk ratios
HMT v4.0:
- Incorporated buying and selling pressure in lower timeframes to enhance the probability of trending moves while optimizing entry timing and scaling
HMT v4.1:
- Enhanced take-profit (TP) target by incorporating market structure analysis
HMT v5 :
Date: 23/01/2025
- Refined wave analysis for trending conditions
- Incorporated lower timeframe (LTF) momentum to strengthen trend reliability
- Re-aligned and re-balanced entry conditions for improved accuracy
KNC's Critical Support Levels and Future ProjectionsIt seems like KNC is in another bearish pattern, but smaller. It had a fake bullish breakout the previous time, with a shadow to the major support. This time, there's a small shadow to the support, even though it's not strong enough. However, we still could have a bullish breakout because of this as a sign, especially since the long-term resistance line is broken.
If a bullish breakout happens, the first target will be $0.77. Then, we might see a bounce to $0.38. In that case, an H&S pattern will be confirmed, and we will have to wait for the shoulder to be broken, which will be the current support at $0.55. Alternatively, we could go straight to $0.37, again, confirming H&S pattern.
OR
we might see an attempt to break $0.95 and reach new highs with a lower chance of happening
For now, everything is good as long as KNC holds the $0.55 support.
KNC's Critical Support Levels and Future ProjectionsIt seems like KNC is in another bearish pattern, but smaller. It had a fake bullish breakout the previous time, with a shadow to the major support. This time, there's a small shadow to the support, even though it's not strong enough. However, we still could have a bullish breakout because of this as a sign, especially since the long-term resistance line is broken.
If a bullish breakout happens, the first target will be $0.77. Then, we might see a bounce to $0.38. In that case, an H&S pattern will be confirmed, and we will have to wait for the shoulder to be broken, which will be the current support at $0.55. Alternatively, we could go straight to $0.37, again, confirming H&S pattern.
OR
we might see an attempt to break $0.95 and reach new highs with a lower chance of happening
For now, everything is good as long as KNC holds the $0.55 support.