
 Short
ShortCompare with Koma Inu/Tether
Short
KOMAUSDT: Potential 43% CorrectionKOMA is showing bearish pressure. If it fails to reclaim resistance and sellers remain in control, a 43% correction could follow.
Watch for lower highs and sell-volume confirmation. This is a market idea, not financial advice.
Short
KOMAUSDT Forming Bullish MomentumKOMAUSDT is forming a clear bullish momentum pattern, a classic bullish wave signal that often indicates an upcoming breakout. The price has been consolidating within a narrowing range, suggesting that selling pressure is weakening while buyers are beginning to regain control. With consistent volume
Long
KOMAUSDT Forming Bullish MomentumKOMAUSDT is forming a clear bullish momentum pattern, a classic bullish wave signal that often indicates an upcoming breakout. The price has been consolidating within a narrowing range, suggesting that selling pressure is weakening while buyers are beginning to regain control. With consistent volume
Long
KOMA / KOMAUSDT Long Setup | Breaker Block ReclaimMARKET ANALYSIS
KOMA is currently reacting from a key technical area highlighted on the chart.
As long as the protected support zone remains intact, the bullish market structure remains valid and higher liquidity targets may continue to attract price action.
A breakdown below the invalidation
Long
KOMA DEAD CAT BOUNCE OR BREAKOUT?FWB:KOMA The price surge was confirmed by a nearly 10x increase in 24-hour trading volume to $10.6 million. This liquidity spike correlates with a flood of leveraged long signals from trading channels on social media throughout July 30, 2026. The high turnover ratio of 1.61 shows most of the market
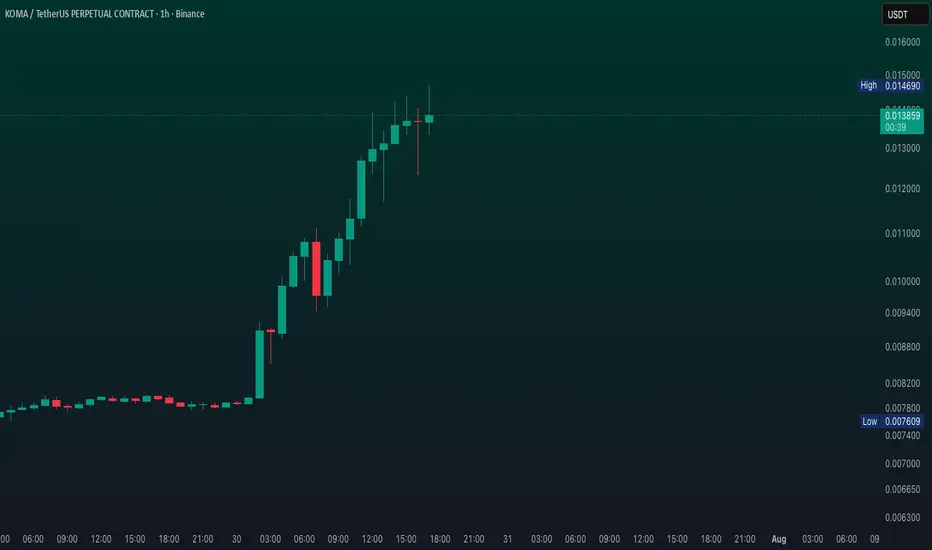
KOMA / KOMAUSDT Long Setup | Breaker Block ReclaimMARKET ANALYSIS
KOMA is currently reacting from a key technical area highlighted on the chart.
As long as the protected support zone remains intact, the bullish market structure remains valid and higher liquidity targets may continue to attract price action.
A breakdown below the invalidation
Long
KOMA Bearish Setup — 50% Correction Ahead? KOMA looks overextended and is showing signs of weakness near resistance.
If key support breaks, a ~50% correction could follow.
Short
Koma Inu · Subtle signals · The Cryptocurrency market is bullishYou know it is not only technical signals coming from a chart that can reveal what comes next, it isn't only about the RSI, the MACD, the volume indicators, the candles, etc. There are many subtle signals that also play an important role and might even be more significant than the usual ones.
For e
Long
KOMABullish Scenario
For the trend to reverse upward, the price must:
Break above 0.0247 USDT
Then break above 0.0388 USDT
Only above 0.0667 USDT can we talk about a true trend reversal
There are long wicks in the chart history, which means short-term pumps are possible.
If a pump occurs, the targ

See all ideas
Summarizing what the indicators are suggesting.
Oscillators
Neutral
SellBuy
Strong sellStrong buy
Strong sellSellNeutralBuyStrong buy
Oscillators
Neutral
SellBuy
Strong sellStrong buy
Strong sellSellNeutralBuyStrong buy
Summary
Neutral
SellBuy
Strong sellStrong buy
Strong sellSellNeutralBuyStrong buy
Summary
Neutral
SellBuy
Strong sellStrong buy
Strong sellSellNeutralBuyStrong buy
Summary
Neutral
SellBuy
Strong sellStrong buy
Strong sellSellNeutralBuyStrong buy
Moving Averages
Neutral
SellBuy
Strong sellStrong buy
Strong sellSellNeutralBuyStrong buy
Moving Averages
Neutral
SellBuy
Strong sellStrong buy
Strong sellSellNeutralBuyStrong buy
Displays a symbol's price movements over previous years to identify recurring trends.
Frequently asked questions
The current price of Koma Inu/Tether (KOMA) is 0.013212 USDT — it has fallen −6.71% in the past 24 hours. Try placing this info into the context by checking out what coins are also gaining and losing at the moment and seeing KOMA price chart.
Koma Inu/Tether price has fallen by −23.58% over the last week, its month performance shows a 76.15% increase, and as for the last year, Koma Inu/Tether has decreased by −45.58%. See more dynamics on KOMA price chart.
Keep track of coins' changes with our Crypto Coins Heatmap.
Keep track of coins' changes with our Crypto Coins Heatmap.
Koma Inu/Tether (KOMA) reached its highest price on Dec 25, 2024 — it amounted to 0.201850 USDT. Find more insights on the KOMA price chart.
See the list of crypto gainers and choose what best fits your strategy.
See the list of crypto gainers and choose what best fits your strategy.
Koma Inu/Tether (KOMA) reached the lowest price of 0.005788 USDT on May 28, 2026. View more Koma Inu/Tether dynamics on the price chart.
See the list of crypto losers to find unexpected opportunities.
See the list of crypto losers to find unexpected opportunities.
The safest choice when buying KOMA is to go to a well-known crypto exchange. Some of the popular names are Binance, Coinbase, Kraken. But you'll have to find a reliable broker and create an account first. You can trade KOMA right from TradingView charts — just choose a broker and connect to your account.
Crypto markets are famous for their volatility, so one should study all the available stats before adding crypto assets to their portfolio. Very often it's technical analysis that comes in handy. We prepared technical ratings for Koma Inu/Tether (KOMA): today its technical analysis shows the buy signal, and according to the 1 week rating KOMA shows the buy signal. And you'd better dig deeper and study 1 month rating too — it's sell. Find inspiration in Koma Inu/Tether trading ideas and keep track of what's moving crypto markets with our crypto news feed.
Koma Inu/Tether (KOMA) is just as reliable as any other crypto asset — this corner of the world market is highly volatile. Today, for instance, Koma Inu/Tether is estimated as 6.85% volatile. The only thing it means is that you must prepare and examine all available information before making a decision.
You can discuss Koma Inu/Tether (KOMA) with other users in our public chats, Minds or in the comments to Ideas.