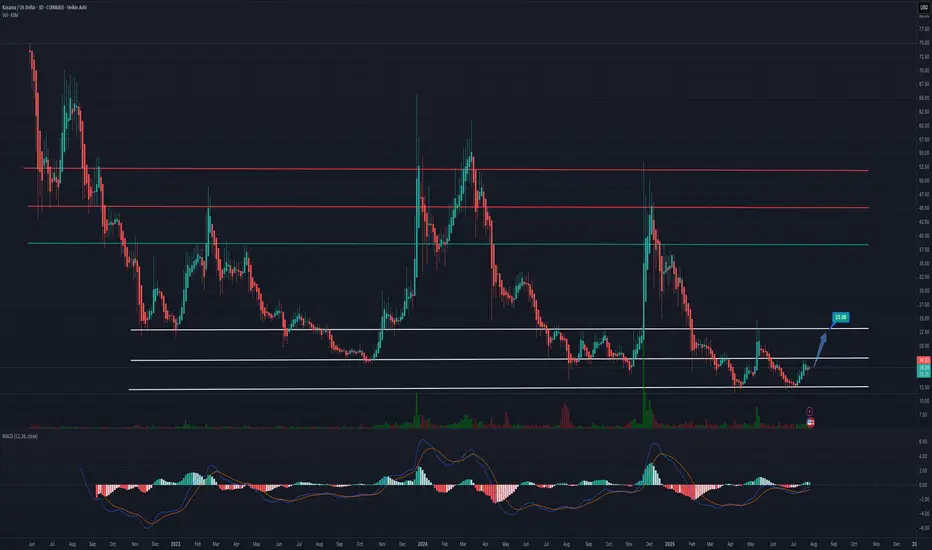
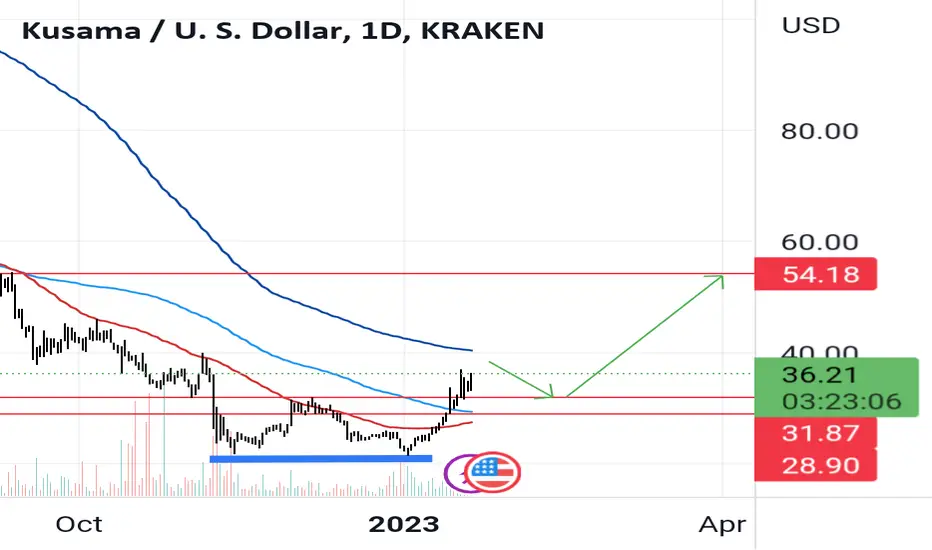
KUSAMA BABAKusama is gonna explode so hard imo. Might even be a NEW ATH sender at some point. What is your opinion on kusama? Longby nico6115
KSMUSDTCurrently trading below trendline and was rejected once. IF able to break this resistance can go to labeled price. Movement depends on BTC price and larger crypto news. Time will tell which way price will really go but I am slightly bullish for now. This is not FA, please DYOR. Thanks.Longby Omaraldo0
Long Trade Setup – KSM/USD!📈 🔹 Asset: Kusama (KSM/USD) 🔹 Timeframe: 30-Minute Chart 🔹 Setup Type: Ascending Triangle Breakout (Bullish Continuation) 📌 Trade Plan (Long Position) ✅ Entry Zone: Around $18.90 (Breakout level above resistance) ✅ Stop-Loss (SL): Below $18.40 (Invalidation and trendline break) 🎯 Take Profit Targets 📌 TP1: $19.45 – Previous resistance zone 📌 TP2: $20.10 – Measured move and next supply level 📊 Risk-Reward Calculation 📉 Risk: $18.90 - $18.40 = $0.50 📈 Reward to TP1: $19.45 - $18.90 = $0.55 → RLongby ProfittoPath1
Kusama will be something- Remember i am not an influencer but a trader. - DYOR before. - invest only what you can lose. Happy Tr4Ding !Longby thecryerUpdated 2034
Kusama Swing TradeHere's another potential 30% swing trade I thought I'd share here. Kusama is showing signs of strength after marking up from TRM and then retracing the 1 Fibonacci. As I shared with my group, despite the abundance of supply the price did not fall back into range, and this leads me to believe KSM has too much value to revisit midline and the old range support. Have fun, be safe in the markets. *Not financial advice Be sure to subscribe to not miss any more swing charts!by jalapablo23
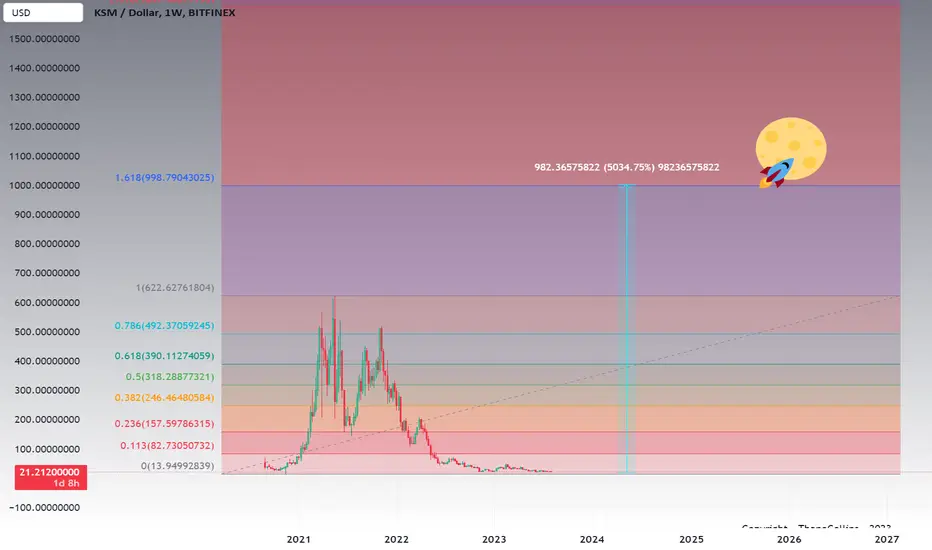
KSM Bullish scenarioKSM fib extension levels based on last move in 2020/2021 and bear market bottom. Not financial advice but great potential based on current price. Longby TheAlias7
ksmusdtit will pump to 2500$ each!!!! do not jump into it the is not financial adviceLongby BitLord_Crypto15
I have no clue of what i am doing... i just like drawing lines.As I delve into the intricate world of chart analysis, I find myself captivated by the timeless beauty of the golden ratio, Phi. With each stroke of my pen, or rather, each click of my mouse, I embark on a journey guided by this divine proportion, seeking harmony amidst the chaos of market fluctuations. The Fibonacci sequence, derived from Phi, manifests itself in the price movements of KSM/USD, offering clues to its underlying rhythm and structure. As I meticulously plot these Fibonacci retracKLongby RSD161812
Target for KSM$43 new target for bullrun is 1000$ Since last bullrun hit about $670 KLongby JoyBoyVegae4
Kusama will drop Hi traders, We expect Kusama to retest the resistance level at 64.95. We believe that this resistance will act as a resistance and the price will get rejected. So then in my opinion, price will start the downward trend until the previous support level. Entry level at 64.5 right after the price hits the resistance, our target is at 56.60 the exact previous support level. Finally, stop loss is at 68.52 to achieve a risk award ratio of 3.87.Shortby vf_investmentUpdated 22
KSM buy on breakout Inverse Head and Shoulders🤪Not financial advice. I'm seeing inverse head and shoulders setup with a breakout point of 41.00 So advice would be to buy on the breakout of 41.00 before any entry. With a clear target of 47.50 to upside. Longby ThinkLikeaWhaleTLAW4
Kusama (KSM): Bulls Gearing To Take Over KSM (Kusama): - 24h price change: +2.79% - 7D price change: +12.45% - Today volume: $2,150,522.26 - Short-term support level: 24.5 - Short-term resistance level: 26.07 - Resonating indicators: MACD, BOLL, RSI When the MACD, Bollinger Bands (BOLL), and RSI indicators are bullish, there is a higher probability of a bullish trend in the next hour. The more indicators that align with a bullish pattern, the higher the accuracy rate. KSM prices are stuck in a sideways movement broaLongby DEXWireNews13
KSM Price PredictionATOM is facing an existential crisis. It rehypothecated its debt, ala Lehmann brother’s, and is issuing a staggering 20–25% APY, with its tokenomics revision. The project, in my opinion, took the spotlight from DOT, during the 2021 bull run. This is why people described DOTas a “nothing-burger” despite the fact that the returns were nearly identical. Both Atom and DOT are interoperability chains, and hence, play in the same field. With DOT offering between 10-15% APY, I view this as a more sustaKby theGREEKFREEKisWEB37
TO 25$YEA MANY WONT BELIEVE AND THEY WILL HODL but the king of all charts MR.WeOOO shows you the right path enjoy the massive dumpKby iamweoUpdated 213
Is KSM Bottoming After H&S ?After recently completing a classic head and shoulders pattern KSM seems to be attempting to bottom. The recent low is a relevant area to the December move up, though I was hoping to visit my lower OB, I think with how oversold we are and being in relevant support. This could be a good area to begin scaling in, keeping in mind we are still waiting for confirmation of BTC bottoming as it will greatly influence alts. Just some food for thought!KLongby Theia_0
KSM Daily Head & Shoulders Possible idea on the daily, testing neckline as of today. The lower yellow horizontal trend-line was a relevant liquidity grab in 2020 would be a great opportunity to retest but is not necessary. Gray line is my conservative Target based also on a 2020 level on the daily chart. Green are additional order block considerations. KShortby Theia_0
LONG TERM ACCUMULATION . long term accumulation between 20-40$ time target : 6-12months for profitLongby mrsftw2814
KSMKSM Short term is Bullish Chart is speaking Break above short term down trend Double Bottom Longby mysender1
Pay Attention...Like many other charts they're just completing a big wave 1-2 sure we can always go lower but it's a great time to be greedy.Longby Swoop614
#KSM/USDT - Long - Potential 29.79#KSM/USDT provided by the pro trader BlockParty SPOT|USDT Strategy: Long Exchange: Multi-Exchange Entry mode: DCA Limit Invest: 5% Exit: Target 3 : 44.19 34.21% Target 2 : 39.98 21.42% Target 1 : 35.65 8.27% DCA Entries Entry 1: 33.93 - 20% Entry 2: 32.95 - 30% Entry 3: 32.51 - 50% Current market price: 33.93 Stop: 29.87 (-9.28%) Technical indicators: 24h Volume: 4370083.26289 Satoshis: 33.93 Bullish bounce from cycle bottom. Oversold RSI. Bullflag breakout. Trade: KSMUSDT 03/11/2022 1Longby CryptoNicho0
crypto long kusumlooks good abv mention levels.kusum against usd buy above mention levela 3:1 rrLongby banknifty7861

 Long