KSM/USDT: Bullish Consolidation Breakout Above Local ResistanceKSM/USDT has broken out of a multi-day consolidation range on the 1-Hour chart following a strong series of Higher Highs (HH) and Higher Lows (HL).
Key Technical Highlights:
Market Structure: Macro trend remains strongly bullish with clear market structure progression (HH & HL).
Range Expansion:
KUSAMA/USD TETHER
No trades
No trades
Compare with KSM/USDT
Open interest
Open interest
Price
Liquidations
Long
Short
Price
KSMUSDT Forming Bullish MomentumKSMUSDT is forming a clear bullish momentum pattern, a classic bullish reversal signal that often indicates an upcoming breakout. The price has been consolidating within a narrowing range, suggesting that selling pressure is weakening while buyers are beginning to regain control. With consistent vol
Kusama (KSM) - turn $5 into $500, is it possible? - May 2026
SYMBOL: BINANCE:KSMUSDT | DIRECTION: LONG | TIMEFRAME: Weekly
Published: May 2026
The weekly chart has just printed three things simultaneously that it has not printed together at any point in KSM’s trading history: a price breakout above its declining channel, an RSI breakout above its own de
KSMUSDT — Descending Channel, Breakout or Fakeout?The KSMUSDT chart on the 4D timeframe shows price action still moving inside a major Descending Channel pattern over the medium to long term. 📉
This structure is formed by a series of:
- 🔽 Lower Highs
- 🔽 Lower Lows
which indicates bearish dominance since the previous peak area. 🐻
Price is curre
KSMUSDT Forming Bullish MomentumKSMUSDT is forming a clear bullish momentum pattern, a classic bullish wave signal that often indicates an upcoming breakout. The price has been consolidating within a narrowing range, suggesting that selling pressure is weakening while buyers are beginning to regain control. With consistent volume
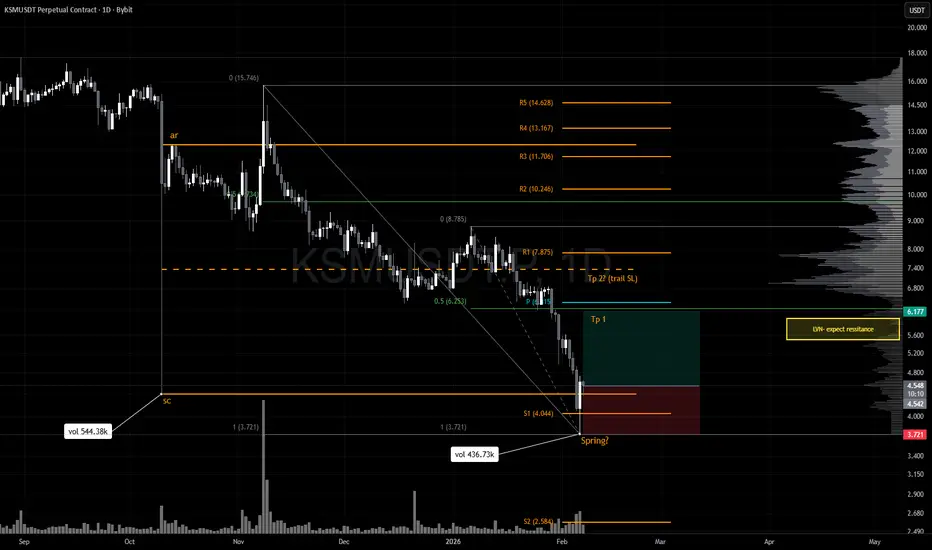
Spring in play? The crypto market just went through another heavy liquidation event, with BTC flushing down to 59k. As expected, altcoins took the brunt of the move with many breaking structural lows and sentiment capitulating.
Even so, a number of alts are now showing tradeable relief‑rally structures. These are
Is #KSM Ready to Recover or will Bears Drag it Further Down? Yello Paradisers! Is #KSM setting up for a nasty flush toward new lows, or are we about to witness a fakeout trap before a bigger move? Here's what the # Kusama chart is showing us:
💎#KSMUSDT is currently trading within a clearly defined symmetrical triangle, with the price consistently being rejec
KSM LONG SIGNAL---
📢 Official Trade Signal – KSM/USDT
📈 Position Type: LONG
💰 Entry Price: 6.893 (Limit Order)
---
🎯 Take-Profit Targets (Partial Exits)
• TP1: 7.164
• TP2: 7.350
• TP3: 7.514
• TP4: 7.680
• TP5: 7.887
• TP6: —
---
🛑 Stop-Loss: 6.720
📊 Timeframe: 15m
⚖️ Risk/Reward Ratio: —
💥 Suggested Lev
KSM (SPOT)BINANCE:KSMUSDT
#KSM/ USDT
Entry range (6.8- 7.6)
SL 4H close below 6.4
T1 8.1
T2 8.5
T3 9.9
T4 11.0
T5 11.7
2 Extra Target are optional 12.8 ,14
_______________________________________________________
Golden Advices.
********************
* collect the coin slowly in the entry range.
* Please
See all ideas
Summarizing what the indicators are suggesting.
Oscillators
Neutral
Oscillators
Neutral
Summary
Neutral
Summary
Neutral
Summary
Neutral
Moving Averages
Neutral
Moving Averages
Neutral
Displays a symbol's price movements over previous years to identify recurring trends.
Frequently asked questions
The current price of KUSAMA/USD TETHER (KSM) is 3.49 USDT — it has risen 0.86% in the past 24 hours. Try placing this info into the context by checking out what coins are also gaining and losing at the moment and seeing KSM price chart.
KUSAMA/USD TETHER price has fallen by −9.79% over the last week, its month performance shows a −30.83% decrease, and as for the last year, KUSAMA/USD TETHER has decreased by −63.03%. See more dynamics on KSM price chart.
Keep track of coins' changes with our Crypto Coins Heatmap.
KUSAMA/USD TETHER (KSM) reached its highest price on Nov 24, 2024 — it amounted to 53.19 USDT. Find more insights on the KSM price chart.
See the list of crypto gainers and choose what best fits your strategy.
KUSAMA/USD TETHER (KSM) reached the lowest price of 2.79 USDT on Aug 14, 2026. View more KUSAMA/USD TETHER dynamics on the price chart.
See the list of crypto losers to find unexpected opportunities.
The safest choice when buying KSM is to go to a well-known crypto exchange. Some of the popular names are Binance, Coinbase, Kraken. But you'll have to find a reliable broker and create an account first. You can trade KSM right from TradingView charts — just choose a broker and connect to your account.
Crypto markets are famous for their volatility, so one should study all the available stats before adding crypto assets to their portfolio. Very often it's technical analysis that comes in handy. We prepared technical ratings for KUSAMA/USD TETHER (KSM): today its technical analysis shows the sell signal, and according to the 1 week rating KSM shows the sell signal. And you'd better dig deeper and study 1 month rating too — it's sell. Find inspiration in KUSAMA/USD TETHER trading ideas and keep track of what's moving crypto markets with our crypto news feed.
KUSAMA/USD TETHER (KSM) is just as reliable as any other crypto asset — this corner of the world market is highly volatile. Today, for instance, KUSAMA/USD TETHER is estimated as 3.21% volatile. The only thing it means is that you must prepare and examine all available information before making a decision.
You can discuss KUSAMA/USD TETHER (KSM) with other users in our public chats, Minds or in the comments to Ideas.