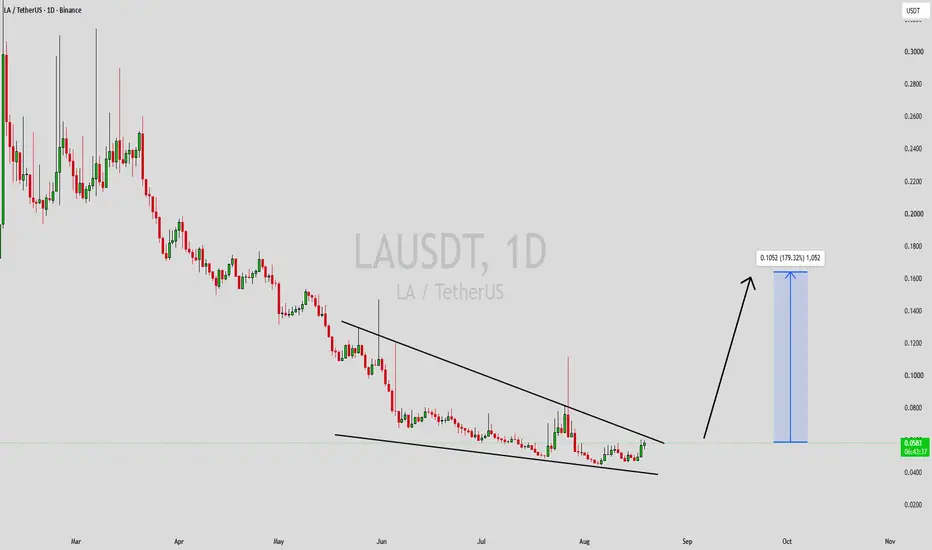
LAUSDT Forming Falling WedgeLAUSDT is forming a clear falling wedge pattern, a classic bullish reversal signal that often indicates an upcoming breakout. The price has been consolidating within a narrowing range, suggesting that selling pressure is weakening while buyers are beginning to regain control. With consistent volume confirming accumulation at lower levels, the setup hints at a potential bullish breakout soon. The projected move could lead to an impressive gain of around 140% to 150% once the price breaks above the wedge resistance.
This falling wedge pattern is typically seen at the end of downtrends or corrective phases, and it represents a potential shift in market sentiment from bearish to bullish. Traders closely watching LAUSDT are noting the strengthening momentum as it nears a breakout zone. The good trading volume adds confidence to this pattern, showing that market participants are positioning early in anticipation of a reversal.
Investors’ growing interest in LAUSDT reflects rising confidence in the project’s long-term fundamentals and current technical strength. If the breakout confirms with sustained volume, this could mark the start of a fresh bullish leg. Traders might find this a valuable setup for medium-term gains, especially as the wedge pattern completes and buying momentum accelerates.
✅ Show your support by hitting the like button and
✅ Leaving a comment below! (What is You opinion about this Coin)
Your feedback and engagement keep me inspired to share more insightful market analysis with you!
In-depth trading ideas
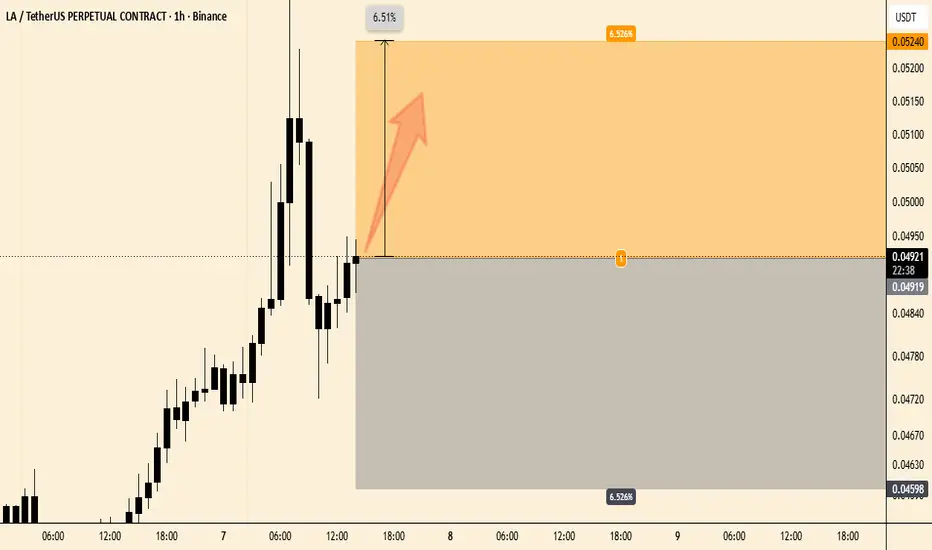
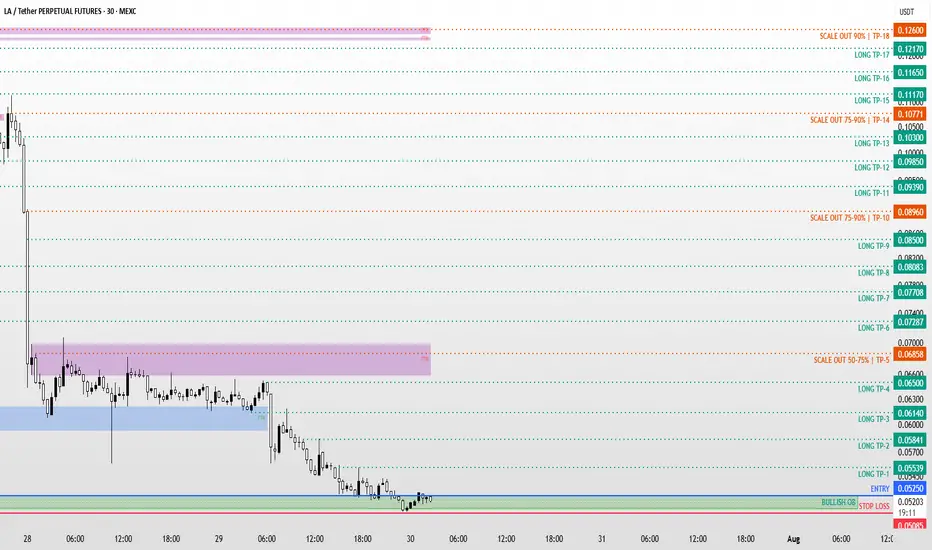
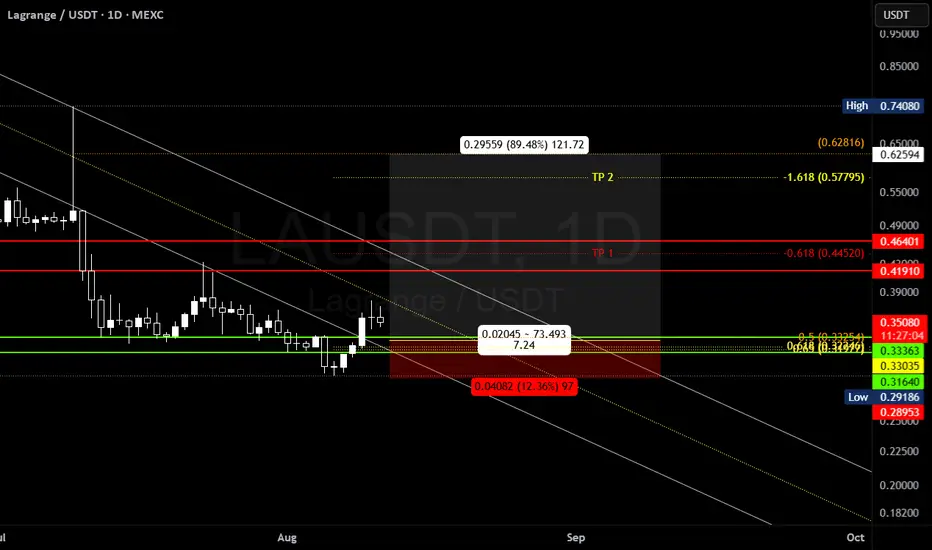
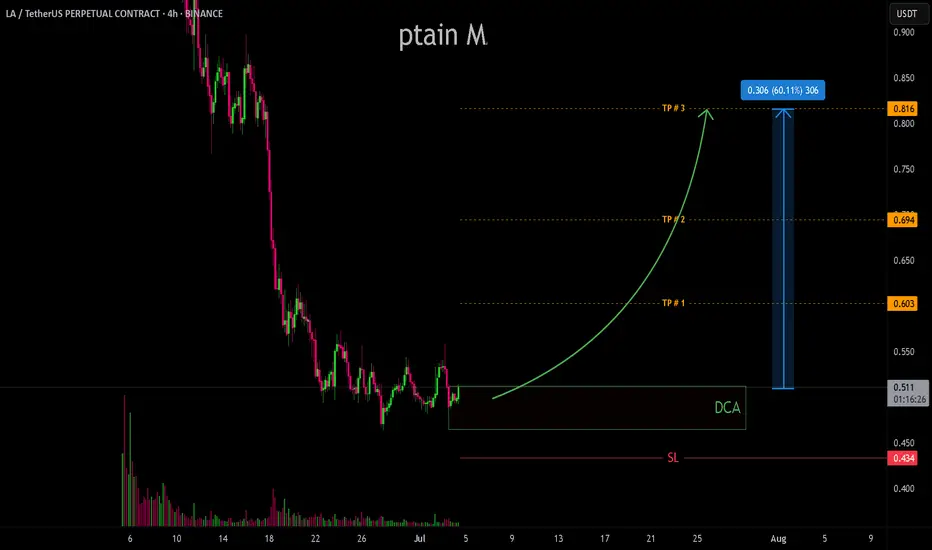
LA / LAUSDT / LAGRANGE Bullish Setup | Futures Trade IdeaMARKET ANALYSIS
LAGRANGE / LAUSDT / LA is currently reacting from a key technical area highlighted on the chart.
As long as the protected support zone remains intact, the bullish market structure remains valid and higher liquidity targets may continue to attract price action.
A breakdown below the invalidation level would weaken the current bullish scenario and require a reassessment of market conditions.
📍 Entry, Stop Loss and Take Profit levels are marked directly on the chart.
━━━━━━━━━━━━━━
⚠️ DISCLAIMER
This publication is provided solely for educational and market observation purposes.
Nothing contained in this analysis should be considered financial advice, investment advice, or a recommendation to buy or sell any financial instrument.
All trading and investment decisions remain solely the responsibility of the individual trader.
Always conduct your own research and apply proper risk management before entering any position.
━━━━━━━━━━━━━━
🎯 PARALOG
▪️Crypto Market Analysis
▪️BTC Futures Signals
▪️Bitcoin & Altcoin Market Analysis
Precision • Momentum • Timing
━━━━━━━━━━━━━━
Exchange: #MEXC Futures
#bitcoin #btc #crypto #futures #technicalanalysis
Black Swan Volume With Both Squeezes Fired and Shorts WreckedLAUSDT trades at 0.25646 with futures at 0.24880, printing a 79.2% bullish structural score across 112 signals classified as deep. The supply-demand split reads 79.1% to 20.9% with buyers dominating at 3.78x intensity. Price has retraced -5.3% with a 23.9% bounce at 4.6x strength, classified as breakout. Both spot and futures squeezes have fired simultaneously. Volume has reached black swan levels. Whales are buying. Shorts are getting liquidated. Leverage sits at the 100th percentile ceiling. This is every signal firing at once.
Price and Bias
Price sits at 83.9% of its measured range between 0.26865 and 0.19464, classified as upper. The -5.3% retrace is moderate and the 23.9% bounce at 4.6x strength has recovered the pullback with conviction. The breakout classification with a BO tag confirms structural validation.
EMA alignment runs 6:1 bullish. Ichimoku prints 7:4 favoring buyers. Candle patterns read 12:2, overwhelmingly bullish. The counter-trend score at 10:4 shows reversal signals are also aligned with the bullish trend rather than opposing it. The spread metric at 58.5% reads deep structural conviction. Three-soldier at 1:0, star at 4:0, engulfing at 2:0, DD/SS at 4:3, and pattern total at 5:0 all lean bullish. No Harami signals are present. Every structural component from EMA to candle patterns to counter-trend signals confirms the bullish framework.
The premium sits at -2.99% in deep backwardation with a Z-score of -1.6. The yield curve implies -3,271% annualized at -1.6 sigma on the bullish side. Standard deviation reads a volatile 1.21% and the mean Z at -1.43 sigma is falling. Futures are trading nearly 3% below spot, meaning derivative traders have not caught up to what spot is doing. That backwardation gap at -1.6 sigma represents significant room for futures to converge upward toward spot price.
Volume and Black Swan Classification
Every volume metric is at extreme levels. Spot volume Z-score reads 5.14, classified as climactic. Futures Z sits at 10.38, classified as black swan. The combined futures-plus-spot reads 9.94, also black swan. These are readings that occur at the far tail of the distribution. A 10.38 Z-score on futures volume is more than ten standard deviations above the mean, a statistical event that effectively should not happen under normal market conditions.
The spot-to-futures classification reads full send, meaning both markets are firing in unison. Dollar flows show 31.72M spot against 220.37M in futures. The futures-to-spot ratio at 6.95x is classified as elevated, high enough to show derivative participation but not at manipulation levels. The spot-to-futures volume split of 123.54M to 858.26M confirms the scale of the event.
Directional flow reads bull dominant. The bull-bear volume Z split at 8.06 versus -0.84 is extraordinary. Bull volume is more than eight standard deviations above its mean. Volume momentum is accelerating at 5.42. The 1-to-5 timeframe volume Z range of 5.14 to -0.28 shows the spike is concentrated on the current timeframe with higher frames still catching up, confirming this is a fresh impulse of historic proportions.
Whale and Liquidation Activity
Whale activity is detected and classified as whale buy. This is the first whale signal across any of the instruments analyzed today. Institutional-scale buying is present and confirmed. Liquidation reads short rekt, meaning leveraged shorts are being forcibly closed and fueling the move higher. The combination of whale buying and short liquidation creates a self-reinforcing upward pressure where forced covering drives price into the buying flow.
Squeeze and Double Fire
Both spot and futures squeezes have fired simultaneously, classified as both fired. This is the maximum squeeze signal. The squeeze divergence previously existed between spot and futures, but with both now releasing in unison, the compression energy is channeling in the same direction. Squeeze momentum expansion reads 132.4% and rising. The double fire on squeezes removes the speculative-only concern that exists when only futures squeeze while spot remains idle.
Momentum reads bullish and rising with Bollinger bandwidth at 15.05%. No squeeze divergence remains since both have fired. OBV Z-score reads 1, classified as inflow with an upward trend. Cumulative flow is positive and building, confirming the volume event is translating into sustained accumulation rather than a single-bar spike. OBV divergence is flagged as bearish, which creates the one cautionary signal in an otherwise unanimously bullish dataset. The bearish OBV divergence means the relationship between price and cumulative volume is showing a disconnect, possibly because the historic volume spike has not fully registered in the cumulative calculation yet.
Leverage and Risk
Leverage reads 6.74x, classified as elevated, with a percentile of 100%, tagged as ceiling. The all-time max of 17.46x sits 714 bars back and the minimum of 0.2x was 12,007 bars ago. Leverage is at the absolute ceiling of its current distribution. Every available unit of speculative capital is deployed. The 100th percentile reading means there is no room for additional leverage to enter. From here, leverage either holds or unwinds.
Scenarios
The momentum extension case is built on the most comprehensive bullish signal set possible. Black swan volume, both squeezes fired, whale buying, short liquidation, bull-dominant flow at 8.06 Z-score, 79.2% structural bull score, 12:2 candle count, 10:4 counter-trend, deep backwardation with room to converge, and OBV inflow. If the volume sustains above climactic levels with the futures premium normalizing from -2.99% toward zero, the breakout extends past the 0.26865 range high into price discovery. The 4.6x bounce strength has structural confirmation, and the whale buy signal adds institutional validation. The targets become the range ceiling and beyond.
The exhaustion reversal scenario exists specifically because of the leverage ceiling and the bearish OBV divergence. A 100th percentile leverage reading with black swan volume and both squeezes fired represents maximum market intensity. These conditions by definition cannot be sustained. When the liquidation fuel exhausts and leverage begins unwinding from the ceiling, the reversal risk is proportional to the intensity of the move. If volume Z collapses from black swan back below 2.0 with OBV divergence deepening and the backwardation premium widening rather than converging, the move reverses hard. Below 0.24 on collapsing volume and leverage unwinding signals the event is over.
Watch Levels
Sustained price above 0.265 with volume Z holding above 3.0 and the premium converging from -2.99% toward -1.0% confirms the breakout extends into new territory. The whale buy signal persisting across subsequent bars would add institutional confirmation. Below 0.24 on volume collapse and leverage unwinding from the ceiling signals the black swan event has peaked and the reversal carries the risk of being equally extreme. The bearish OBV divergence resolving to normal versus deepening determines whether the event has legs or is a single-session phenomenon.
Risk Note
Black swan volume events with both squeezes fired, whale buying, and short liquidation at the 100th leverage percentile are the highest-energy market conditions that exist. They produce the largest moves in the shortest time. They also produce the sharpest reversals when the energy exhausts. The data says this is happening and every signal confirms the direction. The risk is not the direction but the timing of exhaustion. At 100th percentile leverage with black swan volume, the window between continuation and reversal can be measured in bars, not sessions. If you are in this move, manage with the understanding that the exit signal will be a volume collapse, not a structural deterioration. Structure lags events of this magnitude.
More analysis on my profile.
Tags: LAUSDT, LA, volume, blackswan, squeeze, whale, leverage, liquidation, breakout, momentum
LA - Bearish FlagBearish Flag Pattern
A clear bearish flag has formed after a strong impulsive drop. Price is consolidating within an upward-sloping channel, indicating a corrective structure rather than trend reversal. This setup favors a breakdown below the flag support, which would confirm continuation of the bearish trend.
Expectation:
Breakdown from the flag → continuation to the downside.
Targets:
🎯 $0.20 – $0.17 zone as the next major support area.
As long as price remains below the upper boundary of the flag, the bearish scenario remains valid.
LA: Why I am Shorting this +50% Pump (MFI 94.5)While everyone is FOMO buying this +50% candle, I am preparing to short.
Lagrange (LA) has gone parabolic, rallying from $0.18 to $0.31 in 24 hours.
Retail traders see "Momentum."
Smart Money Analysis sees "Extreme Exhaustion."
Here is why this pump is a Bull Trap and where I am looking to enter the short.
__________________________________________________________________________________
1. THE "DANGER" SIGNAL (MFI 94.5) 🛑
We are seeing readings that typically precede a crash.
* RSI: 71.2 (Overbought)
* MFI (Money Flow): 94.5
* What this means: An MFI above 90 is extremely rare. It signals that buying pressure is hyper-extended and the fuel tank is empty. Chasing a pump at MFI 94 is not trading; it is gambling.
2. THE 66-TOUCH CEILING 🧱
Zoom out to the daily chart. We are slamming into a massive structural wall.
* The Resistance: A Descending Trendline active for 213 bars .
* The Level: $0.3100 .
* The Rejection: We just got rejected exactly at this line.
* Structure: Despite the +50% move, we printed a Lower High ($0.2812) . The bearish market structure is still intact.
__________________________________________________________________________________
3. THE TRADE SETUP (The Fade) 📉
We do not short blindly. We wait for the "Bull Trap" confirmation.
The Entry Zone: $0.2900 - $0.2955
* This is the Bearish Order Block . Smart money is likely distributing into this final push.
* Trigger: Watch for a rejection wick or bearish engulfing candle in this zone.
The Target (The Magnet):
* Markets hate unfilled gaps. There is a massive Fair Value Gap (FVG) waiting below at $0.1758 .
* Once the hype dies, gravity takes over.
Invalidation:
* A 4H candle close above $0.3348 flips the structure bullish. If that happens, we step aside.
__________________________________________________________________________________
🎯 SUMMARY
* Trend: Bearish Structure (despite the pump).
* Signal: MFI 94.5 (Exhaustion).
* Plan: Short the rejection at $0.2955 -> Target $0.1758.
Are you chasing the green candle or fading the move?
Vote Below! 👇
A) It's going to the moon! 🚀
B) It's a Bull Trap (Short) 🐻
Lagrange recovers, confirms bullish bias across altcoins market These are smaller projects that I am about to show you but please do read because they too reveal what is happening with the broader market. It lends additional support to our relief rally hypothesis and bullish market bias.
Lagrange —LAUSDT
The main support here is the green line on the chart, it reads "strong support level." On the 31st of January this support level broke, a bearish development.
Today, LAUSDT recovers above this support while leaving behind a cup pattern and perfect double-bottom, a strong bullish development. This is coupled with a really high volume session.
As you can see, the market went bearish just to recover—a stop-loss hunt event. The action moved below support and also below the all-time low just to activate all available stop-loss orders. As soon as this goal was fulfilled, the action moves back above within the previous range.
A failed bearish signal is a bullish signal.
Caution: Bullish confirmation is only valid after a full session close above the "strong support level" shown on the chart. This confirmation can happen today, tomorrow or anytime. Only after it happens we can say LAUSDT is confirmed bullish.
Namaste.
LAUSDT Forming Falling WedgeLAUSDT is forming a clear falling wedge pattern, a classic bullish reversal signal that often indicates an upcoming breakout. The price has been consolidating within a narrowing range, suggesting that selling pressure is weakening while buyers are beginning to regain control. With consistent volume confirming accumulation at lower levels, the setup hints at a potential bullish breakout soon. The projected move could lead to an impressive gain of around 140% to 150% once the price breaks above the wedge resistance.
This falling wedge pattern is typically seen at the end of downtrends or corrective phases, and it represents a potential shift in market sentiment from bearish to bullish. Traders closely watching LAUSDT are noting the strengthening momentum as it nears a breakout zone. The good trading volume adds confidence to this pattern, showing that market participants are positioning early in anticipation of a reversal.
Investors’ growing interest in LAUSDT reflects rising confidence in the project’s long-term fundamentals and current technical strength. If the breakout confirms with sustained volume, this could mark the start of a fresh bullish leg. Traders might find this a valuable setup for medium-term gains, especially as the wedge pattern completes and buying momentum accelerates.
✅ Show your support by hitting the like button and
✅ Leaving a comment below! (What is your opinion about this Coin?)
Your feedback and engagement keep me inspired to share more insightful market analysis with you!
LAUSDT Forming Bullish Momentum LA/USDT is showing signs of building momentum that are definitely worth noting. The token is currently stabilising after a pull-back, and we’re starting to see volume pick up—indicating that accumulation may be underway and sentiment could be shifting. From a technical viewpoint, the setup is looking like a turnaround in progress.
On the fundamentals side, LA is positioning itself in the emerging AI-blockchain convergence space—keywords like decentralised AI infrastructure, chain-agnostic AI, and tokenised computing are showing increasing search interest. With a small circulating supply of 1 million tokens and a market cap under US$30 k at the moment, the project is still very early stage, which means upside can be meaningful if adoption starts to trend.
From a trading perspective, what I’m looking for is a breakout above the recent range high, confirmed by strong volume and follow-through price action. If that breakout holds, the reward-to-risk scenario could be very compelling given the small base and growing interest. Entry could be considered on breakout or on a retest of the breakout level, with a stop placed below the most recent swing low to manage risk.
LAUSDT Forming Bullish momentumLAUSDT is currently showing a bullish momentum pattern, signaling a strong potential continuation of its upward trajectory. This setup reflects growing strength among buyers and a shift in sentiment that could drive prices significantly higher. The chart suggests that LAUSDT may be gearing up for a substantial breakout phase, supported by a good volume base that confirms genuine participation from market players. With expectations of a 70% to 80%+ potential gain, this setup is attracting attention from traders looking for mid-term growth opportunities.
Bullish momentum patterns like this typically emerge after a period of consolidation, where buying pressure starts to outweigh selling activity. LAUSDT’s current structure highlights the formation of higher lows and stable resistance testing—key signals that an upward continuation could be imminent. Technical traders often look for such patterns as confirmation of renewed market strength, particularly when backed by consistent trading volume and improving sentiment.
Investor interest in LAUSDT has been rising, indicating growing confidence in the project’s potential and underlying fundamentals. This accumulation phase may lead to a strong rally once the momentum gains traction, potentially pushing prices toward higher resistance zones. The combination of positive volume dynamics and bullish chart behavior makes LAUSDT a crypto pair worth monitoring closely in the coming days.
✅ Show your support by hitting the like button and
✅ Leaving a comment below! (What is You opinion about this Coin)
Your feedback and engagement keep me inspired to share more insightful market analysis with you!
LAUSDT UPDATE#LA
UPDATE
LA Technical Setup
Pattern: Bullish falling wedge breakout
Current Price: $0.4498
Target Price: $0.625
Target % Gain: 45.12%
TSXV:LA has confirmed a breakout from a bullish falling wedge pattern on the 1D timeframe. With the current price at $0.4498, the next potential target lies near $0.625, showing about 45% upside potential. This breakout suggests renewed momentum and potential for further continuation.
Time Frame: 1D
Risk Management Tip: Always use proper risk management.
LAUSDT Forming Inverse Head And ShoulderLAUSDT is currently forming an inverse head and shoulders pattern, which is one of the most reliable bullish reversal signals in technical analysis. This setup often marks the transition from a downtrend into a potential strong uptrend, suggesting that buyers are regaining control of the market. With projected gains of 70% to 80%+, traders are closely monitoring this formation as it could open doors to substantial opportunities in the coming sessions.
The trading volume is holding at healthy levels, adding strength to the ongoing bullish structure. Consistent volume during the development of this pattern validates market interest and helps confirm the possibility of a successful breakout above the neckline. When volume aligns with a reversal signal like this, it increases the probability of strong price continuation.
Investors have already started showing increased interest in this project, which reflects growing confidence in its potential upside. As market sentiment shifts, LAUSDT could see accelerated momentum once the neckline breakout occurs, fueling demand and pushing prices toward higher resistance levels.
✅ Show your support by hitting the like button and
✅ Leaving a comment below! (What is You opinion about this Coin)
Your feedback and engagement keep me inspired to share more insightful market analysis with you!
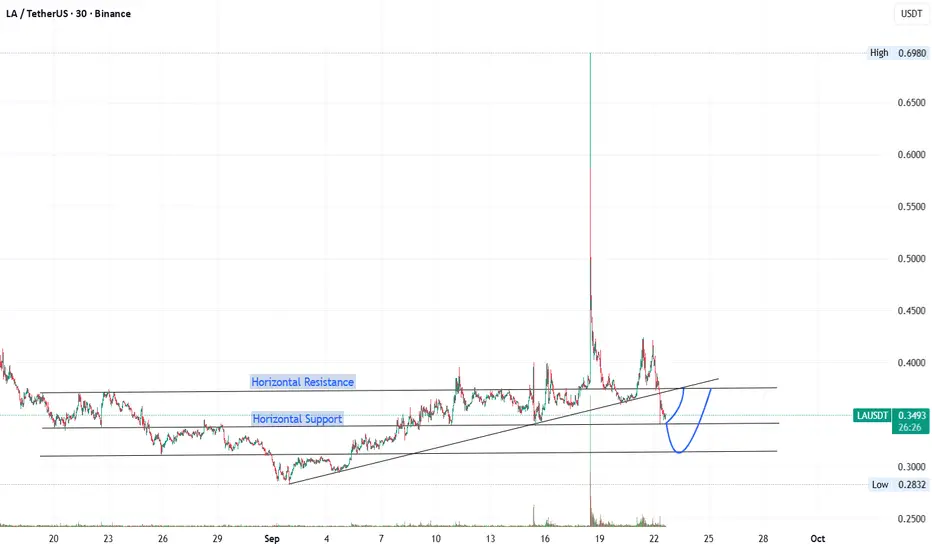
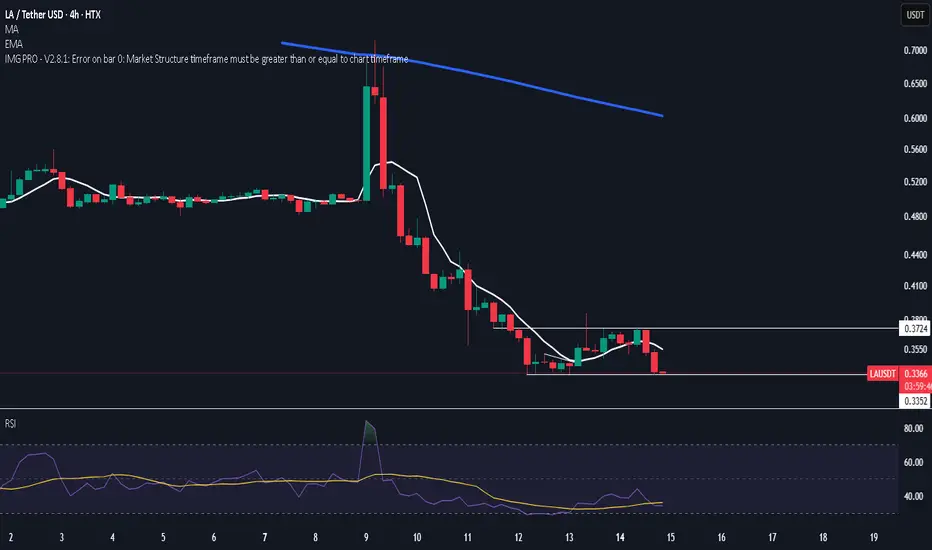
Price is testing the horizontal support after breaking TLSupport levels: You’ve correctly marked two horizontal supports. The lower one around 0.283 (recent low) and the higher one around 0.34–0.35 zone.
Trendline: There’s a clear ascending trendline, which price briefly broke below before bouncing back.
Volume spike: That huge wick up to 0.6980 looks like a liquidity grab or abnormal spike, not a sustained move.
Current structure: Price is testing the horizontal support at ~0.34 after breaking trendline support. Your curved arrow suggests a rebound from support back toward resistance.
Bullish scenario: Hold above 0.34 → retest 0.38–0.40 area.
Bearish scenario: Lose 0.34 → likely retest 0.28.
LAUSDT Forming Bullish WaveLAUSDT is currently displaying a bullish wave pattern on the chart, signaling a strong continuation setup that may lead to a significant upside breakout. This wave formation often suggests growing momentum and accumulation, where each successive pullback is followed by a higher low. Combined with strong volume inflows, the technical structure supports a bullish thesis in the short to mid-term.
The price is steadily climbing, forming clear impulsive waves with corrective pullbacks—indicating that buyers are consistently stepping in. This kind of bullish wave pattern, especially when supported by volume and investor activity, often precedes large moves. The current projection shows potential gains of 80% to 90% if price follows through with the wave structure and breaks above key resistance levels.
LAUSDT has started gaining attention among traders due to its technical clarity and well-defined trend behavior. With the crypto market entering a more optimistic phase, setups like this become increasingly reliable. Traders and investors are advised to monitor wave continuation, breakouts above recent highs, and overall volume confirmation to time entries effectively.
✅ Show your support by hitting the like button and
✅ Leaving a comment below! (What is You opinion about this Coin)
Your feedback and engagement keep me inspired to share more insightful market analysis with you!
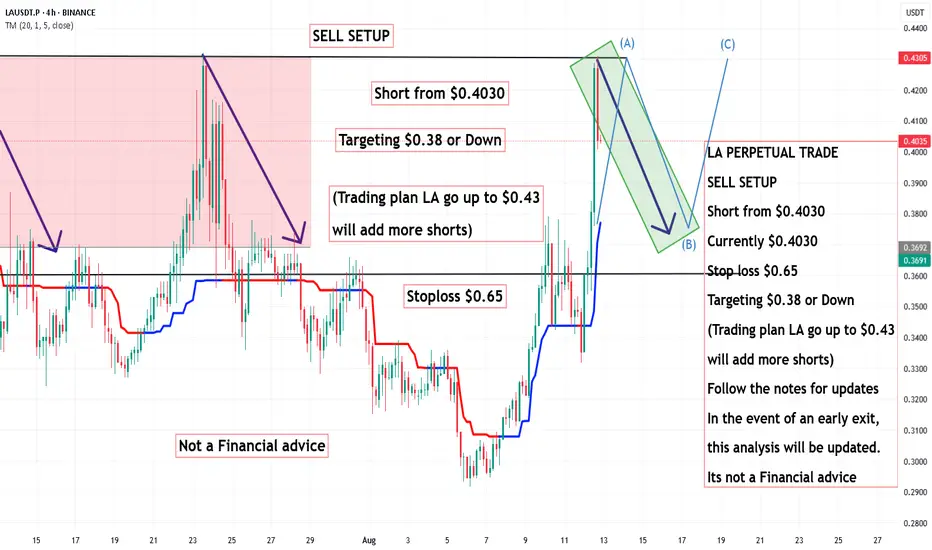
LA PERPETUAL TRADE , Short from $0.4030LA PERPETUAL TRADE
SELL SETUP
Short from $0.4030
Currently $0.4030
Stop loss $0.65
Targeting $0.38 or Down
(Trading plan LA go up to $0.43
will add more shorts)
Follow the notes for updates
In the event of an early exit,
this analysis will be updated.
Its not a Financial advice
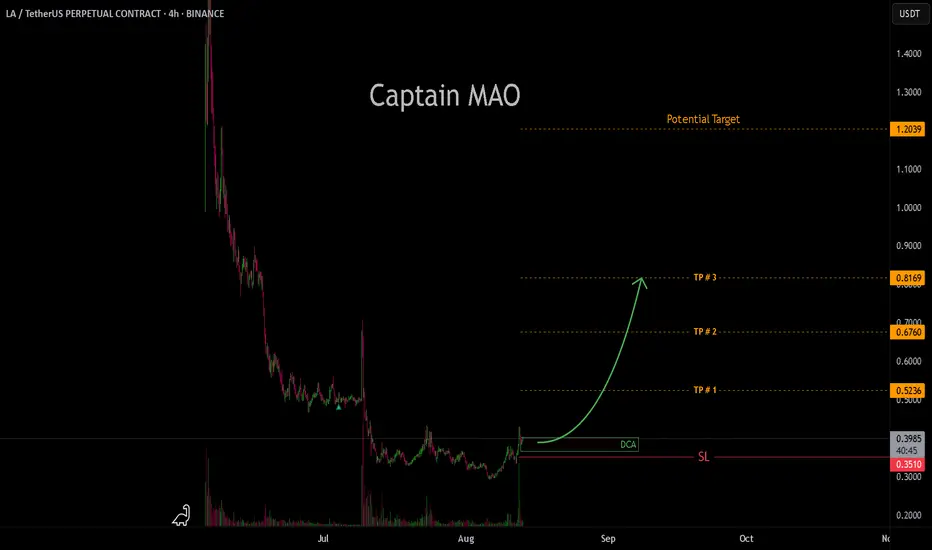
LA/USDT lets go !!The recent sweep below previous support appears to have marked the final low, with buyers stepping in aggressively to reclaim key levels. Price action is showing strong bullish intent, suggesting the reversal phase is underway. Holding current momentum could trigger a sustained move toward higher targets as the market shifts back in favor of the bulls.
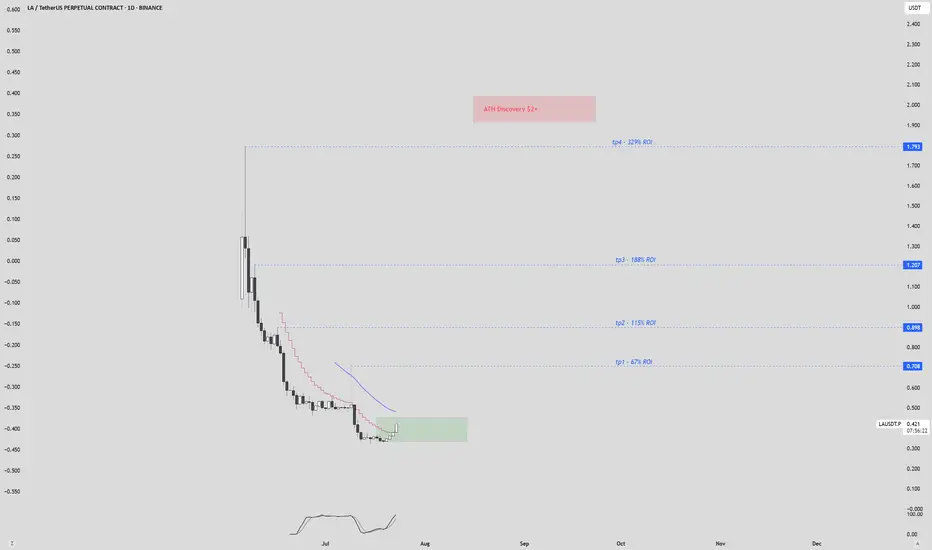
Lagrange $LA - post TGE dump recoverySwift path en route $1+
Kept super simplified:
Buy sub $0.50
TPs provided on the chart
Sell $1.9-$2+
Good VCs funded
One of the first on the market in ZKP category next to RISC0, and Succinct that received even more funding --> higher FDV launch target (would imply LA becoming heavily underpriced or becoming a beta play to higher listed FDV competitors later this year)
LA/USDT 50-60% move LA/USDT has successfully found solid support after a prolonged downtrend and is showing early signs of a potential reversal. The price has established a strong base, indicating accumulation in the current range. With volume gradually picking up and market sentiment shifting, LA is now poised for a breakout and trend continuation move.
We're looking at a potential upside of 50–60% from the current level if the setup plays out as expected.