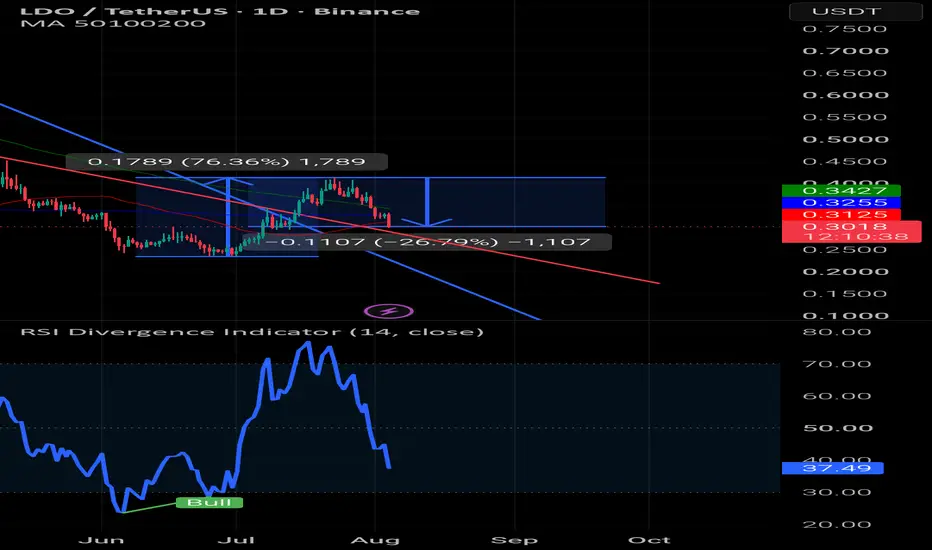
LDOUSDT Forming Bearish MomentumLDOUSDT is showing a clear shift in its recent price structure, with sellers starting to gain the upper hand after a period of sideways movement. The price had been holding around a familiar zone for some time, but the latest move below that area suggests that LDOUSDT may be entering a deeper correction. Looking closely at the LDOUSDT chart, the recovery attempts were becoming weaker, while the price continued forming lower highs. This gradual loss of buying strength eventually pushed LDOUSDT be
Lido DAO Token/Tether
No trades
No trades
In-depth trading ideas
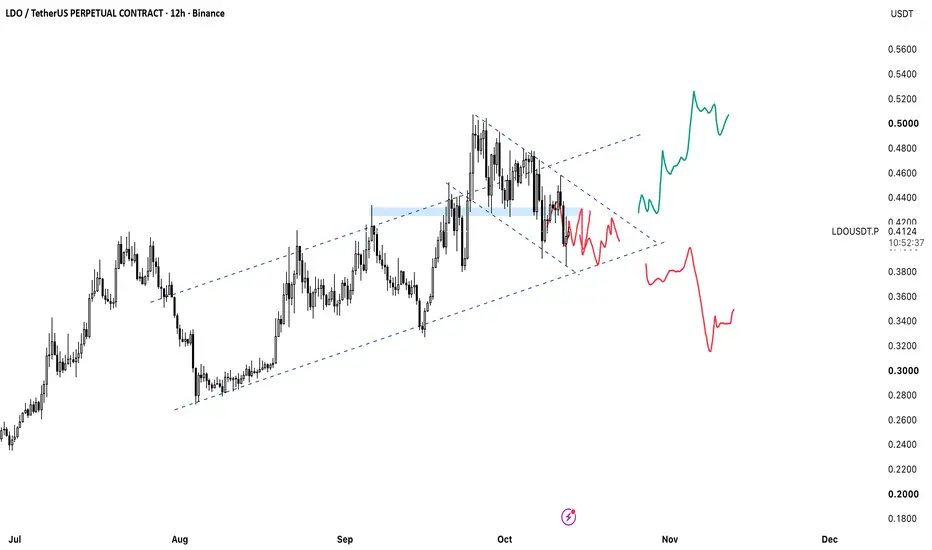
LDO USDT 12H Technical Analysis – Lido DAO Price StructureLDO/USDT perpetual is currently trading around a key decision zone on the 12-hour timeframe.
Price is sitting near important structure after the recent move, with clear parallel trendlines defining the overall channel. A horizontal level near 0.4230 is acting as a major reference point.
Two scenarios are mapped:
Bullish continuation if price holds current structure and breaks higher (green path)
Bearish breakdown if support fails (red path)
This LDO chart shows a clean technical setup with def
LDOUSDT Major Update. Parallel Channels, Upcoming Big MoveLDOUSDT Update on the 12 hour timeframe.
We are uptrending on the midterm, inside of an incline parallel channel.
We are downtrending on the short term, inside of a declining parallel channel.
Soon, we are going to squeeze out and go for a big move, to the upside, or to the downside. That will be a trading setup for us.
LDO/USDT — Long Setup | 1HLDO is currently trading well above the area I am interested in, so I am not chasing the move.
My main long zone remains 0.3819–0.3910. This area has already acted as a strong base and produced meaningful buyer reactions in the past.
Entry 1: 0.3910
Entry 2: 0.3819
Invalidation / Stop: 0.3621
Risk: 1%
Potential: 3–30%
The logic is based on a return into an old demand structure after price has moved significantly away from it.
If buyers defend the area again, it gives a much cleaner long locatio
LDOUSDT - Trade Analysis (M15 Entry / H1 Bias)H4 Context: Price broke out cleanly above the purple resistance zone (0.4035-0.4179) that had held for weeks. This is a confirmed breakout on H4. Alligator on H4 is fanning up strongly, price well above all three lines. RSI at 75 with momentum intact.
H1 Bias: Bullish. Alligator lines fanning up, price above all lines. HH/HL structure confirmed. RSI pushed to 74 on H1 before the current pullback. The pink box (0.4024-0.4179) is the retest zone of the broken purple resistance, now acting as supp
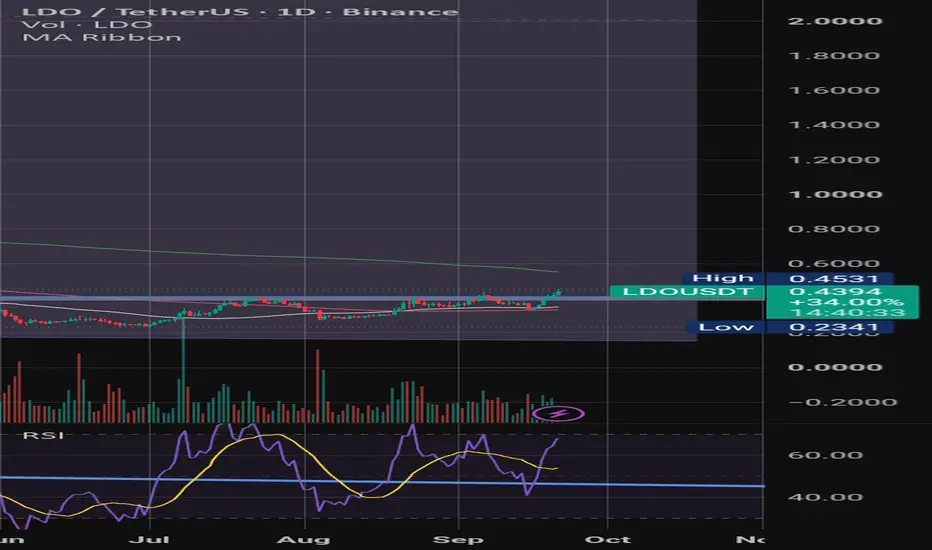
LDO Approaches a Decisive Resistance — Breakout or Rejection?📊 Technical Analysis — LDO/USDT
💵 Coin: MIL:LDO
⏳ Time Frame: 2D
📐 Pattern: Descending Trendline / Long-Term Bearish Structure
📍 Current Price: around $0.387
🎯 Key Breakout Zone: $0.400 – $0.445
📉 Descending Trendline Structure
MIL:LDO is still trading below the descending trendline, which has acted as dynamic resistance since the major high around $1.60.
This yellow trendline has repeatedly limited previous recovery attempts, indicating that sellers remain in control of the broader stru
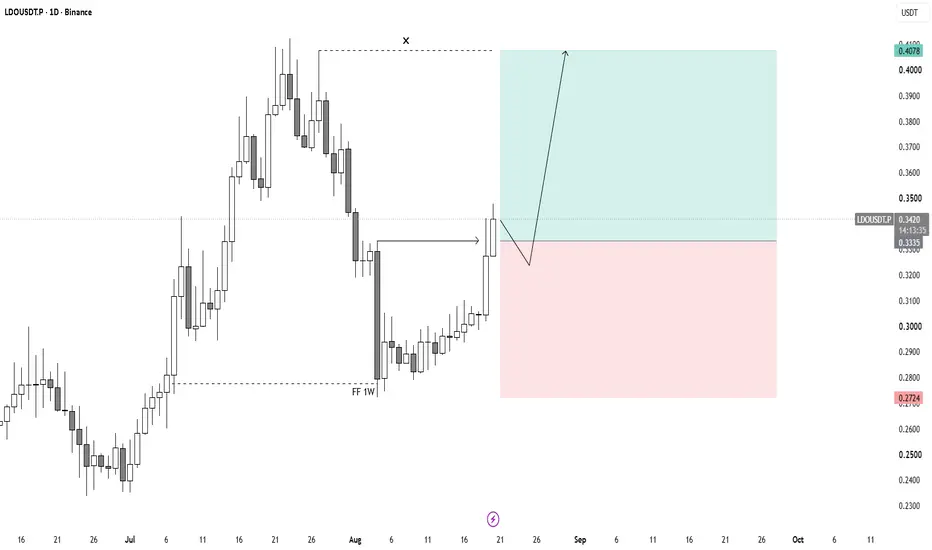
LDO | 1D LONG* Context (HTF): Full Weekly FVG fill in a HTF Discount Market.
* Setup (LTF): Sharp and impulsive minor Break of Structure (mBOS) confirmed.
* Execution (Entry): Looking for a retest of the impulsively broken high.
* Stop Loss: Below the structural swing low.
* Targets: External Buy Side Liquidity (BSL) pools.
LDO/USDT H2: Weak impulse amid expectations🎯 TP1: $0.296900 (+1.79%) │ TP2: $0.294672 (+2.52%)
🛑 SL: $0.310079 (-2.57%) │ R/R: 1 : 0.98
⚠️ Stop is wider than TP2 target (R/R < 1) — the closer target is hit more often, but adjust position size according to stop loss.
FUNDAMENTAL BACKGROUND
LDO is moving in a weak technical mode with no independent catalysts. Geopolitical tensions around Iran further limit risk appetite, especially in altcoins.
TECHNICAL PICTURE
Price $0.302300 is testing the upper boundary of the $0.278900–$0.307900 ran
Crypto Lido : A Tactical Bottoming Setup - Confirmed Reversal?LIDOUSD / Lido has suffered a prolonged structural decline, falling from above $4 to roughly $0.33. The 3-week chart is finally showing early signs of stabilization, but this remains a high-risk tactical setup, not a full trend-reversal signal.
Master Buy Scanner V2
Score: 3/3
Decision: TACTICAL
Entry quality: GOOD — 75%
Setup maturity: CONFIRM
Position size: STARTER 25%
Band 1: GREEN
Combined band: GREEN 5/10
Bands synchronized: YES
WT1 / WT2: -43.04 / -44.31
Cycle confirmation: NO
Formal BUY
LDO: local squeeze with $0.4536 destinationThe Macro Picture 🗺️
LDO based through late June and has recovered to $0.3563, building higher lows off the $0.2846 local low. Price is rotating in the upper half of the range with buyers back in control — a base rebuilding, not a breakdown.
The Setup ⚙️
The Range Floor 🟢
$0.2846 (Local Low) is the demand shelf the recovery is built on, with $0.2338 (Macro Support) as the deeper backstop. As long as $0.2846 holds on pullbacks, the bid stays intact.
The Decision Point 🔴
$0.4705 (Local High) is
LDO USDT SHORT SIGNAL#140. LDO/USDT – Trade Setup (SHORT)
📈 Position Type:
🕒 Timeframe: 1H
📊 Market: Futures
💰 Entry Zone:
0.3825
0.3983
🛑 Stop-Loss:
0.4088
🎯 Take-Profit Targets:
• TP1: 0.37
• TP2: 0.3516
• TP3: 0.3280
• TP4: 0.30
⚙️ Leverage:
5*10
▫️ After TP1, move SL to Entry + 0.2%.
▪️ Exit Plan:
• 40% at TP1
• 20% at TP2
• 20% at TP3
20%. at. TP4
📌 Risk Management:
Risk only 1–2% of your capital per trade.
⚠️ Always check and confirm the setup on your chart before entering the trade.
LDO USDT SHORT SIGNAL#86. LDO/USDT – Trade Setup (SHORT)
📈 Position Type: SHORT
🕒 Timeframe: 1H
📊 Market: Futures
💰 Entry Zone:
.MARKET
🛑 Stop-Loss:
0.3760
🎯 Take-Profit Targets:
• TP1: 0.3524
• TP2: 0.3405
• TP3: 0.3265
• TP4:
⚙️ Leverage:
5 *10
▫️ After TP1, move SL to Entry + 0.2%.
▪️ Exit Plan:
• 50% at TP1
• 25% at TP2
• 25% at TP3
📌 Risk Management:
Risk only 1–2% of your capital per trade.
⚠️ Always check and confirm the setup on your chart before entering the trade.
LDO USDT SHORT SIGNAL#80. LDO/USDT – Trade Setup (SHORT)
📈 Position Type: SHORT
🕒 Timeframe: 1H
📊 Market: Futures
💰 Entry Zone:
0.3677
🛑 Stop-Loss:
0.3770
🎯 Take-Profit Targets:
• TP1: 0.3582
• TP2: 0.3470
• TP3: 0.3328
• TP4:
⚙️ Leverage:
5 *10
▫️ After TP1, move SL to Entry + 0.2%.
▪️ Exit Plan:
• 50% at TP1
• 30% at TP2
• 20% at TP3
📌 Risk Management:
Risk only 1–2% of your capital per trade.
⚠️ Always check and confirm the setup on your chart before entering the trade.
⚠️
LDO: local squeeze with $0.40 destinationThe Macro Picture 🗺️
LDO put in a violent structural reset — the May $0.47 highs unwound all the way to $0.24 by early July, a flush deep enough to push RSI into oversold and exhaust the sellers. What followed changed the complexion of the tape entirely: an aggressive V-recovery that reclaimed the $0.28 shelf and drove RSI up toward 70. That kind of impulsive move off a base is how downtrends end and fresh legs begin. Price is now consolidating the breakout at $0.335, holding well above the rec
LDOUSDT Forming Bullish MomentumLDOUSDT is forming a clear bullish momentum pattern, a classic bullish wave signal that often indicates an upcoming breakout. The price has been consolidating within a narrowing range, suggesting that selling pressure is weakening while buyers are gradually regaining control. With consistent trading volume confirming accumulation at lower levels, the current setup hints at a potential bullish breakout in the near term. The projected move could lead to an impressive gain of around 70% to 80% once
LDO USDT LONG SIGNAL# 69 LDO./USDT – Trade Setup (LONG)
📈 Position Type: LONG
🕒 Timeframe: 1 H
📊 Market: Futures
💰 Entry Zone:
0.3156
🛑 Stop-Loss:
0.3045
🎯 Take-Profit Targets:
• TP1: 0.3225
• TP2: 0.3310
• TP3: 0.34
• TP4: 0.35
TP5:
TP6:
⚙️ Leverage:
5- 10
⚠️ After reaching TP1, move Stop-Loss to Entry Price.
📌 Risk Management:
Risk only 1–2% of your capital per trade.
Always confirm the setup on your chart before entry
LDO: short at resistance looks tempting — why the flow says pass🧭 WHERE WE ARE
LDO is pushing into a 4H resistance level after a sharp rally — up hard over the last
hour and up sharply more on the day. A purely mechanical read of "price at resistance"
flags a short here. But a level by itself isn't a signal.
📊 WHAT FLOW SAYS
There's no rejection at the level — price is still grinding higher INTO it, which is a
different animal from a stall or a rejection wick. Underneath, this looks like a short
squeeze: short liquidations are running hot while longs are ba