LINEA: Bottom consolidation continues, no new lows (Easy 670%) It isn't a crazy prediction. Just look at the downtrend... I don't know exactly when, but the same will happen in reverse. LINEAUSDT.
Consolidation has been happening at bottom prices as trading volume goes down to zero. When volume completely dries out, a sudden move tends to be close. I am callin
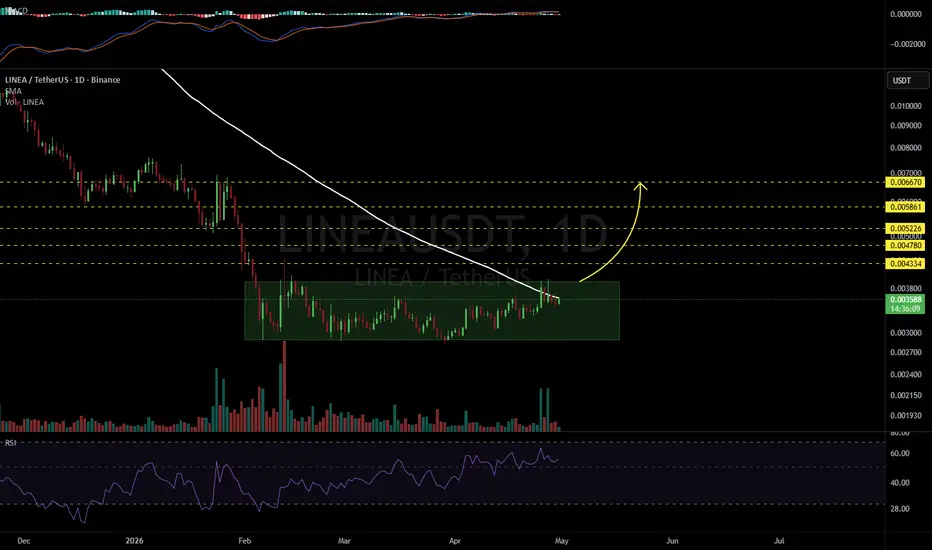
LINEAUSDT 1D#LINEA is moving within a range and testing the daily SMA100. It is also breaking above the Ichimoku cloud, which looks promising. In case of a confirmed breakout above the SMA100, the potential upside targets are:
🎯 $0.004334
🎯 $0.004780
🎯 $0.005226
🎯 $0.005861
🎯 $0.006670
⚠️ Always remember to u
LINEAUSDT 12H#LINEA has been consolidating within a box on the 12-hour chart for several months and is currently testing the 12H SMA200. Keep an eye on it. In case of a breakout above the SMA200, the potential upside targets are:
🎯 $0.004328
🎯 $0.004775
🎯 $0.005222
🎯 $0.005858
🎯 $0.006669
⚠️ Always remember to
Linea at bottom, opportunity buy zone active (1,582% New ATH)The highest volume ever appeared first in December—mid-December 2025—strong buying; showing that something is up, something is coming, something is happening.
The market continues lower.
LINEAUSDT continued to drop even after the highest volume ever with a bullish close. Come early February 2026,
Linea at bottom, opportunity buy zone active (1,582% New ATH)The highest volume ever appeared first in December—mid-December 2025—strong buying; showing that something is up, something is coming, something is happening.
The market continues lower.
LINEAUSDT continued to drop even after the highest volume ever with a bullish close. Come early February 2026,
LINEAUSDT – at Key Support, Reversal or Further Breakdown?On the 1D timeframe, the price action of LINEA against Tether is still in a strong downtrend, clearly indicated by the descending trendline (yellow line).
Currently, price is entering a tight consolidation phase (compression) right at a key demand zone, marked by the yellow block in the 0.0032 – 0.
LINEA Breaking Out of Compression StructureLINEA has been consolidating after a prolonged downtrend, forming a compression structure with higher lows while testing horizontal resistance near 0.0033–0.0034. This tightening price action suggests that momentum is building for a directional move.
Price is currently attempting to break above the
LINEA BUYER INTEREST INCREASED🔥 Fortune AI Radar — CRYPTOCAP:LINEA
Fresh activity detected on CRYPTOCAP:LINEA today.
Data suggests increasing market interest & buyers stepping in.
Technicals currently lean bullish, with momentum trending upward.
Whales showing hints of accumulation and hype rising among trader
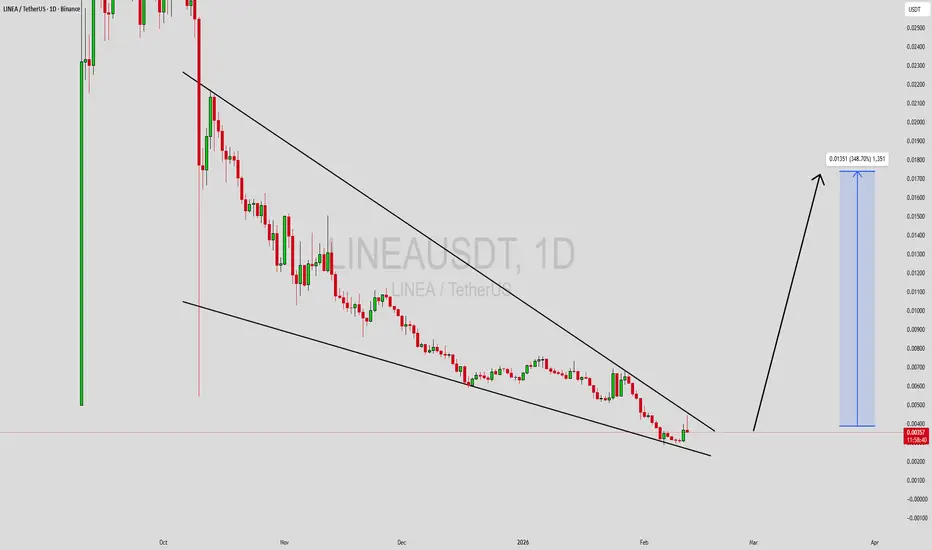
LINEAUSDT Forming Falling WedgeLINEAUSDT is forming a clear falling wedge pattern, a classic bullish reversal signal that often indicates an upcoming breakout. The price has been consolidating within a narrowing range, suggesting that selling pressure is weakening while buyers are beginning to regain control. With consistent volu
See all ideas
Summarizing what the indicators are suggesting.
Oscillators
Neutral
SellBuy
Strong sellStrong buy
Strong sellSellNeutralBuyStrong buy
Oscillators
Neutral
SellBuy
Strong sellStrong buy
Strong sellSellNeutralBuyStrong buy
Summary
Neutral
SellBuy
Strong sellStrong buy
Strong sellSellNeutralBuyStrong buy
Summary
Neutral
SellBuy
Strong sellStrong buy
Strong sellSellNeutralBuyStrong buy
Summary
Neutral
SellBuy
Strong sellStrong buy
Strong sellSellNeutralBuyStrong buy
Moving Averages
Neutral
SellBuy
Strong sellStrong buy
Strong sellSellNeutralBuyStrong buy
Moving Averages
Neutral
SellBuy
Strong sellStrong buy
Strong sellSellNeutralBuyStrong buy
Displays a symbol's price movements over previous years to identify recurring trends.