LINEA: Bottom consolidation continues, no new lows (Easy 670%) It isn't a crazy prediction. Just look at the downtrend... I don't know exactly when, but the same will happen in reverse. LINEAUSDT.
Consolidation has been happening at bottom prices as trading volume goes down to zero. When volume completely dries out, a sudden move tends to be close. I am calling for a bullish breakout based on the fact that the downtrend was broken long ago, and the retrace is showing waning momentum.
A challenge of the last low is possible, a stop-loss hunt event. We see this very often and it shouldn't change the bigger picture and what we expect will happen—a major bullish wave.
We visited this same chart months ago and it stays the same, this is good. When the market is bearish, it moves lower and lower. Seeing months of sideways with a slightly bullish bent is a positive. Not to mention that again today many projects started to move with force, out of the blue.
I mean, everything was quiet, Bitcoin is doing its retrace, everything slowed down and today we see projects again breaking up two to three digits green. But these are not the same projects that moved last week or the week before, a new group and the market continues to cycle.
This one is trading at support and can move in the near future.
Choosing the bottomed out trading pairs opens up the strategy of low risk vs a high potential for reward. Risk can be capped at 5%, 10%, 20% and so on. The easy target here is 670% and it can go even higher long-term.
So, what will you do?
Thank you for reading.
Namaste.
In-depth trading ideas
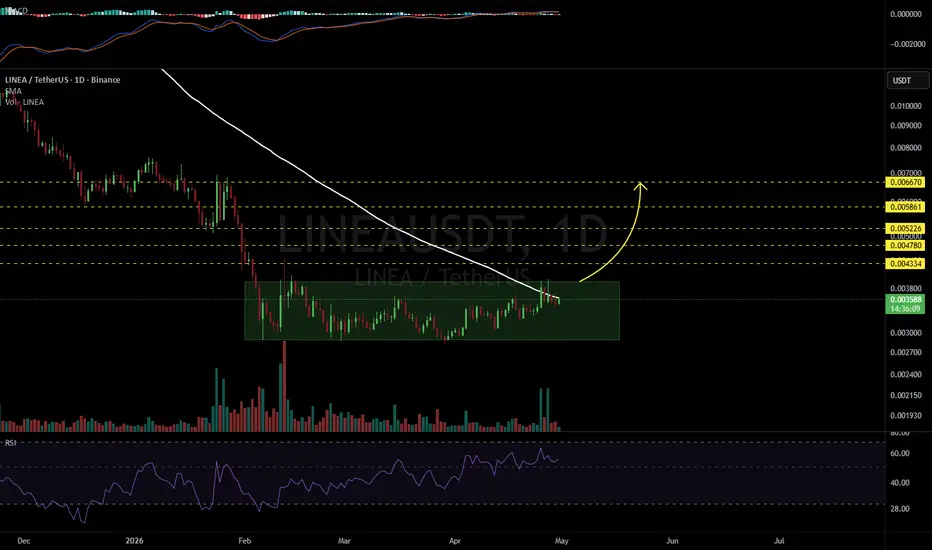
LINEAUSDT 1D#LINEA is moving within a range and testing the daily SMA100. It is also breaking above the Ichimoku cloud, which looks promising. In case of a confirmed breakout above the SMA100, the potential upside targets are:
🎯 $0.004334
🎯 $0.004780
🎯 $0.005226
🎯 $0.005861
🎯 $0.006670
⚠️ Always remember to use a tight stop-loss and maintain proper risk management.
LINEAUSDT 12H#LINEA has been consolidating within a box on the 12-hour chart for several months and is currently testing the 12H SMA200. Keep an eye on it. In case of a breakout above the SMA200, the potential upside targets are:
🎯 $0.004328
🎯 $0.004775
🎯 $0.005222
🎯 $0.005858
🎯 $0.006669
⚠️ Always remember to use a tight stop-loss and maintain proper risk management.
Linea at bottom, opportunity buy zone active (1,582% New ATH)The highest volume ever appeared first in December—mid-December 2025—strong buying; showing that something is up, something is coming, something is happening.
The market continues lower.
LINEAUSDT continued to drop even after the highest volume ever with a bullish close. Come early February 2026, and volume starts to go up again, the second highest on a single session. This time, instead of lower and a bearish continuation Linea starts to move sideways... And we already know what to expect next.
When the highest volume showed up first last year, it warned us that we were getting close to the bottom. When the same phenomenon is repeated but at lower prices, we know the bottom is in.
Then comes marketwide action and the similarities across trading pairs.
Many projects are in this same situation: A bottom 6-February 2026, sideways action then growth. We have the same sequence here missing only the last step.
LINEAUSDT is set to grow. The bottom is in. This is a perfect entry range, the opportunity buy-zone.
Thank you for reading.
Namaste.
Linea at bottom, opportunity buy zone active (1,582% New ATH)The highest volume ever appeared first in December—mid-December 2025—strong buying; showing that something is up, something is coming, something is happening.
The market continues lower.
LINEAUSDT continued to drop even after the highest volume ever with a bullish close. Come early February 2026, and volume starts to go up again, the second highest on a single session. This time, instead of lower and a bearish continuation Linea starts to move sideways... And we already know what to expect next.
When the highest volume showed up first last year, it warned us that we were getting close to the bottom. When the same phenomenon is repeated but at lower prices, we know the bottom is in.
Then comes marketwide action and the similarities across trading pairs.
Many projects are in this same situation: A bottom 6-February 2026, sideways action then growth. We have the same sequence here missing only the last step.
Since what one project does, the rest tends to follow, we know what to expect.
LINEAUSDT is set to grow. The bottom is in. This is a perfect entry range, the opportunity buy-zone.
Thank you for reading.
Namaste.
LINEAUSDT – at Key Support, Reversal or Further Breakdown?On the 1D timeframe, the price action of LINEA against Tether is still in a strong downtrend, clearly indicated by the descending trendline (yellow line).
Currently, price is entering a tight consolidation phase (compression) right at a key demand zone, marked by the yellow block in the 0.0032 – 0.0028 range.
---
📉 Structure & Pattern
🔻 Descending Triangle / Bearish Compression
Price continues forming lower highs along the descending trendline
Strong horizontal support at 0.0032 – 0.0028
This creates a descending triangle, which statistically leans toward a bearish continuation pattern
However…
⚠️ Potential Reversal (Accumulation Zone)
The yellow zone indicates a possible accumulation area
Repeated rejections from the bottom suggest buyers are stepping in
A breakout could act as an early reversal signal
---
🟢 Bullish Scenario
📈 Bullish Confirmation:
Break and close above the descending trendline
Break minor resistance at 0.0036 – 0.0040
🎯 Bullish Targets:
0.0040 (initial resistance)
0.00525 (mid resistance)
0.00660 (major resistance / main target)
💡 Narrative: If price successfully breaks out of the trendline pressure, it signals a structural shift from lower highs → higher highs, opening the door for a stronger rally.
---
🔴 Bearish Scenario
📉 Bearish Confirmation:
Breakdown below 0.0028 support
Strong candle close below the demand zone
🎯 Bearish Targets:
Potential continuation to new lower lows
Lower psychological levels (no strong support identified yet)
💡 Narrative: If support fails, the descending triangle confirms as a bearish continuation pattern, extending the ongoing downtrend.
---
📌 Conclusion
Main trend: Bearish
Current condition: Consolidation at key support
Critical zone: 0.0032 – 0.0028 (decision zone)
👉 The market is currently at a decision point — a breakout or breakdown will determine the next major move.
#LINEA #LINEAUSDT #CryptoAnalysis #TechnicalAnalysis #BearishPattern #DescendingTriangle #BreakoutSetup #AltcoinAnalysis
#CryptoTrading #SupportResistance #SmartMoney #PriceAction
LINEA Breaking Out of Compression StructureLINEA has been consolidating after a prolonged downtrend, forming a compression structure with higher lows while testing horizontal resistance near 0.0033–0.0034. This tightening price action suggests that momentum is building for a directional move.
Price is currently attempting to break above the consolidation resistance, while the rising trendline continues to support higher lows. This structure reflects increasing bullish pressure as buyers gradually push price toward the breakout level.
If LINEA successfully breaks and holds above the resistance zone, the next upside target sits around 0.00426, which represents the next major supply level.
However, if the breakout fails and price loses the ascending support near 0.00286, the structure would invalidate the bullish setup. In that case, the market could revisit the lower support zone and potentially continue toward the broader descending trendline.
For now, LINEA is at a key breakout point, where the reaction around the current resistance will determine whether the market expands upward or resumes the broader downtrend.
LINEA BUYER INTEREST INCREASED🔥 Fortune AI Radar — CRYPTOCAP:LINEA
Fresh activity detected on CRYPTOCAP:LINEA today.
Data suggests increasing market interest & buyers stepping in.
Technicals currently lean bullish, with momentum trending upward.
Whales showing hints of accumulation and hype rising among trader
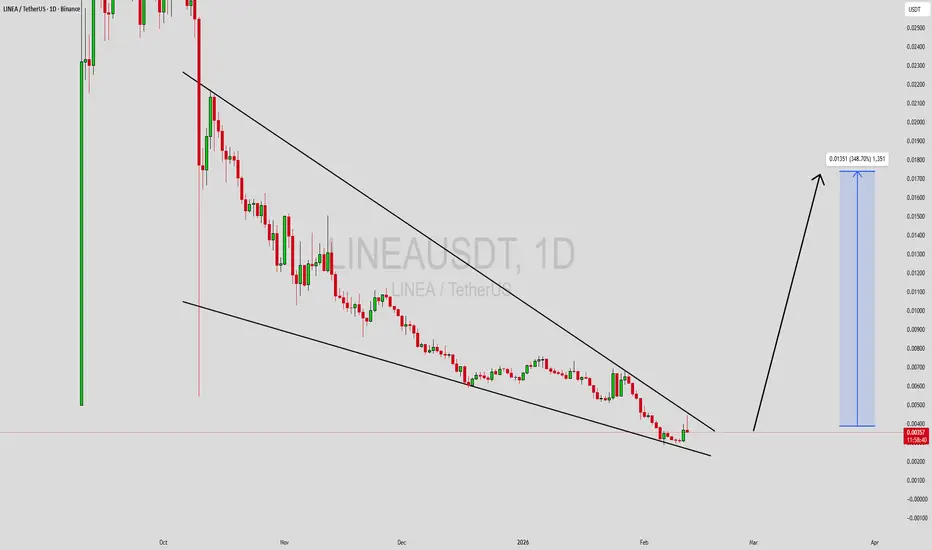
LINEAUSDT Forming Falling WedgeLINEAUSDT is forming a clear falling wedge pattern, a classic bullish reversal signal that often indicates an upcoming breakout. The price has been consolidating within a narrowing range, suggesting that selling pressure is weakening while buyers are beginning to regain control. With consistent volume confirming accumulation at lower levels, the setup hints at a potential bullish breakout soon. The projected move could lead to an impressive gain of around 290% to 300% once the price breaks above the wedge resistance.
This falling wedge pattern is typically seen at the end of downtrends or corrective phases, and it represents a potential shift in market sentiment from bearish to bullish. Traders closely watching LINEAUSDT are noting the strengthening momentum as it nears a breakout zone. The good trading volume adds confidence to this pattern, showing that market participants are positioning early in anticipation of a reversal.
Investors’ growing interest in LINEAUSDT reflects rising confidence in the project’s long-term fundamentals and current technical strength. If the breakout confirms with sustained volume, this could mark the start of a fresh bullish leg. Traders might find this a valuable setup for medium-term gains, especially as the wedge pattern completes and buying momentum accelerates.
✅ Show your support by hitting the like button and
✅ Leaving a comment below! (What is your opinion about this Coin?)
Your feedback and engagement keep me inspired to share more insightful market analysis with you!
LINEA/USDT at Decision Zone — Breakout or Further Decline?LINEA/USDT remains in a medium- to long-term bearish structure. Since the peak around the 0.043+ area, price has consistently formed lower highs and lower lows, confirming strong seller dominance. Currently, price is trading near the lower boundary of the structure, close to historical lows, while also interacting with the major descending trendline.
---
Pattern Explanation
Primary Pattern: Descending Trendline / Bearish Trend
A well-defined descending trendline connecting the major highs.
Every rebound attempt has been rejected by this trendline.
Market Structure
The overall structure remains Lower High – Lower Low (LH – LL).
No valid break of structure (BOS) toward bullish conditions so far.
Price Behavior
Price recently showed a minor bounce, but remains capped below the descending trendline, indicating bearish continuation unless a breakout occurs.
---
Key Levels
Resistance Zones:
0.00750 (nearest resistance & trendline area)
0.00930
0.01090
0.01300
0.01500
0.02125 (major resistance / distribution zone)
Support Zones:
0.00632 – 0.00600 (current minor support)
0.00500 (major support / all-time low area)
---
Bullish Scenario
Price successfully breaks and closes above the descending trendline on the daily timeframe.
Additional confirmation if price:
Holds above 0.00750
Forms the first higher low
Bullish targets:
0.00930
0.01090
0.01300
This scenario is considered a relief rally or corrective move, unless a major structure shift occurs.
---
Bearish Scenario
Price fails to break the trendline and gets rejected.
A valid bearish continuation if:
Daily close below 0.00600
Downside targets:
0.00500 (key support)
If 0.00500 fails, the risk of new lower lows increases due to lack of historical demand below this zone.
---
Conclusion
LINEA/USDT is still under strong bearish pressure. As long as price remains below the descending trendline, any upward movement is likely to be a pullback before continuation to the downside. A bullish bias only becomes valid after a confirmed trendline breakout with structural change. Traders should wait for clear confirmation and maintain strict risk management.
#LINEAUSDT #LINEA #CryptoAnalysis #TechnicalAnalysis #BearishTrend #DescendingTrendline #Altcoin #MarketStructure #SupportResistance
LINEABINANCE:LINEAUSDT
LINEA/ USDT
Entry range (0.0060- 0.0063)
SL 4H close below 0.00543
T1 0.0068
T2 0.007
T3 0.008
T4 0.009
T5 0.010
2 optional extra target on the chart
_______________________________________________________
Golden Advices.
********************
* collect the coin slowly in the entry range.
* Please calculate your losses before the entry.
* Do not enter any trade you find it not suitable for you.
* No FOMO - No Rush , it is a long journey.
#LINEA/USDT Forming Bullish Wave#LINEA
The price is moving in a descending channel on the 1-hour timeframe. It has reached the lower boundary and is heading towards breaking above it, with a retest of the upper boundary expected.
We have a downtrend on the RSI indicator, which has reached near the lower boundary, and an upward rebound is expected.
There is a key support zone in green at 0.00865. The price has bounced from this level multiple times and is expected to bounce again.
We have a trend towards consolidation above the 100-period moving average, as we are moving close to it, which supports the upward movement.
Entry price: 0.00905
First target: 0.00939
Second target: 0.00984
Third target: 0.01039
Don't forget a simple principle: money management.
Place your stop-loss below the support zone in green.
For any questions, please leave a comment.
Thank you.
Futures Trading: Long on LINEA/USDT❇️ New Futures Signal
📈 Pair: LINEA/USDT
⚡ Direction: Buy Long
🎚️ Leverage: 10x
Entry: 0.02640
Stop Loss (SL): ❌ 0.0252
Take Profits (TPs):
✅ TP1: 0.031
✅ TP2: 0.035
✅ TP3: 0.040
💡 Reasoning: Testing Strong Demand Zone.
❇️ Always use proper risk management.
👉 Do you agree with this setup? Comment below 👇
LINEAUSDT Forming Bullish WaveLINEAUSDT is showing a strong bullish wave pattern that signals momentum is building for a potential breakout move. The structure reflects sustained accumulation, supported by good trading volume, which highlights that investors are actively positioning themselves. With this technical setup, the pair is projected to aim for gains around 90% to 100%+, making it an attractive candidate for traders looking for high-reward opportunities.
The bullish wave formation often acts as a continuation of upward momentum, and LINEAUSDT appears to be respecting this setup well. The price action has been consolidating in a healthy manner, creating a strong base that could fuel a sharp rally once resistance levels are cleared. This type of accumulation phase typically precedes impulsive moves, giving traders confidence in the medium-term outlook.
Investor interest is also on the rise, as seen from both volume participation and the consistency of market support. If momentum continues to build, LINEAUSDT could quickly establish itself as one of the notable performers in the current cycle. The alignment of technical structure, volume, and sentiment positions this pair favorably for the coming sessions.
✅ Show your support by hitting the like button and
✅ Leaving a comment below! (What is You opinion about this Coin)
Your feedback and engagement keep me inspired to share more insightful market analysis with you!
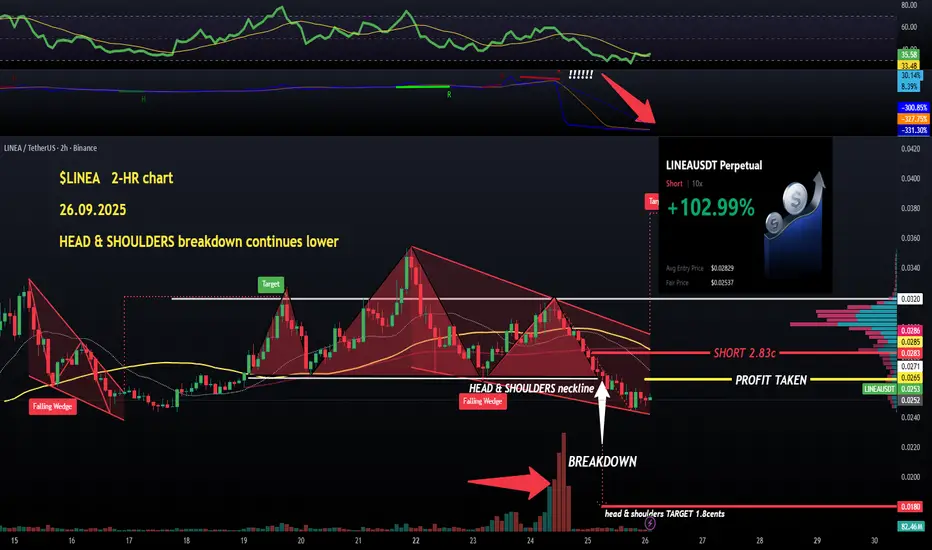
$LINEA ... HEAD & SHOULDERS breakdown continues lower$LINEA has continued with the HEAD&SHOULDERS breakdown targetting $0.018 cents. And there is going to be a LOT of unlocks in two weeks, 1.08 billion coins.
So, I'm keeping my LONG aiming for much lower prices, STOP LOSS placed at my entry price so zero risk.
As far as the chart, OBV has crashed and never recovered, at all. It means that there is a lot of stealth selling going on. Good for the bears.
Selling volumes were normal again on Thursday after gigantic red candles on Wednesday.
Which means there could be a bit of a relief rally, possibly, but the DOWNTREND has been established after the BREAKDOWN.
2.65c must be recovered to invalidate the Head&Shoulders. Let's wait and see💙👽
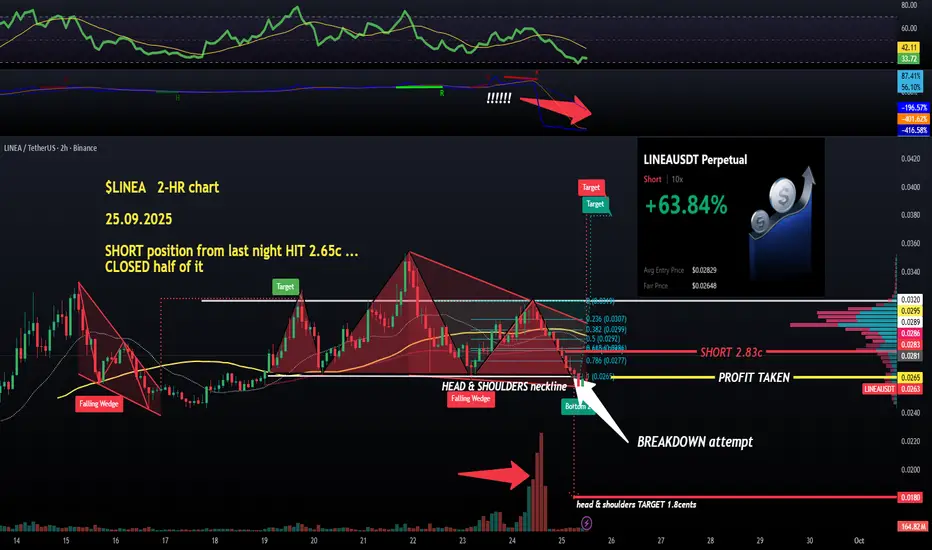
$LINEA: my short from last night (2.83c) PRINTING, H&S breakdown$LINEA is going to get really ugly if it loses the support it's sitting on at 2.64cents as it has a fully formed HEAD & SHOULDERS pattern.
If the neckline doesn't hold, we might see prices around 1.8c next.
Also OBV bearish divergence and the total crash with no recovery, massive red flag.
My long opened last night has been cashed in partially (50% of the size), and my next target is the 1.8c mark.
Moving my STOP LOSS to my entry price of $0.0283, zero risk now, the way i like it💙👽