LINK/USD WeeklyLINK is completing a multi-year A-B-C correction within a descending channel. We anticipate a final capitulation drop for Wave C into the ~$3.00 demand zone, aligning perfectly with macro support. A reversal from this lower boundary will conclude the mega-cycle correction and ignite a massive new impulsive bull run.
In-depth trading ideas
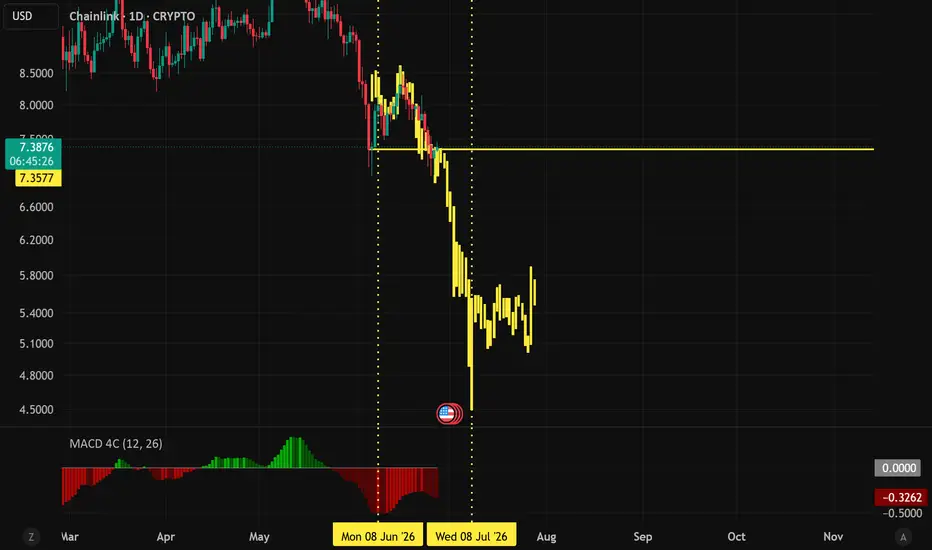
Chainlink Wave Analysis – 28 July 2026
- Chainlink reversed from resistance area
- Likely to fall to support level 8.00
Chainlink cryptocurrency recently reversed from the resistance area between the key resistance level 8.62 (which has been reversing the price from the middle of June), upper daily Bollinger Band and the 38.2% Fibonacci correction of the downward impulse from May.
The downward reversal from this resistance zone created the daily Japanese candlesticks reversal pattern Shooting Star.
Chainlink cryptocurrency can be expected to fall to the next support level 8.000 – former minor support from the middle of July.
Many Surprises on MAJOR Crypto Charts!Today's market scan delivered some unexpected conclusions . As I worked through the major crypto charts, one thing became increasingly clear:
🔥 Not every big-name altcoin is positioned equally.
Some charts are quietly building strength, while others are flashing warning signs beneath the surface. One of the biggest surprises? XRP is currently showing a stronger technical case than another major altcoin. I'll let you discover which one in the video. 😉
As always, I focus on what matters most:
✅ The key support and resistance levels
✅ The breakout zones that could trigger the next move
✅ The invalidation levels that every trader should respect
✅ The highest probability scenarios based on price action—not emotion
The market doesn't reward opinions.
It rewards traders who know their levels.
That's exactly what I cover throughout the video as we walk through the biggest crypto assets one by one, highlighting where buyers and sellers are likely to make their next stand.
🎯 If you've ever wondered why some coins outperform while others lag behind, this breakdown will give you a fresh perspective.
If you enjoyed the analysis and want more chart breakdowns like this, let me know by hitting the ❤️ button and leaving a comment with the asset you'd like me to cover next.
One Love,
The FXPROFESSOR 💙
link Exchange Supply Drops 12% as Institutional Adoption Exchange reserves for Chainlink are shrinking just as fresh institutional integrations continue stacking up. That’s usually the kind of combination bulls like to see, although the market still has plenty of technical hurdles left before celebrating.
Over the past month, more than 15.7 million LINK has left known exchanges, representing roughly a 12% decline in exchange-held supply. Another 1.04 million LINK exited exchanges on Sunday alone, making it one of the largest single-day outflows during the period. Fewer tokens sitting on trading venues generally reduce immediate selling pressure, suggesting holders are choosing accumulation over quick exits.
Institutional Adoption Keeps Building Momentum
Chainlink Exchange Supply Drops 12% as Institutional Adoption Accelerates
The timing of those outflows hasn’t happened in isolation. Chainlink has continued expanding its role across institutional infrastructure. DTCC processed production trades involving tokenized U.S. securities, with Chainlink participating as one of the technology providers. At the same time, CCIP expanded to Canton, enabling connectivity between the Canton Network and Ethereum through Chainlink’s interoperability architecture.
Meanwhile, United Stables selected Chainlink as its official oracle and cross-chain infrastructure provider to expand distribution of its $1 billion-plus U stablecoin native to BNB Chain, citing institutional-grade security as the primary reason behind the integration.
Utility Narrative Continues Growing
June added another notable catalyst. ADI Predictstreet, the official prediction market partner of the 2026 FIFA World Cup, adopted Chainlink as its exclusive oracle infrastructure for market settlement and instant payouts.
When exchange balances decline while new utility announcements continue arriving, it creates a stronger fundamental narrative than price action alone.
Can LINK Finally Escape Multi-Year Consolidation?
Chainlink Exchange Supply Drops 12% as Institutional Adoption Accelerates
Despite the improving backdrop, the weekly chart still demands patience. The lower boundary of Chainlink’s multi-year triangle continues acting as dynamic support, while $10 remains the first major resistance. A successful move above that level could shift attention toward $13 and $16, two price zones likely to determine whether the prolonged consolidation begins breaking higher.
If those resistance levels continue rejecting advances, the sideways trend could persist through the remainder of the year.
However, if ongoing ecosystem expansion and institutional adoption translate into sustained buying pressure, clearing both resistance zones could strengthen the longer-term structure and potentially place $30 into focus over time from the current LINK price near $8.50.
LINKUSD Triple Resistance Above 2023 Breakout SupportChainlink is trading just above a major breakout level from the long consolidation structure that began in 2023. That former breakout area is now acting as an important support pivot, while price is also pressing into a significant overhead resistance cluster.
The key issue here is the three-trendline resistance confluence directly above current price. LINK is currently below all three resistance lines, which keeps this area as the main decision zone.
At the same time, the daily chart is showing bullish RSI divergence, which suggests downside momentum has weakened. RSI is also currently above its average, keeping the bullish recovery attempt alive for now.
Bullish scenario
For the bullish thesis to strengthen, I would want to see:
A breakout above the full three-trendline resistance zone
Two daily closes above that entire zone
Ideally, a retest of the broken resistance as new support before continuation
If that breakout is confirmed and support holds on the retest, the next major upside objective would be a move toward the long-term macro breakdown retest shown above.
Alternate bullish pathway
Even if price gets rejected initially, that would not automatically invalidate the bullish case.
A controlled rejection and pullback could allow LINK to build a potential inverse head & shoulders structure, which may create a second breakout attempt later. I am not treating that pattern as confirmed now, but it is a structure worth monitoring if price pulls back constructively rather than breaking down impulsively.
Bearish scenario
If price remains rejected at the resistance confluence and RSI falls back below its moving average, the current bullish divergence thesis would weaken.
In that case, the next downside support areas I would watch are near:
5.75
4.94
Current takeaway
This is a wait-for-confirmation setup.
The market is sitting between an important breakout support and a major overhead resistance cluster. Bulls need to prove strength with two daily closes above the full confluence zone. Until that happens, this remains a conditional setup rather than a confirmed breakout.
Educational analysis only, not financial advice.
LINK Trading at a High-Conviction Accumulation ZoneChainlink has returned to one of the strongest technical support regions on the chart, presenting what appears to be a high-probability accumulation opportunity. Following the correction from the August 2025 lower high, price has retraced into the upper boundary of a multi-year consolidation range that was established after an extended period of sideways price action throughout 2022–2023. Historically, this zone has acted as a major demand area, making it a critical level to monitor.
This support has already proven its strength on multiple occasions. Buyers defended the region during the October 2025 retest, and the same level once again attracted demand in early February 2026. Multiple successful reactions from the same price zone increase its technical significance and reinforce the broader bullish market structure.
As long as LINK continues to hold above this support, the long-term outlook remains constructive. Rather than signaling weakness, the current price action appears consistent with an accumulation phase, where larger market participants gradually build positions before the next directional move.
Even if price briefly sweeps below the recent swing low, it would likely represent liquidity collection rather than the start of a new bearish trend. From a structural perspective, the downside appears relatively limited compared to the upside potential should bullish momentum return.
Another encouraging signal is the appearance of the first bullish weekly candle following the final leg of the correction. The most recent decline was significantly smaller than the primary impulsive selloff, suggesting bearish momentum is fading. This type of price behaviour often marks the final stage of a correction before a new impulsive wave begins.
Key Levels
Major Support: Current long-term accumulation zone.
Invalidation: A sustained weekly close below the established range would weaken the bullish thesis.
Bullish Confirmation: Continued higher lows followed by a breakout above the nearest resistance would confirm a trend reversal and increase the probability of a new bullish expansion.
Bottom Line: The broader market structure remains intact, and LINK is trading within a historically significant demand zone. As long as this support continues to hold, the risk-to-reward profile favours accumulation while positioning for the next leg higher.
Chainlink Wave Analysis – 15 July 2026 - Chainlink broke resistance zone
- Likely to rise to resistance level 8.62
Chainlink cryptocurrency recently broke the resistance zone between the resistance level 8.16 (which stopped earlier waves b and i) and the 38.2% Fibonacci correction of the downward impulse B from May.
The breakout of this resistance zone accelerated the active impulse waves iii and C – which belong to wave (B) from February.
Chainlink cryptocurrency can be expected to rise further to the next resistance level 8.62 – top of wave I from June – followed by 9.325.
LINK/USD 30-Minute Short Trading PlanLINK/USD 30-Minute Short Trading Plan
Basic Information
• Trading Pair: LINK/USD
• Timeframe: 30-Minute Chart
• Trading Bias: Bearish Short
• Current Market Price: 8.00559
Key Structural Zones
• Major Resistance Zone: 8.09286 – 8.16300
• Major Support Zone: 7.04971 – 7.15280
Entry & Hard Stop Loss Setup
• Market Entry Price: Around 8.00742, immediate short entry near the lower boundary of key structural resistance
• Fixed Hard Stop Loss Level: 8.06065
Core logic: Initiate short positions adjacent to resistance with a tight hard stop loss to cap maximum single-trade drawdown, seeking large downside trend moves with superior risk-reward odds.
Tiered Take Profit & Dynamic Risk Management Rules
1. First Take Profit Target: 7.75183
Liquidate 50% of total position, shift protective stop loss to achieve full breakeven risk protection.
2. Second Take Profit Target: 7.53620
Close 50% of remaining position, re-calibrate trailing stop loss to lock cumulative floating profits.
3. Third Take Profit Target: 7.18125
Cut down most residual position and refresh dynamic stop loss. Reserve a tiny trailing position to capture sustained bearish momentum.
Trading Logic
The current price trades closely beneath the critical 30-minute resistance zone with clear overhead selling pressure. This bearish setup utilizes a tight stop loss entry near resistance to strictly limit downside risk, while tiered partial liquidation unlocks full profit potential for large unilateral downtrend moves. The strategy exclusively executes setups with high risk-reward ratios, relying on controlled small drawdowns to speculate on deep market corrections.
Full Crypto Trading Risk Disclaimer
This trading plan serves solely for educational and analytical reference, and does not constitute financial advice, investment counsel or trading solicitation. Cryptocurrency markets feature extreme price volatility, liquidity gaps, regulatory ambiguity and digital asset security risks. All trading choices, profits and losses rest entirely on the individual trader. Past technical structure performance does not guarantee future market behavior. Traders must apply rigorous position sizing and disciplined risk management to every order, and never deploy capital that you cannot afford to lose entirely.
LINK/USD 30-Minute Short Trading PlanLINK/USD 30-Minute Short Trading Plan
Trading Pair: LINK/USD
Timeframe: 30-Minute
Key Price Zones
Resistance Zone: 8.04622 – 8.16422
Support Zone: 7.51395 – 7.57672
Trade Setup
Trade Direction: Short
Entry Price: Around 7.92000, enter short position near the upper resistance zone.
Stop Loss Level: 8.00000
Invalidation Rule: Hold all short positions if price fails to break above 8.00000; fully close all short positions once price breaks and closes above 8.00000.
Take Profit & Risk Management Rules
1. First Target Level: 7.79287
Reduce half of the total position, trail the stop loss higher to lock partial profits.
2. Second Target Level: 7.67294
Reduce half of the remaining position, readjust the trailing stop loss.
3. Third Target Level: 7.54200
Reduce half of the leftover position, update the trailing stop loss.
Keep the last partial trailing position running with the protective stop in place.
Disclaimer & Risk Warning
Cryptocurrency trading carries extreme risks including drastic price volatility, leverage liquidation, slippage, liquidity gaps and regulatory policy risks. Past market performance cannot represent future price trends. This trading plan is only for personal trade recording and shall not be regarded as investment advice or trade recommendation. All trading decisions, profits and losses shall be borne solely by the trader. Only trade with funds you can fully afford to lose.
LINK Is Targeting A Level That Has Held For Four YearsOf Course This Time Is Different. It Always Is.
Every cycle has its own story.
In 2022, LINK collapsed into this support zone because crypto was in a bear market.
In 2023, it held because the market was recovering.
In 2024, buyers defended it again despite repeated volatility.
Now in 2026, price is approaching the exact same area once more, but once again the narrative is supposedly different.
The chart itself doesn't care about narratives.
It only cares about structure.
Trend Structure
The long-term structure remains mixed.
The dominant feature is the descending trendline connecting the major cycle highs, creating a clear sequence of lower highs since 2021.
At the same time, the market has repeatedly defended the same support region, creating a massive compression structure.
This is effectively a battle between long-term sellers and long-term buyers.
Support / Resistance
The most important support visible on the chart is the highlighted 4-year Support Zone around 5.80.
This area has acted as a floor multiple times since 2022.
The primary resistance remains the descending trendline that has rejected every major rally attempt since the cycle peak.
Until one of these boundaries breaks, LINK remains trapped inside a giant range.
Moving Averages
The 1W MA50 has rolled over and sits above price.
The 1W MA200 remains relatively flat and is currently near the middle of the broader range.
Price trading beneath the MA50 reflects weakening momentum, while the MA200 continues to act as a long-term equilibrium level.
Indicators Visible
RSI remains weak and is trading below the midpoint region.
Momentum has been deteriorating since the beginning of 2025.
No obvious bullish divergence is visible on the chart.
Instead, RSI continues to reflect a market struggling to regain sustained momentum.
Chart Pattern
The strongest pattern visible is a Multi-Year Descending Triangle .
Characteristics:
• Descending resistance since 2021
• Flat support zone around 5.80
• Multiple tests of both boundaries
This is one of the largest structures visible on the entire chart.
The eventual resolution could determine LINK's next major cycle.
Momentum
Momentum currently favors the bears.
Price remains below the declining MA50.
RSI remains weak.
The market is producing lower highs while approaching support.
However, support itself has not yet broken.
That distinction is important.
Bullish Scenario
If the support zone holds once again, LINK could attempt another move toward the descending trendline.
Such a move would likely be accompanied by RSI recovery and a reclaim of the weekly MA50.
The key argument for bulls is simple:
This support has survived multiple years already.
Bearish Scenario
If support around 5.80 fails, the entire multi-year base would be invalidated.
That would represent the first structural breakdown of the support zone since its formation.
This is why the current test is arguably the most important technical event on the chart.
Institutional Interpretation
Large multi-year support zones often become more important with every successful defense.
The more times a level survives, the more attention it attracts.
That is exactly what appears to be happening here.
Key Conclusion
This chart is not about whether LINK is bullish or bearish today.
It is about whether a four-year support zone can survive yet another test.
Everything else is secondary.
Discussion Question
If LINK reaches 5.80 again, do you believe buyers defend it for a fifth time, or does the level finally break?
LINK/USD 4H Short Trading PlanLINK/USD 4H Short Trading Plan
Symbol: LINK/USD
Timeframe: 4-Hour
Direction: Short
Entry: 10.61541
Stop Loss: 11.13885
Take Profit & Position Management
1. First Target: 9.81650,Reduce half position and move stop loss to breakeven.
2. Second Target: 9.20175,Reduce half of the remaining position and adjust stop loss for protection.
3. Third Target: 8.29400,Make further position reduction and trail stop loss.
4. Last Position: Keep the last partial position running with trailing stop loss.
Risk Warning
Cryptocurrency trading involves high market risk. Please strictly follow stop loss and take profit rules, and control position size reasonably.
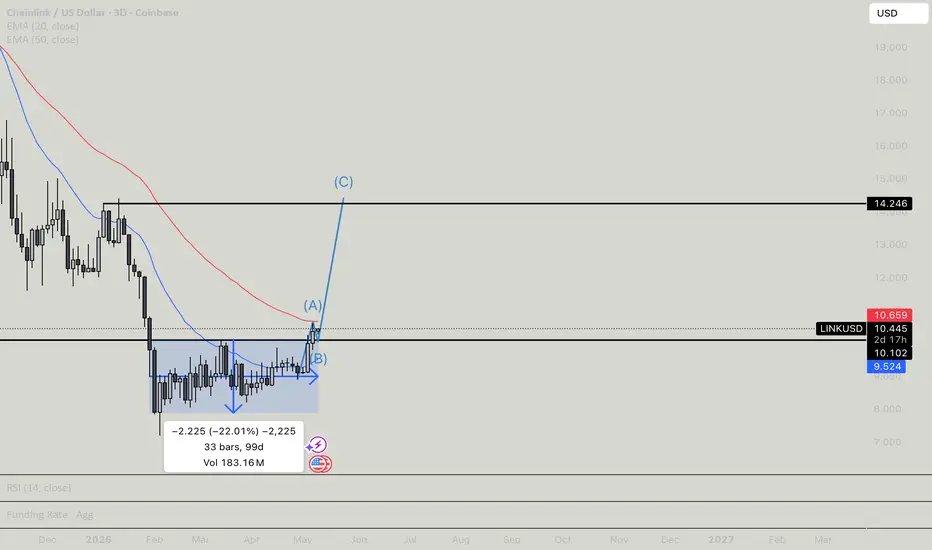
$14 LONG SET UPPrice has already broken the major resistance zone, which previously forced the token to trade under $10 for more than 3 months.
Price may retrace to $10, as there should be massive buy orders there, and once it does, it will pump up to the previous resistance area at $14.
Price has already hit the first key level; the second target is $14.
If it goes to $9, I’ll exit at a loss, but that’s a risk I’m willing to take.
There’s bullish fundamental news on this token.
I’m willing to make the trade
**LINKUSD Ready for Massive Bullish Continuation After TrendlineLINKUSD on the 4H timeframe is showing a strong bullish recovery after breaking out from a long-term descending trendline that controlled the market for months. The structure is beginning to shift in favor of buyers as momentum continues building near key resistance zones.
### 🔍 Market Structure Analysis:
* Clear breakout above descending resistance trendline.
* Bullish momentum increasing after consolidation phase.
* Buyers defending higher lows consistently.
* Price attempting to create a new bullish structure.
The recent impulsive move suggests accumulation may already be complete, and bulls are now pushing toward the next major resistance area.
### 📌 Important Levels:
* **Current Market Price:** 10.59
* **Support Zone:** 9.30
* **Major Resistance / Target:** 12.65
* **Invalidation Zone:** 7.86
### 📈 Trade Setup:
The best scenario is continuation above the broken trendline with possible pullbacks acting as buying opportunities. As long as price holds above support, bulls remain in control.
### 🧠 What Makes This Setup Interesting?
* Months of bearish pressure finally weakening.
* Strong breakout momentum appearing on the 4H chart.
* Risk-to-reward setup remains attractive.
* Potential for trend reversal if resistance breaks successfully.
If LINKUSD closes strongly above nearby resistance, the market could accelerate toward higher liquidity zones very quickly.
### ⚠️ Risk Management:
Crypto remains highly volatile. Waiting for confirmation and proper entry positioning is safer than chasing candles after large moves.
Bulls currently have momentum, but holding above support is the key factor for continuation.
#LINKUSD #LINK #Chainlink #Crypto #TradingView #TechnicalAnalysis #Bullish #Breakout #Altcoins #CryptoTrading