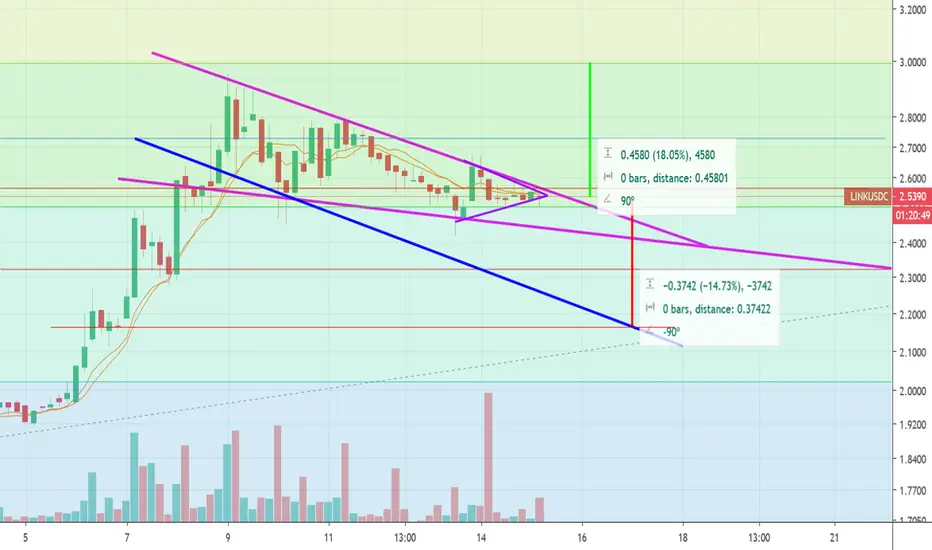
LINK/USDC - Technical Analysis, Trade setup review📊 LINK/USDC - LONG SETUP ANALYSIS
🔍 Key Observations:
Current Price: $8.431 USDC (down 1.20% on the day)
Volume: 303.9K (significant volume at current levels)
Range: High $10.867 / Low $7.001
📈 Technical Setup:
Bullish Patterns:
Inverted Dome formation detected at current levels
Historically leads to upside moves, expected return: Potential +9.913% from current levels.
Volume Spike at support zone, 303.9K volume indicates institutional interest
VolumePattern scanner shows accumulation.
Strong support at $8.391 (today's low)
Major support at $7.001 (historical bottom)
Imbalance: -14.6% (bearish imbalance but signal still present)
📝 Entry Notes:
Stage: Accumulation Phase
Expected Move: 4%+ in the session
Target: $8.7901 USDC
In-depth trading ideas
Link double bottomLink has formed a double bottom on the 4hour. If Btc rallies and link hits the neckline it will shape up for a nice catalyst to start off its rebound to prior highs. I believe the cheap “super discounted” link time has passed but we will see I suppose. Wait for neckline resistance to be broken and held for entry.
Chainlink last low accumulation zone?Chainlink (LINK) Technical Outlook
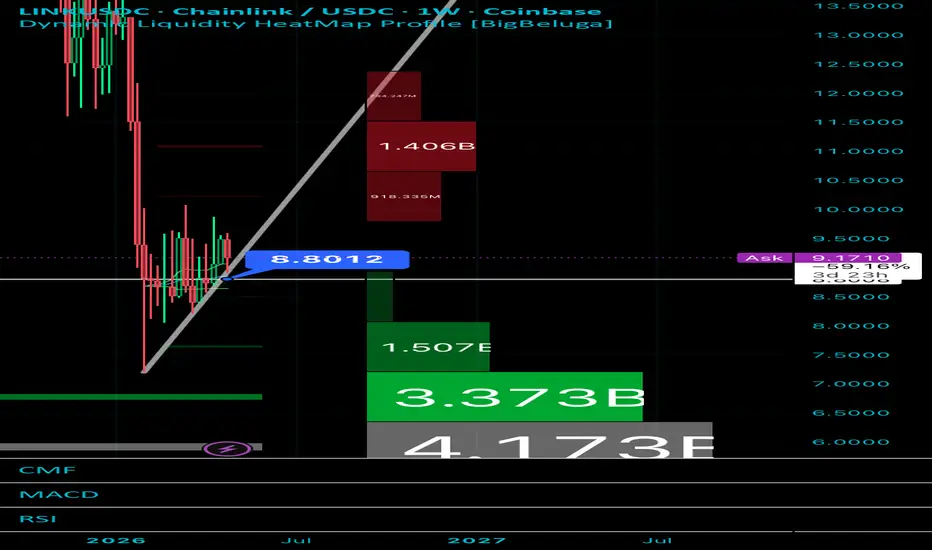
Chainlink is currently approaching a critical support zone around $8.80. This level represents a significant confluence where prior swing highs (now acting as support) intersect with the most recent lows, making it a key technical area to watch.
If this support fails to hold, the price could potentially retest lower zones, with some analysts pointing to a possible extension down toward the $5.00 area in a deeper corrective move. However, a breakdown through $8.80 might also set up a classic short trap — aggressive shorts entered prematurely could get squeezed if the level ultimately holds.
Conversely, if price successfully tests and rejects this support zone, it could mark the final major accumulation area before a reversal. Historically, LINK has exhibited strong volatility and sharp rebounds whenever it reaches these lower ranges, often driven by institutional inflows.
Smart money appears to still be actively accumulating in these discounted levels. With Bitcoin showing signs of stabilization, LINK looks well-positioned for a significant retrace toward its previous all-time highs — and potentially beyond — in the coming months.
On the fundamentals side, Chainlink continues to strengthen its position as the leading decentralized oracle network. Recent infrastructure upgrades, the growing adoption of its Cross-Chain Interoperability Protocol (CCIP), and high-profile institutional deals — including the launch of the Spiko Amundi Overnight Swap Fund (SAFO) with Europe’s largest asset manager Amundi, which quickly surpassed $400 million in AUM — underscore its expanding role in bridging traditional finance with on-chain markets.
Overall, Chainlink combines compelling technical setup at current levels with powerful real-world utility and institutional momentum. While crypto markets remain volatile, the network’s deepening integration into tokenized assets and TradFi infrastructure positions LINK as one of the more fundamentally solid plays in the altcoin space for those with a longer-term horizon.
Link USD LONG IDEA. (BULLISH ORDER FLOW)Market Structure Context
Overall structure remains bullish (higher highs & higher lows).
Recent downside move is corrective, not impulsive.
No bearish break of structure on the higher timeframe → trend intact.
Key Zones (Institutional Interest)
Bullish Order Block at the origin of the last impulsive up-move.
⚠️ Disclaimer
This setup assumes normal market conditions.
Avoid trading during major news releases.
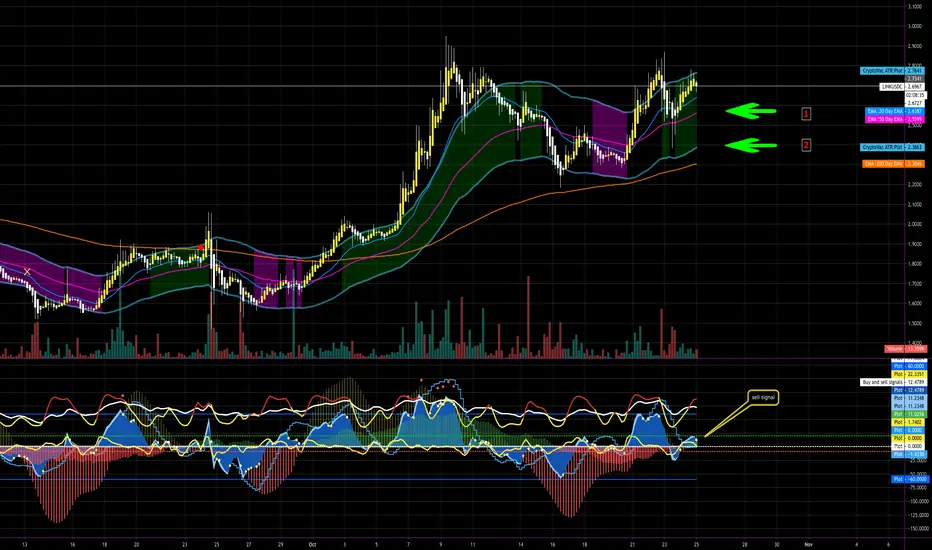
LINKUSD - Bullish CypherSee chart. Lots of hopium.
Bullish cyhper, ichimoku looks good for a reversal to a sustained up trend.
Zooming out: there's a formation of an inverse head and shoulders. If wave 4 is a throwback on the H&S, wave 5 could extend to hit the H&S target. Of course this is all very speculative. Just ideas of a green future.
LLong
LINK on long term trendlineLINK is moving on long term trendline which proved to be strong in the past. Above $20 level, LINK should get more strength, opposite, below trendline, the price will turn bearish. It is trading from oversold position, which is good entry point for accumulation. RSI momentum indicator is rising and closing on 50 level, indicating bulls are gaining on strength. MACD is also picking up, although still in negative territory. Intraday chart is still choppy and I’m waiting for a breakout on which I will take long position.
LINK will lots of room to the upsideZooming out to a seven-day period, most altcoins in the top 20 by market cap had outstanding returns and most of them outperformed Bitcoin. BTC.D dropped some 5% in last week, hinting a trend of swapping BTC for altcoins. LINK was one of them with massive 100% gain since 21st of July. The price skyrocketed at a breakout from falling wedge (red doted line).
The falling wedge is a bullish pattern that begins wide at the top and contracts as prices move lower. This price action forms a zone that slopes down as the reaction highs and reaction lows converge. In contrast to symmetrical triangles, which have no definitive slope and no bias, falling wedges slope down and have a bullish bias. However, this bullish bias cannot be realized until a resistance breakout occurs.
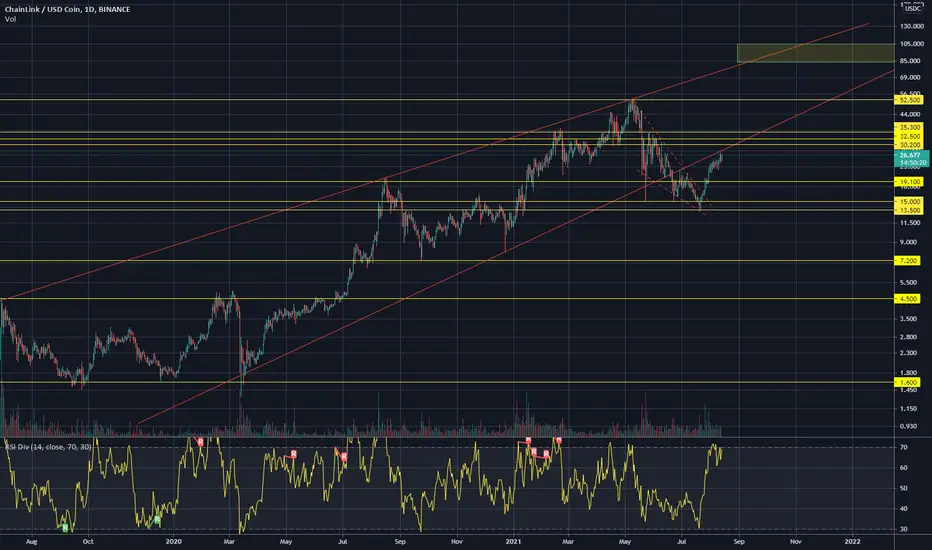
LINK is bullish in higher time frame but needs to break above major resistance at $30.20, after that the price will accelerate.
On daily and weekly chart, the price is forming a large wedge, which could play out somewhere around $80-$100 level (green box). It’s still too soon to call it, but that’s something I’m looking at in higher time frame.
Lower time frame is choppy, but still bullish. If BTC stays bullish or flat (just not sudden drop), then LINK should outperform. $30 is my fist TP, followed by $35 and $52. Ultimate target would be green box; 80$ - 100$, which could be reached in next several months. Supports are at $23, $15, and $13.350
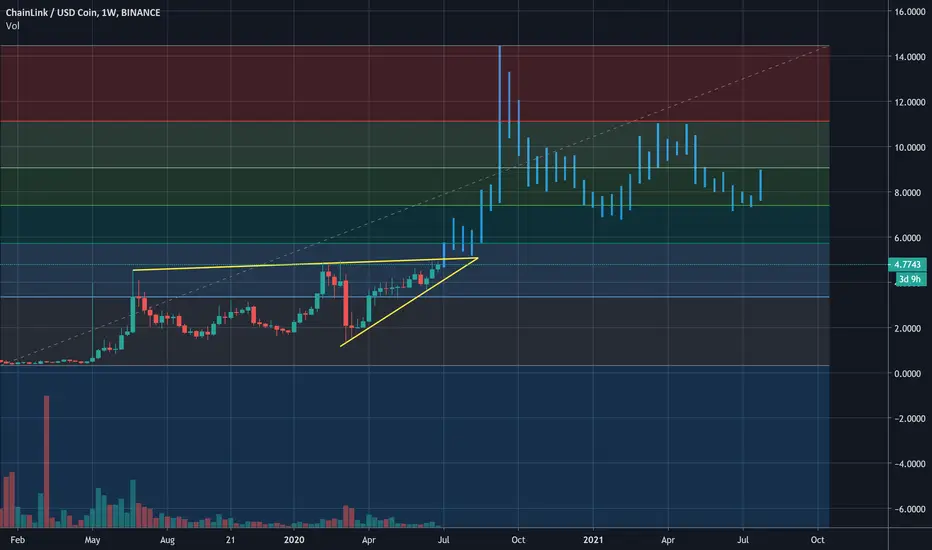
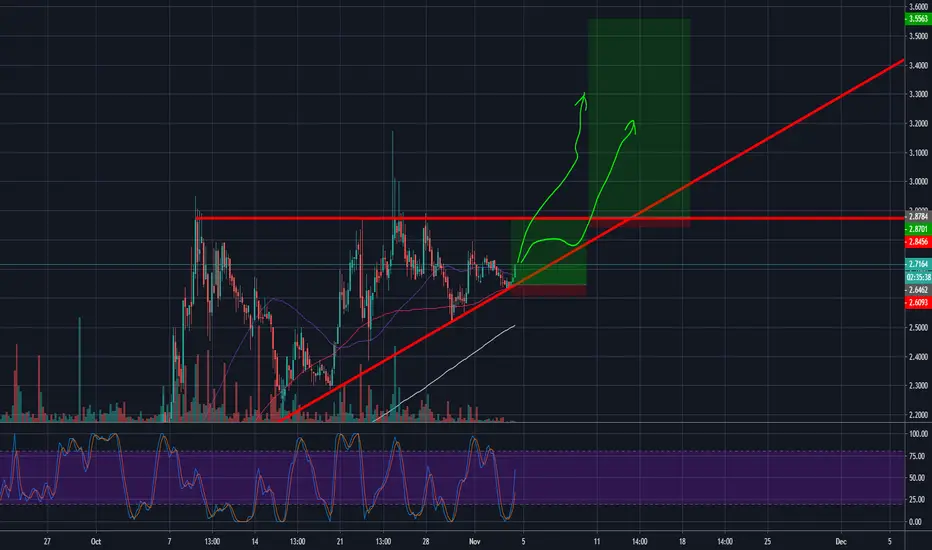
Silly link moon chartLooks like link will finally break out of its ascending triangle and go to new glorious all time highs.
Defi is gaining new traction and hype, most of Defi will need to use Link or alternative oracles.
China's BSN, or Blockchain Service Network is also Integrating Chainlink oracles.
Good times ahead
CHAINLINK (LINK) /USD : I think of a new ATHThere is only two ways for an asset UP or DOWN
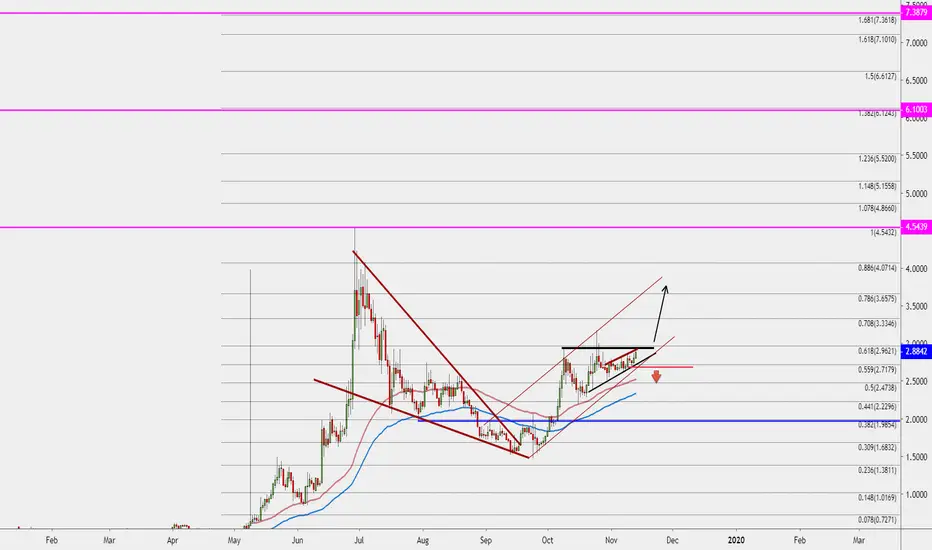
LINK is in a solide uptrend for years now.
After the last run up from 0.5$ to 4.5$ the coin has been ranging sidways...
All range must come to an end eventually either breaking up or breaking down.
The momentum of this coin is strong with no setback visible as of now.
I think this is an accumulation ragne until the next move higher. If the coin can trend above the last known resitance (2.82$) I expect new ATHs this year.
As the trend develope I will keep you fully updated.
disclamer: this is not financial advice and everyone involved in trading activities should know how to properly manage risk.
Chain link pattrens / motifsChain link making an interesting pattern over and over again, creating a big of the same pattern in thus creating a reverse head and shoulder
breaking the 3.20 mark would be an epic move to the upside
Chain link faisant un motif intéressant encore et encore, créant un gros du même motif en créant ainsi une tête et une épaule inversées
Briser la barre des 3.20$ serait un mouvement épique à la hausse
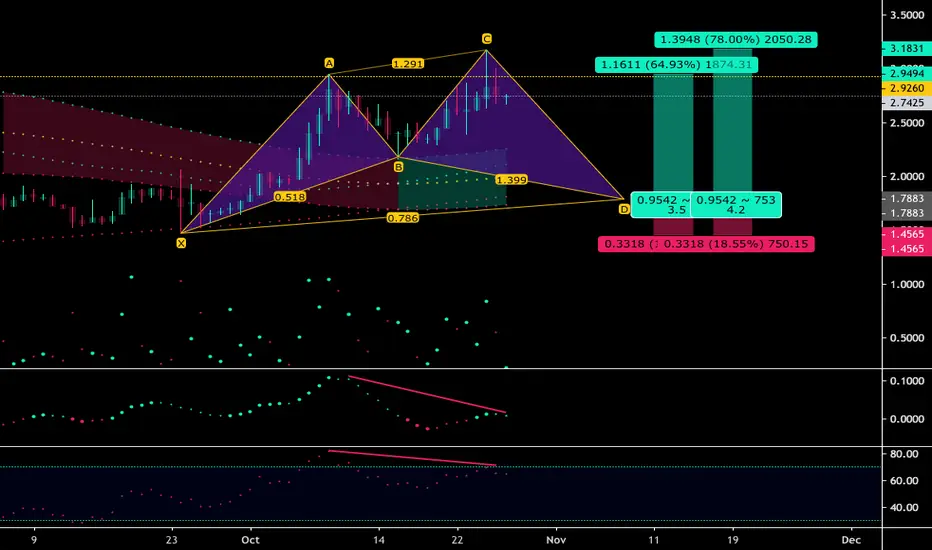
Link Potential Bullish CypherDaily Bearish Divergence on Link at a critical fib node. It is playing out as we speak. I don't recommend going short right now. But the best possible trade set up right now is at the pcz of the potential Bullish Cypher if we could ever get there. Risk/Reward and Exit/Stop's are depicted on the chart.
Twitter: twitter.com
If you want to be a loving supporter of me and my "ChArtworks"
$BTC: 35tmT7MAQXZm7rr1KzZMWNRpN2iyrnSB4z
$LTC: LVfCT9fu4dYyFAo5cW5xLrzHZHWFoG85hn
$ETH: 0x390d207b9bde62f2806caddfb94809de61da50d9
$x42: XZXm43FJcZHEVNs9dh8mdfzWyY6VfmJvPc
Donations are never required but they are greatly appreciated! Your Supportive comments and follows are just good enough too :D <3
Join the best Crypto and Technical Analysis Community in the world!
Discord: discord.gg
(Mitch Ray's Channel) Amazing community and I highly recommend checking out Mitch Ray if you haven't yet!